Summary
The overall condition of rivers across NSW is moderate. Aquatic ecosystems in the major rivers of the Murray-Darling Basin are generally in poorer condition than those in coastal rivers.
The major inland river systems are affected by the ongoing impacts of water extraction, altered river flows, and catchment changes such as vegetation clearing. Generally, the greatest signs of ecosystem stress occur where flow regimes have changed most.
Most coastal rivers are less affected than inland rivers by water extraction and flow regulation. With the exception of their fish communities, coastal rivers are generally in better ecological health.
Fish communities are in poor condition across the state but are improving within the Murray-Darling Basin. The widespread distribution of introduced carp in the Murray-Darling Basin has had a significant impact on the health of fish communities.
Exceedances of water quality standards for the nutrients phosphorus and nitrogen increased slightly during the period 2015–17. The increase is mainly due to the effects of flooding in some inland catchments in 2016. Salinity is relatively stable in most streams surveyed.
Water management initiatives aim to balance human uses of water with environmental water, to maximise the outcomes for river and wetland health. Fifty-eight water sharing plans have been finalised for all water sources in NSW.
In the Murray-Darling Basin, these plans will underpin the development of nine surface water resource plans by 2019, which will detail rules for planned environmental water and 11 groundwater plans.
Related topics: Threatened Species | Invasive Species | Water Resources
NSW Indicators
| Indicator and status | Environmental trend |
Information reliability |
|
|---|---|---|---|
| River condition index for NSW rivers |
|
Stable | ✔ |
| Health of fish assemblages |
|
Getting better | ✔✔ |
| Salinity |
|
Stable | ✔✔ |
| Nitrogen and phosphorus levels |
|
Stable | ✔✔ |
Notes:
Terms and symbols used above are defined in How to use this report.
Context
NSW has approximately 58,000 kilometres (km) of rivers and major streams. They can be categorised as:
- short, high-gradient coastal streams
- long, low-gradient inland rivers.
About 97% of river length in NSW has been substantially modified (NLWRA 2002). Yet healthy river ecosystems, comprising rivers, their riparian zones, floodplains and wetlands, are vital to aquatic and terrestrial biodiversity.
Healthy rivers are also critical for the ecosystem services needed to maintain good water quality and supply. Rivers are vital to support economic growth and enable human activities, including agriculture, aquaculture, fishing, recreation and tourism.
Rivers and aquatic ecosystems are under pressure from:
- regulation of river flows
- extraction of water from rivers
- clearing of riverside vegetation
- diffuse source water pollution, including agricultural runoff and urban stormwater
- sedimentation from runoff and the erosion of land and river banks
- introduction and expansion of exotic species.
A primary objective of river management is to achieve a long-term balance: preserve the integrity of natural systems but also provide for a range of beneficial human uses.
Status and Trends
Ecosystem health
The River Condition Index (RCI), developed in 2012, replaces the Sustainable Rivers Audit (SRA). The SRA was used in earlier State of the Environment Reports (DECCW 2009; EPA 2012) and to consistently assess rivers within the Murray-Darling Basin, across states.
The RCI is a simpler, more readily-available assessment of river condition in NSW. Applicable to all rivers in NSW, the RCI's five component indexes are:
- riparian vegetation cover
- hydrological stress
- biodiversity condition
- geomorphic condition
- catchment disturbance.
The RCI technical manual (Healey et al. 2012) details how the index is determined, its data inputs and its relationship to the SRA's more comprehensive approach. Spatially, the RCI covers all of NSW. However, not all river systems have data for all RCI indexes. In some cases, the RCI draws on data from the SRA.
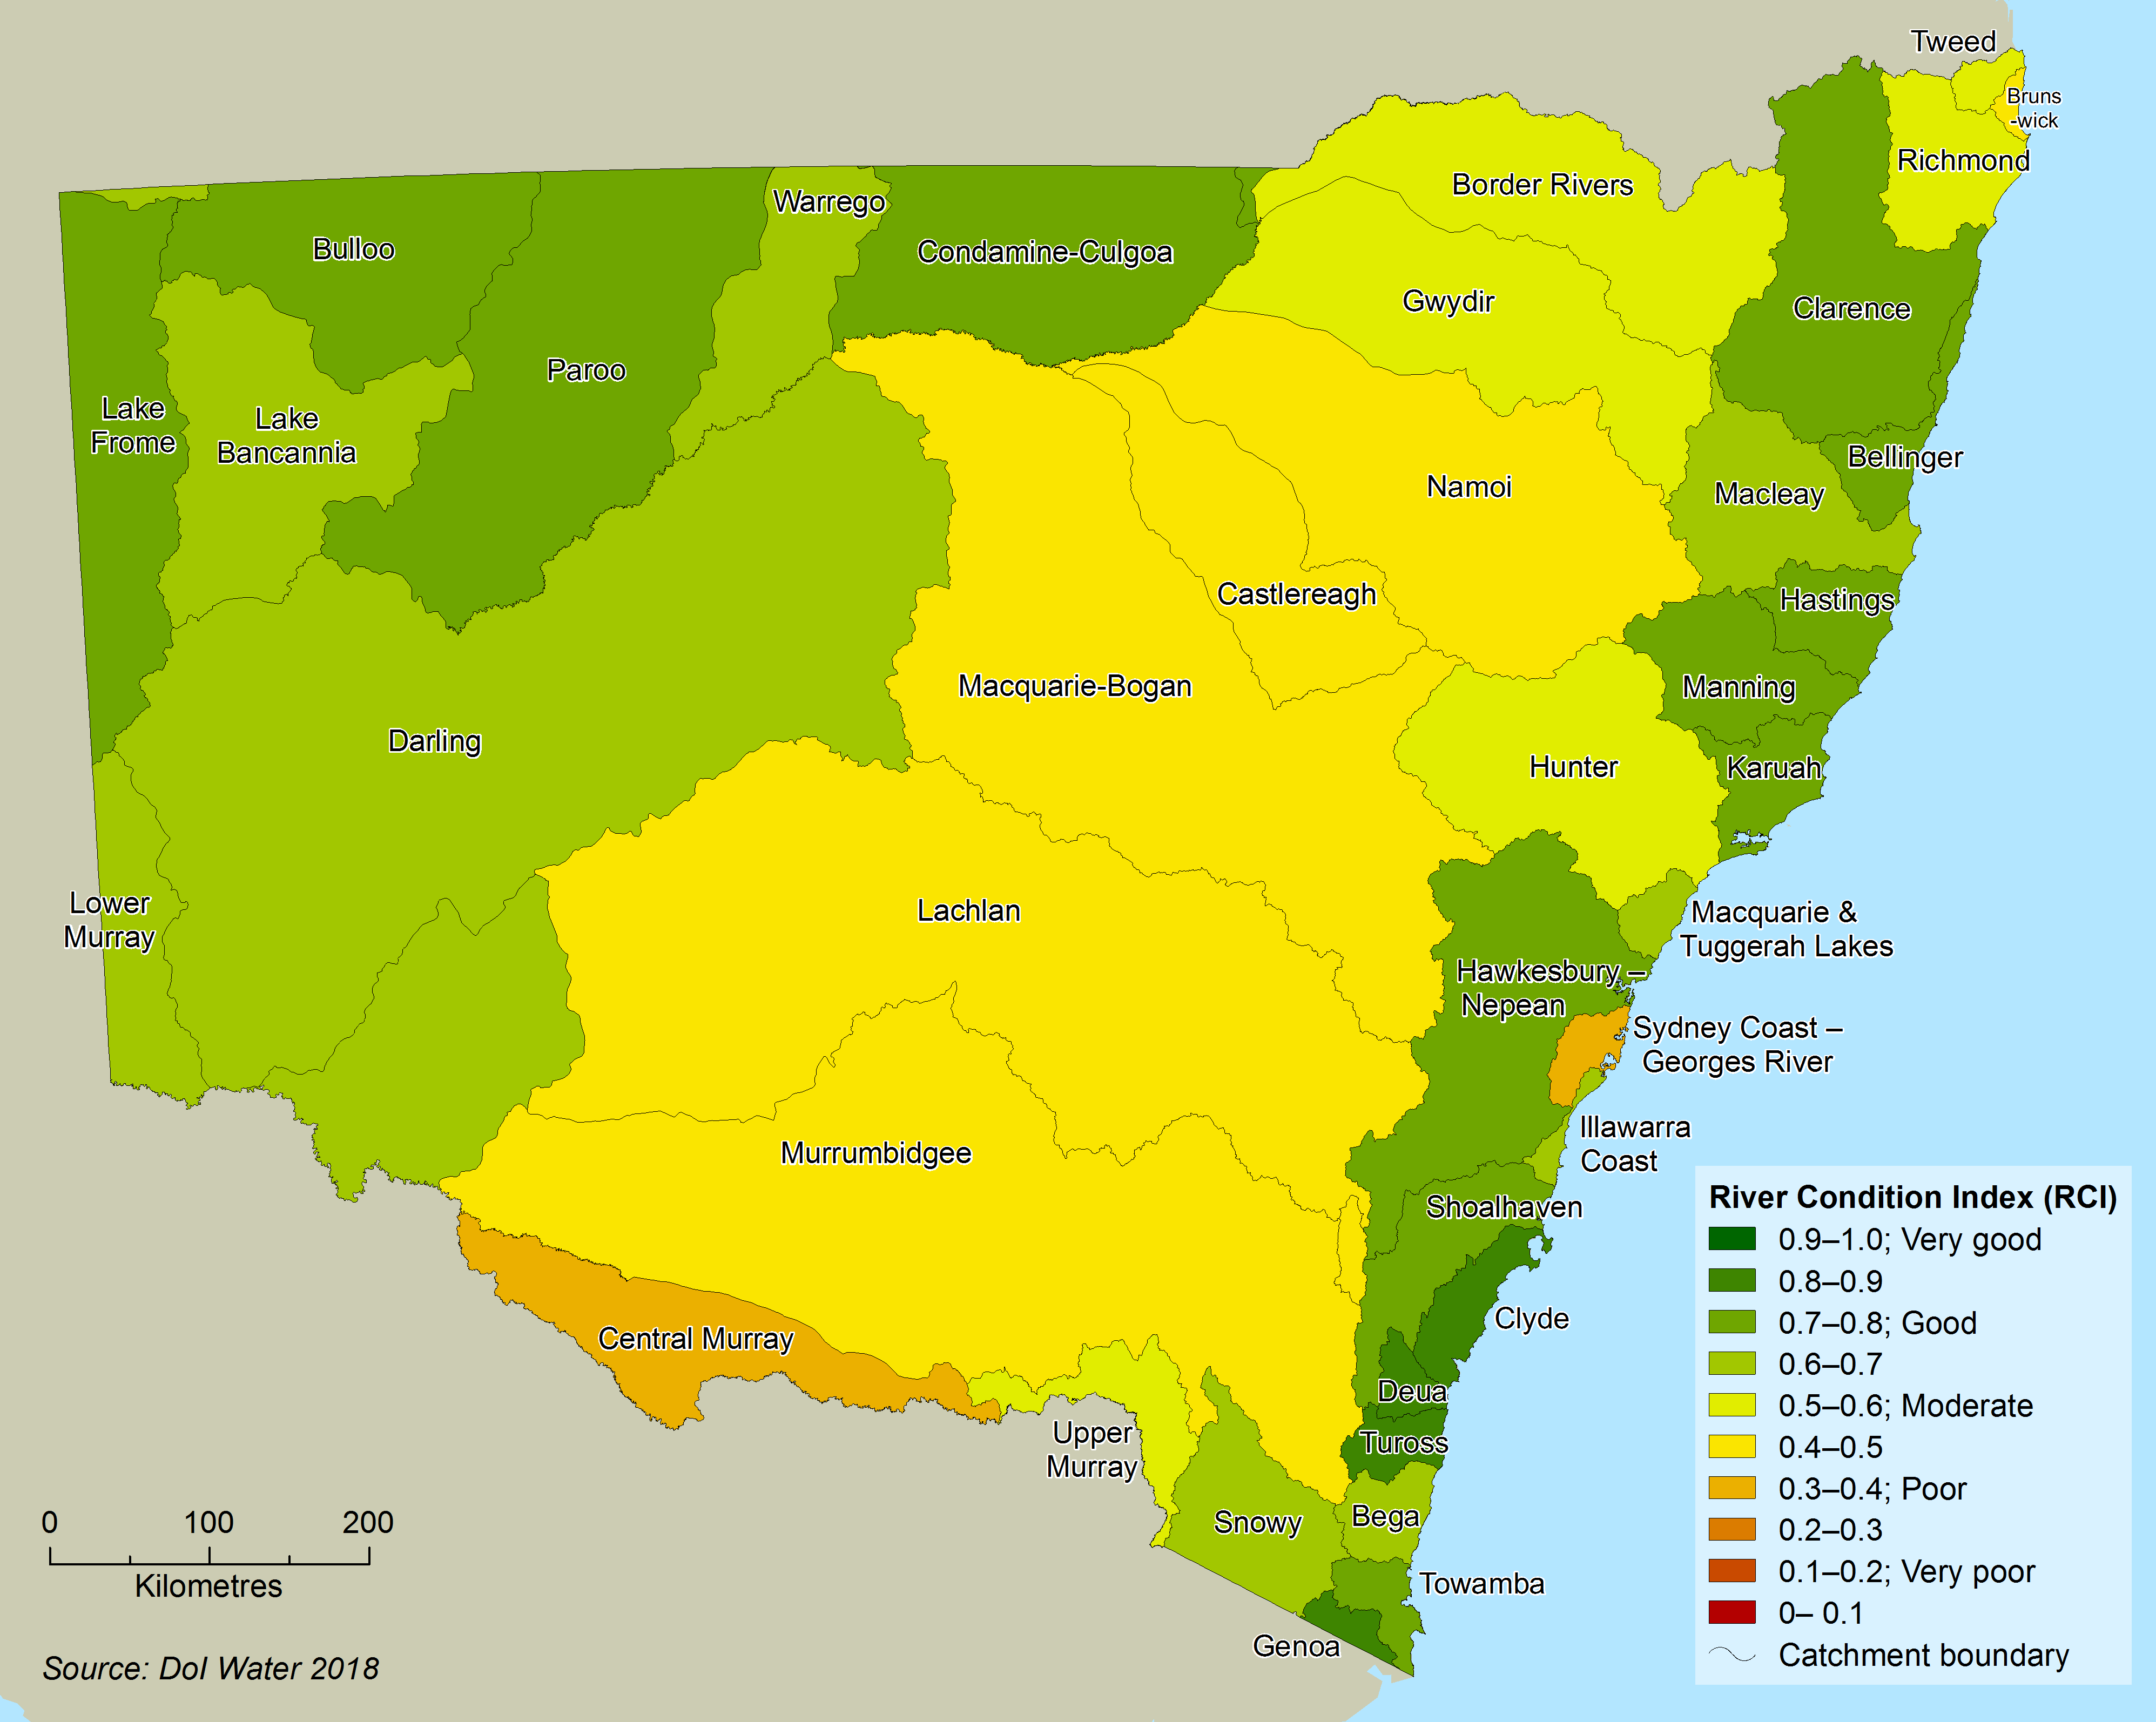
Map 17.1 shows the RCI values for NSW river catchments. Overall, the RCI rates the condition of NSW rivers health as moderate. Murray-Darling Basin rivers are generally in poorer condition than Eyre Basin or coastal NSW rivers; far south coast rivers are healthiest.
Map 17.1: RCI index value for NSW catchments
Fish
Fish community data for 2015–17 is available for significant parts of NSW, including 800 Murray-Darling Basin locations and some northern coastal rivers. This latest data is reported separately here because the RCI determination draws on earlier SRA data on fish condition and macroinvertebrates. No new data is available for macroinvertebrates (larger invertebrates such as shrimp, crayfish or snails).
Health of fish communities in the Murray-Darling Basin improved slightly in the three years since 2012-14, based on scores from a fish condition index that uses three indicator measures:
- Expectedness is the proportion of fish species collected at a site compared to the species that would be expected to occur there prior to 1788 (Muschal et al. 2010; Davies et al 2012). Scores on this indicator improved moderately across all valleys over the last three years, from an average of 33 (very poor) to 46 (poor). The main improvements were in Warrego, Paroo, Lachlan and Murrumbidgee river valleys.
- Recruitment of native fish, the number of surviving young added to the population, stayed relatively stable over the last three years; scores on this indicator increased slightly from 42 to 44, on average.
- Nativeness, the proportion of native species to introduced species, comprises the three metrics of species richness, abundance and biomass (Muschal et al. 2010; Davies et al 2012). Nativeness of fish communities increased across most valleys analysed, from 39 (very poor) to 46 (poor). This reflects moderate progress since the widespread recruitment of common carp during 2012–14.
Table 17.1 provides composite fish condition index values for each of 15 Murray-Darling Basin river valleys. In most, the overall condition of freshwater fish communities improved in the last three years. In eight valleys, it improved by one condition category, and in five valleys it remained the same. However, in two valleys (the Border Rivers and the Bogan River) it declined.
Nevertheless, the Paroo was the only river where fish condition was rated as good. Lower Murray River and Darling River fish communities were in moderate condition, but in five other rivers they were poor, in four rivers they were very poor, and three rivers extremely poor condition. Those river valleys with fish communities in extremely poor condition were (in declining order of condition) the Condamine-Culgoa, Macquarie and Castlereagh.
Despite some improvement since 2012–14, 80% of the fish communities in NSW's Murray-Darling Basin river valleys still remain in poor or worse condition.
Table 17.1: Changes in fish condition index for NSW Murray–Darling Basin rivers, 2009–11 to 2015–17
| Valley | 2009–2011 | 2012–2014 | 2015-17 |
|---|---|---|---|
| Border Rivers | Moderate | n/a | Poor |
| Condamine-Culgoa | Poor | Extremely poor | Extremely poor |
| Warrego River | Very poor | Very poor | Poor |
| Paroo River | Moderate | Moderate | Good |
| Gwydir River | Poor | Poor | Poor |
| Namoi River | Very poor | Poor | Poor |
| Castlereagh River | Very poor | Extremely poor | Extremely poor |
| Bogan River | Very poor | Poor | Very poor |
| Macquarie River | Very poor | Extremely poor | Extremely poor |
| Darling River | Poor | n/a | Moderate |
| Lachlan River | Extremely poor | Extremely poor | Very poor |
| Murrumbidgee River | Extremely poor | Extremely poor | Very poor |
| Upper Murray River | Extremely poor | n/a | Very poor |
| Central Murray River | Very poor | n/a | Poor |
| Lower Murray River | Poor | n/a | Moderate |
Three indicator measures make up the score for the overall fish condition index:
- Expectedness is the proportion of fish species collected at a site compared to the species expected to occur at that site or zone prior to 1788 (Muschal et al. 2010; Davies et al 2012). It has improved moderately across all valleys over the last three years, from an average of 33 (Very poor) to 46 (Poor). This is in part due to improvements in the Warrego, Paroo, Lachlan and Murrumbidgee valleys.
- Recruitment of native fish has been largely stable over the last three years, with a slight increase in the average from 42 to 44.
- Nativeness is the proportion of native species to introduced species for the three metrics of species richness, abundance and biomass combined (Muschal et al. 2010; Davies et al 2012). This increased across most of the analysed valleys from an average of 39 (Very poor) to 46 (Poor), which is slightly better than that observed prior to the widespread recruitment of common carp observed during the 2012–14 period.
Threatened species and endangered ecological communities
Environmental issues of concern are biodiversity decline and the number of species listed as threatened (see Threatened Species topic). Although they may lack the wider awareness the public has for many land plants and animals that are threatened, numerous aquatic species are also under threat (DPI 2016).
Species threatened with extinction can be listed under the NSW Fisheries Management Act 1994 as vulnerable, endangered or critically endangered. In the NSW portion of the Murray-Darling Basin, 10 of 29 native freshwater fish species and eight freshwater invertebrates are listed under one of these categories.
As well as species, threatened populations of a given species can also be listed under the Act. Populations of four additional species and four aquatic ecological communities are also listed as endangered. See the Threatened Species topic.
Water quality
Targets
The Murray-Darling Basin Plan 2012 (Schedule 11) sets targets for water quality that must be met to achieve the basin's environmental, social and economic outcomes. Toward these targets, monitoring identifies trends and informs actions to stem water quality decline.
Water quality at inland monitoring stations in NSW is now assessed against these Basin Plan targets. The targets replace values formerly used: default trigger values for slightly disturbed ecosystems listed in the National Water Quality Management Strategy (NWQMS; ANZECC & ARMCANZ 2000).
Nutrient data at coastal sites, however, are still assessed using the National Guidelines for Fresh and Marine Water Quality. Over the long term, regionally-specific water quality targets will be developed for all NSW rivers.
Nutrients
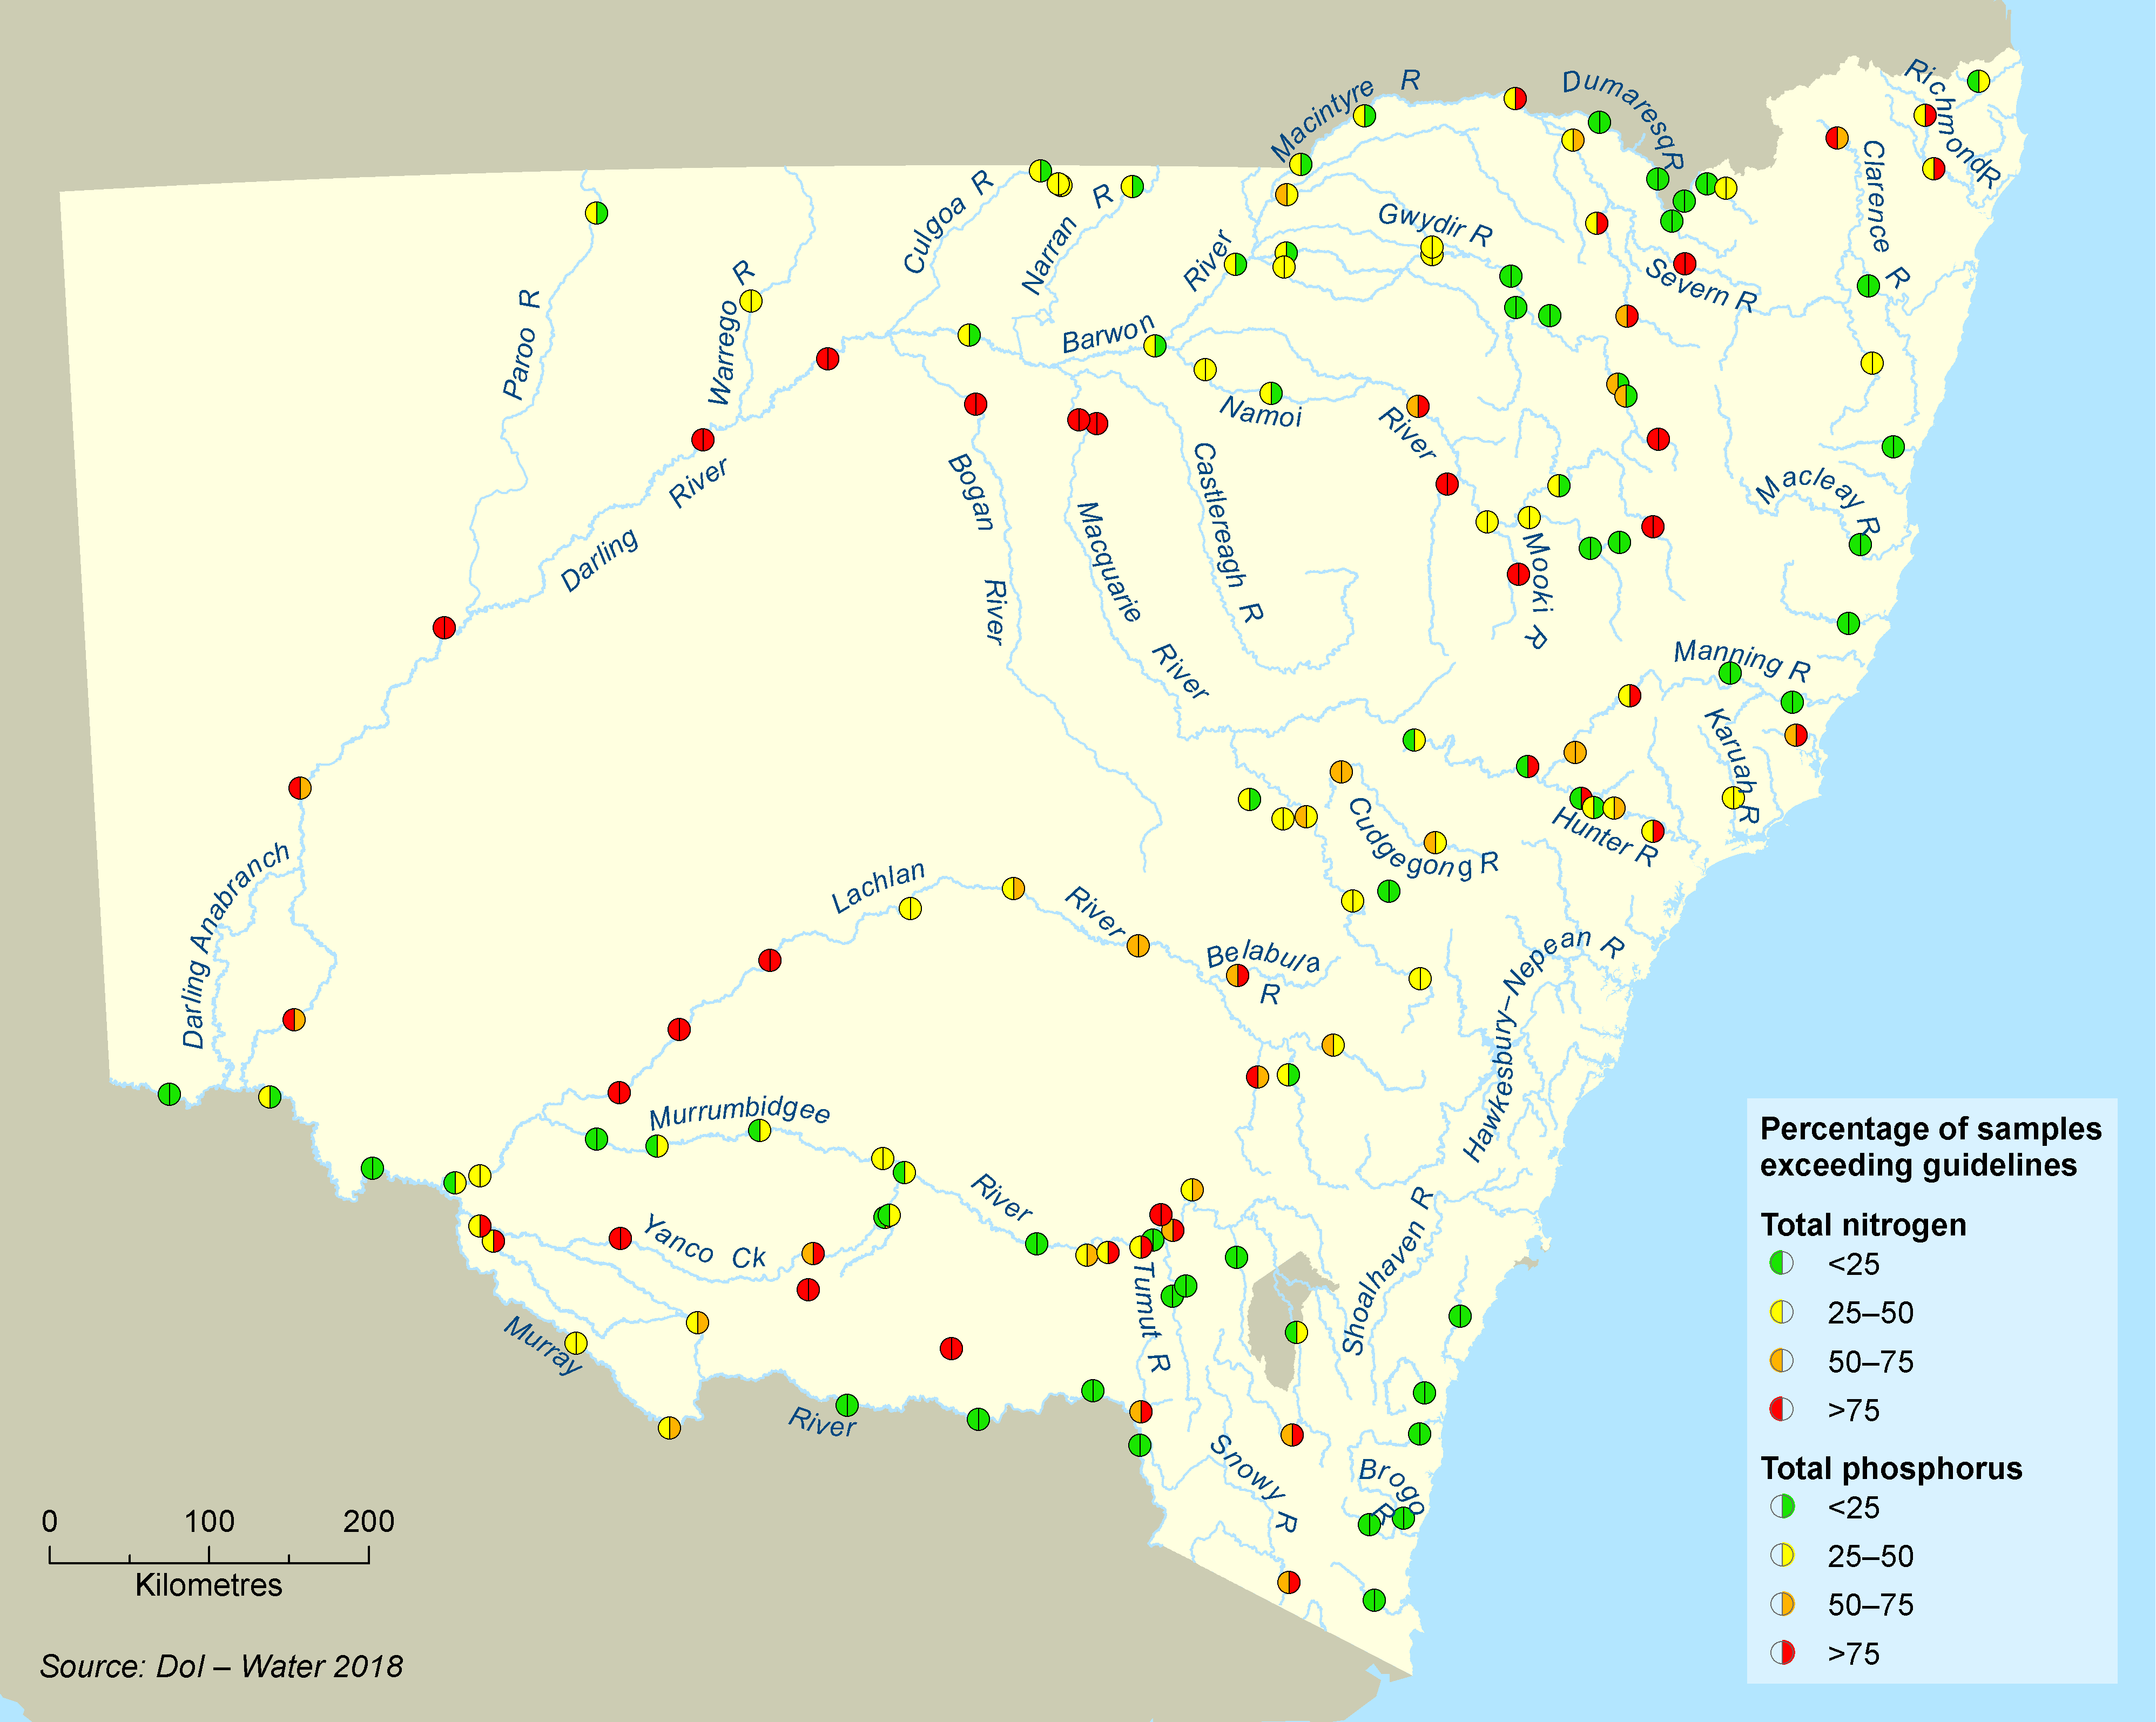
Nutrients, especially nitrogen and phosphorus, can significantly affect water quality when they exceed ecosystem needs. Map 17.2 shows the percentage of NSW stream water samples with nitrogen and phosphorus concentrations that exceed water quality targets.
Since 2012–14, water quality targets were exceeded in slightly more inland sites than coastal sites. That is, during 2015–2017, in slightly more sites 75% of samples taken exceeded the targets for total nitrogen and total phosphorus; and fewer sites had less than 25% exceedances for these two nutrients. This increase is mainly due to higher water flows during the 2015–17 period; some catchments had major flooding in 2016.
Sites in the Border Rivers, Gwydir and Namoi montane zone all rated poorly for their high total nitrogen and total phosphorus levels. This is largely due to basalt-derived soils which are naturally high in nutrients in the upper reaches of these rivers' catchments. High nutrient levels were also recorded at sites on tributaries draining the Liverpool Plains in the Namoi catchment, the Lower Lachlan River, the lower Macquarie River and Billabong Creek.
Sites in the middle and lower Darling zone also had poor water quality ratings. Due to data deficiencies, the Basin Plan applied more stringent default National Water Quality Management Strategy targets to this zone, which is a priority for developing regionally-specific water quality targets.
On the coast, water quality ratings were generally better, and no sites had greater than 75% exceedances for both total nitrogen and total phosphorus.
Elevated nutrient levels also occur in rivers with catchments affected by urbanisation or used for metropolitan urban water supply, such as parts of the Hawkesbury-Nepean and Shoalhaven river systems (for example Water NSW 2017). These are sourced in runoff from urban and agricultural land and in discharges from sewage treatment plants and can be exacerbated by reduced river flows downstream of major dams (DECCW 2010).
Map 17.2: Exceedance of water quality targets for Total Nitrogen and Total Phosphorus
Salinity
The level of salinity in NSW streams is affected by:
- geology
- climate
- the interaction between surface and groundwater
- land use practices.
High salt concentrations can degrade freshwater aquatic ecosystems. Irrigation water with high salt loads can increase soil salinity, degrade soil structure and adversely affect crop health.
Salinity in water is usually measured as electrical conductivity, the ability of dissolved salts to transmit an electric current. Water with electrical conductivity less than 1,000 microsiemens per centimetre (µS/cm) is generally considered safe for irrigation. Electrical conductivity is continuously monitored at many sites in NSW.
Table 17.2 shows average salinity levels for the three-year period 2014–17, and the preceding 10-year period, 2004–2014, at selected mid- and end-of-catchment sites in NSW.
At most measuring points, mean salinity levels are within the World Health Organization (WHO) desirable upper threshold for drinking water, 800µS/cm. Darling River at Wilcannia and Pooncarie, and the Hunter River at Greta are among NSW sites with the highest mean salinity.
Table 17.2 also gives maximum salinity levels measured at each monitoring point during the 2014–17 period. The WHO upper threshold for drinking water was exceeded for short periods at 55% of these locations.
Comparing the two periods (the three- and ten-year averages) shows salinity levels in many streams surveyed are relatively stable, with minor variations. However, salinity levels in the Hunter River at Greta, and the Barwon River at Brewarrina increased somewhat (by more than 110µS/cm); and in the Darling River at Wilcannia and Pooncarie they increased substantially.
The Barwon and Darling river salinity increases likely stem from low river flows, which allowed evaporation to concentrate salts in the area. At the Castlereagh River at Gungalman, where the site was dry for most of the 2014–17 period, the opposite effect was seen: substantially lower electrical conductivity readings.
Table 17.2: Electrical conductivity (µS/cm) in selected NSW rivers (2014–17)
| Station Number | Station Name | Daily river salinity levels (µS/cm) | ||
|---|---|---|---|---|
| Mean July 2004–June 2014 | Mean July 2014–June 2017 | Maximum July 2014– June 2017 | ||
| 416012 | Macintyre R at Holdfast Crossing | 283 | 301 | 543 |
| 416001 | Barwon R at Mungindi* | 257 | 244 | 457 |
| 418058 | Mehi R at Bronte* | 463 | 435 | 1 391 |
| 419001 | Namoi R at Gunnedah | 487 | 505 | 1 023 |
| 419026 | Namoi R at Goangra* | 405 | 404 | 862 |
| 420020 | Castlereagh R at Gungalman Bridge* | 640 | 305 | 592 |
| 421127 | Macquarie R at Baroona | 435 | 456 | 850 |
| 421012 | Macquarie R at Carinda* | 574 | 541 | 897 |
| 421023 | Bogan R at Gongolgon* | 361 | 347 | 786 |
| 412004 | Lachlan R at Forbes* | 493 | 436 | 888 |
| 412005 | Lachlan R at Booligal | 573 | 544 | 945 |
| 410001 | Murrumbidgee R at Wagga Wagga | 140 | 148 | 460 |
| 410130 | Murrumbidgee R D/S Balranald Weir* | 160 | 166 | 280 |
| 409005 | Murray R at Barham | 81 | 85 | 238 |
| 414216 | Murray R D/S Mildura Weir | 139 | 144 | 309 |
| 422002 | Barwon R at Brewarrina | 540 | 668 | 3 542 |
| 425008 | Darling R at Wilcannia* | 501 | 905 | 6 034 |
| 425005 | Darling R at Pooncarie | 515 | 1 051 | 3 040 |
| 210002 | Hunter R at Muswellbrook | 498 | 446 | 879 |
| 210064 | Hunter R at Greta | 737 | 850 | 1 629 |
Notes:
* End-of-valley salinity site
Pressures
Water extraction and altered flow regimes
Natural river flows have been modified by:
- water extraction
- dams and other structures.
Water flows in inland NSW and in coastal river systems supplying major metropolitan areas are particularly affected by dams and other structures (see Water Resources topic). Changes to natural river flows, and dampening of their peaks and troughs, affect the critical ecological processes that trigger breeding in birds and fish. These altered flow regimes in rivers are a significant cause of long-term decline in aquatic ecosystems.
River flow regimes also play an important role in creating and maintaining the physical habitat of river channels.
Blockages to fish passage
Many Australian native fish species must access suitable habitat to complete their lifecycles. The Fisheries Management Act lists 'installation and operation of instream structures and other mechanisms that alter natural flow regimes and streams' as a key threatening process. These structures:
- disrupt migration of native fish populations
- exclude these fish from large areas of vital breeding and spawning habitat
- restrict their access to food
- limit available shelter for fish, leading to increased predation
- reduce fish population's genetic variability.
A database of all known fish barriers in NSW, compiled by Fisheries NSW, identifies more than 10,000 structures, nearly 5,000 of which are barriers to fish. Among them are more than 2,000 dams, weirs and regulators, the most common type of major barrier. A further 1,800 road crossings and 480 floodgates also impede fish passage (NSW Fish Habitat Partnership 2017).
Infrastructure hazards
Each year irrigators divert a large portion of river water using canals and pumps. Many adult fish are caught in irrigation canals or pumps. If pumping occurs when fish are spawning, this also destroys their eggs and larvae. On the Namoi River some pumping stations remove more than 200 fish daily (Baumgartner et al. 2009). NSW's western-flowing rivers have more than 4,546 pumps greater than 200 millimetres (mm) in size.
In the Murray-Darling Basin, more than 80% of main channel weirs use an undershot (gated) design (Boys et al. 2014) to control water flows. Where undershot weirs are used, fluid shear stress is a common problem that can injure or kill fish. Many fish eggs and larvae die when passing through undershot weirs due to the distortion encountered. Small-scale experiments with golden perch demonstrate high susceptibility to fluid shear stress, with egg mortality rates exceeding 90% (Boys et al. 2014; Baumgartner et al. 2006).
Cold water pollution
When operators discharge water from the bottom of dams, this injects colder water into sensitive downstream ecosystems. This cold water release alters rivers' thermal regimes, sometimes for hundreds of kilometres downstream. Cold water pollution (CWP) affects a range of physiological and biological processes in native fish species, including feeding, spawning, hatching and larval development (Lugg & Copeland 2014).
Nine inland NSW dams cause relatively large and pervasive CWP:
- Blowering
- Burrendong
- Burrinjuck
- Copeton
- Hume
- Keepit
- Khancoban
- Pindari.
CWP is also a medium pressure downstream from some dams supplying major coastal metropolitan areas, including below upper Nepean catchment dams, Warragamba Dam and Tallowa Dam on the Shoalhaven River.
In some cases, discharges from dams cause downstream temperatures to drop more than 15°C below natural summer conditions (Hardwick et al. 2012).
Catchment disturbance
Runoff causing water pollution is affected by:
- the extent of vegetation cover in a river catchment
- local land use and land management practices, such as agriculture and urban development.
Runoff may increase nutrients and sediments in the river or stream. It may even modify the geomorphology of the river. Clearing riparian and land plants and draining wetlands also affect river geomorphology by:
- widening river channels
- leading to head cut incisions in headwater streams
- increasing sediment loads, smothering aquatic habitats (Brierley & Fryirs 2005).
Generally, the more intensive a development, the greater its impact on river ecosystems.
Healthy riparian vegetation is important to maintain healthy aquatic ecosystems. The structure it provides protects riverbanks from erosion and creates complex habitat and sources of food and nutrients, including for aquatic communities. Intact riverbanks are also critical because many species use overhanging banks and their vegetation for habitat.
River health is affected when riparian vegetation is disturbed. Clearing and trampling by livestock destroys or degrades riparian zone vegetation, with significant impacts.
Other forms of disturbance that influence river health include:
- bushfires
- roads
- large dams
- industrial activities such as mining.
Invasive species
Introduced pest fish can compete with native species. They prey on fish and frog eggs, tadpoles and juvenile fish, and fundamentally alter food webs and habitats. Freshwater fish surveys over the past three years found:
- only 13% of all sites sampled were free from introduced fish, mainly in coastal rivers
- 4% of sites contained only introduced fish
- introduced fish taxa accounted for 36% of fish species collected at each site, 37% of total fish abundance, and 58% of total fish biomass, averaged across all sites.
Allowing for the greater proportion of sampling in the Murray-Darling Basin during the latest surveys, these numbers show an improvement compared to results reported in SoE 2015.
No new introduced fish species became established in NSW's freshwater aquatic habitats during the period 2014–2017. See the Invasive Species topic.
Drought
The Australian landscape is adapted to natural drought conditions; many species have lifecycles that rely on natural variability in river flows. Prolonged drought, however, causes major disturbance to river systems and can severely stress aquatic ecosystems.
Where the combined effects of drought conditions and water extraction build up over extended periods, they may exceed critical thresholds for life cycles of species. This stress threatens the recovery of at-risk fish populations. Where long-term changes to river conditions have reduced native fish populations, they are less resilient to further change, such as those imposed by the decade-long Millennium Drought of the 2000s.
Climate change
Climate change is likely to gradually add to existing stressors, particularly water availability pressures and the impacts of altered river flows.
Climate change will affect environmentally beneficial flooding that occurs in most Murray-Darling Basin regions (especially highly-developed regions). However, these climate change effects will be smaller than existing impacts from water resource development, according to the CSIRO Sustainable Yields Assessment (CSIRO 2008a).
Nevertheless, when climate change impacts are superimposed on existing water availability pressures, important ecological thresholds may be crossed. The ecological consequences may be substantial (CSIRO 2008a). By 2030, under a median climate change scenario, expected impacts include:
- extended dry periods between important flood events and reduced flood volumes for Murray icon sites identified in The Living Murray program (CSIRO 2008a)
- a 10% increase in the interval between beneficial flood events in the Macquarie River (CSIRO 2008b)
- a 24% increase in the interval between floods in the Lachlan River (CSIRO 2008c).
Responses
Legislation and policy
NSW Diffuse Source Water Pollution Strategy
Pollution from diffuse sources accounts for most pollution in NSW waterways. The NSW Diffuse Source Water Pollution Strategy (DECC 2009) aims to reduce this pollution in all NSW surface and groundwater, by focusing on sources not currently regulated. It addresses three main pollutants: sediments, nutrients and pathogens. These pollutants come from many sources, including agriculture, sealed and unsealed roads, and urban stormwater.
There is an action in the Marine Estate Management Strategy (MEMA 2018) to clarify NSW Government and local government roles and responsibilities for diffuse source water pollution.
Fish habitat policy and guidelines
Policy and guidelines updated in 2013 aim to maintain and enhance fish habitat in NSW to benefit native fish (including threatened species) in marine, estuarine and freshwater environments (DPI 2013).
Programs
Floodplain management plans (Water Management Act 2000)
Floodplain management plans, prepared under the Water Management Act 2000, will help implement the NSW Healthy Floodplains Project. These plans provide a whole-of-valley framework to assess and determine flood work applications.
The Department of Industry Water, in partnership with the Office of Environment and Heritage, is preparing six floodplain management plans for:
- the Gwydir
- Barwon-Darling
- Upper Namoi
- Lower Namoi
- Border Rivers
- Macquarie valley.
These whole-of-valley plans will supersede 20 localised floodplain management plans already in force for areas of these six floodplains. The plans to be superseded were prepared under the Water Act 1912 and the Water Management Act 2000.
As statutory plans, the new whole-of-valley plans must address risks to life and property from flooding. Some features of floodplains with ecological and cultural significance depend on flooding; the plans must also provide connectivity to and from these flood-dependent assets.
Water sharing plans
Water sharing plans are important tools to address river health in NSW. They provide for better management of river flows and water extraction practices and protect a proportion of all flows for the environment. Water sharing plans developed for all NSW water sources were in place by the end of 2018. The plans are reviewed every 10 years, at which time they are either remade or renewed.
Under the Murray-Darling Basin Plan, water sharing plans in the basin will underpin 20 water resource plans (WRPs) to be developed by 2019. See Water Resources topic.
Water resource plans
The NSW Government will develop water resource plans as part of implementing the Murray-Darling Basin Plan. The Basin Plan provides a framework to integrate the basin's water resource management over the long term. Water resource plans will align basin-wide and state-based water resource management. They will recognise and build on existing water planning processes.
Each water resource plan will have:
- the relevant state water sharing plan
- a long-term environmental water plan
- a risk assessment
- a water quality management plan
- an incident response guide to deal with periods of drought and poor water quality.
See Water Resources topic.
Water quality management plans
Under the Murray-Darling Basin Plan, water quality management plans must be developed for all basin areas with water resource plans.
Each water quality management plan will:
- establish water quality objectives and targets for freshwater-dependent ecosystems, irrigation water, and recreational uses
- identify key causes of water quality degradation
- assess risks from water quality degradation
- identify measures that help achieve water quality objectives.
Environmental water holdings
In NSW, water has been purchased or recovered for the environment through a number of water recovery programs funded by the Commonwealth and NSW governments. The cumulative total for all this licensed environmental water for regulated rivers in NSW is about 2,412,000 megalitres (ML), and about 70,000ML in unregulated rivers (see Water Resources topic).
NSW and Australian government agencies work together to release and manage environmental water holdings. They manage environmental water through two types of plans:
- Annual environmental watering plans outline priorities for environmental water use in the coming year, considering climatic factors and water availability.
- Environmental water management plans are strategic plans for wetlands. They link environmental water management with activities of other government agencies. These plans identify environmental assets and values, assess water-use priorities, and outline the water and land management issues that must be addressed to support environmental values.
Environmental flows are also provided by releases from dams on coastal river systems that provide urban water supply for major metropolitan areas. The NSW Government has committed to new variable environmental flows from Warragamba Dam by 2024 that will reintroduce more natural downstream flow conditions and improved water quality (Metropolitan Water 2017).
Fishways
Fishways and remediation work in NSW have re-opened thousands of kilometres of river habitat to fish. Remediation includes replacing low-level road crossings and causeways with larger fish-friendly box culverts. These culverts allow fish to pass, but also improve access for landholders during floods. Recent works include fishways completed at Kyogle and South Dubbo Weir.
The WaterNSW 2017 Fishways Strategy for 46 priority fishway sites is part of a broader strategy to address the state's 90 highest-priority barriers to fish passage (WaterNSW 2018). With funding and implementation, the strategy could open up about 8,200 km of rivers and streams to migrating fish.
Future opportunities
Continued monitoring will shed light on how habitats and ecosystems respond to environmental flows. This information will refine knowledge and guide adaptive management, to better target high-value ecosystems and enhance the benefits of these environmental flows.
Point sources of water pollution are generally well managed. However, scope exists to better manage diffuse-source pollution, mainly from agricultural runoff and urban stormwater. Stormwater harvesting developments, runoff controls, and initiatives to promote revegetation and better land management practices in catchments are being implemented to improve water quality. This includes initiatives being funded under the NSW Government’s $112 million Catchment Action NSW initiative (LLS 2017).
References
References for River Health
ANZG 2018, Australian and New Zealand Guidelines for Fresh and Marine Water Quality, Australian and New Zealand Governments and Australian state and territory governments, Canberra [waterquality.gov.au/anz-guidelines/about]
Baumgartner LJ, Reynoldson N & Gilligan, DM 2006, 'Mortality of larval Murray cod (Maccullochella peelii peelii) and golden perch (Macquaria ambigua) associated with fish passage through two types of low-head weirs', Marine and Freshwater Research, 57(2), pp. 187–91 [dx.doi.org/10.1071/MF05098]
Baumgartner LJ, Reynoldson NK, Cameron L & Stanger JG 2009, 'Effects of irrigation pumps on riverine fish', Fisheries Management and Ecology, 16(6), pp. 429–37 [dx.doi.org/10.1111/j.1365-2400.2009.00693.x]
Boys C, Navarro A, Robinson W, Fowler A, Chilcott S, Miller B, Pflugrath B, Baumgartner L, McPherson J, Brown R & Deng, Z 2014, Downstream Fish Passage Criteria for Hydropower and Irrigation Infrastructure in the Murray-Darling Basin, Final Report Series No. 141, Department of Primary Industries, Nelson Bay [www.dpi.nsw.gov.au/__data/assets/pdf_file/0009/545751/FFRS-141_Boys-et-al-2014.pdf (PDF 4.9MB)]
Brierley GJ & Fryirs KA 2005, Geomorphology and River Management: Applications of the River Styles Framework, Blackwell Publications, Oxford, UK [au.wiley.com/WileyCDA/WileyTitle/productCd-1405115165.html]
CSIRO 2008, Water Availability in the Murray-Darling Basin: A report to the Australian Government from the CSIRO Murray-Darling Basin Sustainable Yields Project, Commonwealth Scientific and Industrial Research Organisation, Canberra [publications.csiro.au/rpr/pub?list=SEA&pid=legacy:530]
Davies PE, Stewardson MJ, Hillman TJ, Roberts JR & Thoms, MC 2012, Sustainable Rivers Audit: A report on the ecological health of rivers in the Murray-Darling Basin 2008–2010, Report 2, Vols 1–3, Murray-Darling Basin Authority, Canberra [https://www.mdba.gov.au/publications/mdba-reports/sustainable-rivers-audit-2]
DECC 2009, NSW Diffuse Source Water Pollution Strategy, Department of Environment and Climate Change, Sydney [www.environment.nsw.gov.au/water/dswp.htm]
DECCW 2009, NSW State of the Environment Report 2009, Department of Environment, Climate Change and Water, Sydney [www.epa.nsw.gov.au/soe/soe2009]
DECCW 2010, Lower Hawkesbury-Nepean River Nutrient Management Strategy, Department of Environment, Climate Change and Water, Sydney [www.environment.nsw.gov.au/resources/water/10225hnnms.pdf (PDF 0.6MB)]
DPI 2013, Policy and Guidelines for Fish Habitat Conservation and Management, Department of Primary Industries, Wollongbar [https://www.dpi.nsw.gov.au/fishing/habitat/publications/pubs/fish-habitat-conservation]
DPI 2016, Fish communities and threatened species distributions of NSW, Department of Industry, Skills and Regional Development, Wollongbar [ http://www.dpi.nsw.gov.au/__data/assets/pdf_file/0007/669589/fish-communities-and-threatened-species-distributions-of-nsw.pdf (PDF 4.8MB)]
EPA 2012, NSW State of the Environment 2012, Environment Protection Authority, Sydney [www.epa.nsw.gov.au/soe/soe2012]
Hardwick L, Raine A, Lugg A & Hill CM 2012, Managing cold water pollution in NSW, Conference paper, 6th Australian Stream Management Conference, Canberra [https://www.researchgate.net/publication/281255549_Managing_Cold_Water_Pollution_in_NSW_Managing_Cold_Water_Pollution_in_NSW]
Healey M, Raine A, Parsons L & Cook N 2012, River Condition Index in New South Wales: Method Development and Application, NSW Office of Water, Sydney [https://www.industry.nsw.gov.au/water/science/surface-water/monitoring/river-health/river-condition-index]
LLS 2017, Catchment Action NSW Annual Report 2016–17, Local Land Services, State Operations Major Programs Unit, Sydney [riverina.lls.nsw.gov.au/__data/assets/pdf_file/0011/741188/ca-nsw-201617-annual-report.pdf (PDF 3.2MB)]
Lugg A & Copeland C 2014, 'Review of Cold Water Pollution in the Murray-Darling Basin and the impacts on fish communities', Ecological Management & Restoration, 15, pp. 71–9 [dx.doi.org/10.1111/emr.12074]
MEMA 2018, NSW Marine Estate Management Strategy 2018–2028, Marine Estate Management Authority, NSW Department of Industry, Sydney [www.marine.nsw.gov.au/__data/assets/pdf_file/0007/815596/Marine-Estate-Management-Strategy-2018-2028.pdf (PDF 12.3MB)]
Metropolitan Water 2017, 2017 Metropolitan Water Plan: Water for a Liveable, Growing and Resilient Greater Sydney, NSW Department of Industry, Skills and Regional Development, Sydney [www.planning.nsw.gov.au/About-Us/Sydney-Metropolitan-Water]
Muschal M, Turak E, Miller J, Gilligan D, Sayers J & Healey M 2010, Riverine Ecosystems, Technical report series of the NSW Monitoring, Evaluation and Reporting Program, NSW Office of Water, Sydney [www.water.nsw.gov.au/__data/assets/pdf_file/0009/548442/monitor_catchments_10_228_mer_riverine_ecosystems.pdf (PDF 1.8MB)]
NLWRA 2002, Australian Catchment, River and Estuary Assessment 2002: Volume 1, National Land and Water Resources Audit, Canberra [lwa.gov.au/products/pr020282]
NSW Fish Habitat Partnership 2017, Building a Fish Friendly NSW: NSW Fish Habitat Strategy, NSW Fish Habitat Partnership, Nelson Bay [fishhabitat.org.au/wp-content/uploads/2017/06/NSWFishHabitatPartnership_SINGLES-1.pdf (PDF 1.6MB)]
WaterNSW 2017, Annual Water Quality Monitoring Report Sydney Catchment Area 2016–17, WaterNSW, Sydney
WaterNSW 2018, 20 Year Infrastructure Options Study Rural Valleys: Summary Report, WaterNSW, Sydney [www.waternsw.com.au/__data/assets/pdf_file/0019/132616/20-Year-Infrastructure-Options-Study-June-2018.pdf (PDF 13.4MB)]