Summary
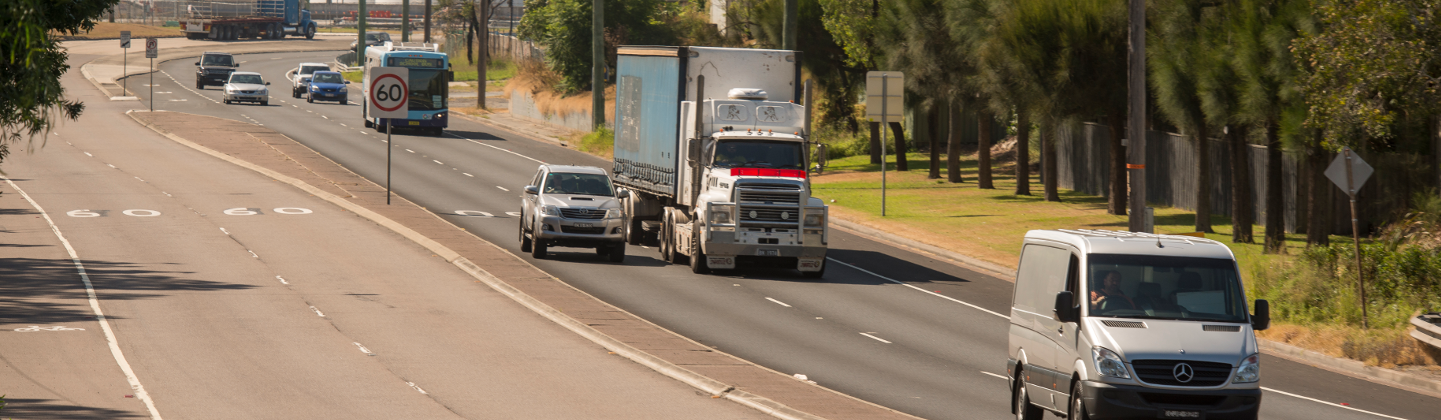
The demand for transport has increased as the population grows. Total vehicle kilometres travelled has increased but levels per person have dropped. The transport sector (road, rail, ship and air) is one of the major contributors to greenhouse gas emissions and air pollution in NSW.
The total distance travelled by motor vehicles in NSW increased by 12.6% between 2007 and 2016. But the average distance travelled reduced by 7.6% from 14,400 to 13,300km per vehicle per year.
In 2016–17, around 4.9 million Sydney residents made 18.7 million trips by all modes of transport on an average weekday – around 3.8 trips per person.
Private motor vehicles remain the dominant mode of transport in NSW, accounting for 69% of all trips by Sydney residents and over 80% of trips by Hunter and Illawarra residents.
Public transport patronage has increased from about 526 million trips in 2010–11 to over 727 million trips in 2016–17. Household travel survey results for Sydney residents also show that public transport trips for an average weekday have increased about 21% between 2007–08 and 2016–17. Public transport represents about 12% of weekday trips.
In 2015–16 transport was responsible for 20.8% of greenhouse gas emissions in NSW, an increase of 12% since 2005. Petrol and diesel-fuelled vehicles are the main sources of oxides of nitrogen (NOx) emissions in Sydney.
Other potential environmental impacts include noise pollution and fragmentation of ecosystems.
A range of transport infrastructure and service initiatives being delivered under Future Transport 2056 aims to encourage travel by public and active transport (such as walking and cycling), rather than by private car, which will help reduce traffic congestion and greenhouse gas emissions.
Air quality and emissions are being addressed through new vehicle standards and vapour recovery programs.
Related topics: Climate Change | Energy Consumption | Greenhouse Gas Emissions | Population
NSW Indicators
| Indicator and status | Environmental trend |
Information reliability |
|
|---|---|---|---|
| Vehicle kilometres travelled (total) |
|
Stable | ✔✔✔ |
| Vehicle kilometres travelled (per person) |
|
Stable | ✔✔✔ |
| Public transport use overall trips |
|
Getting better |
✔✔✔ |
Notes:
Terms and symbols used above are defined in How to use the report.
Context
Transport plays a key role in allowing people and goods to get from one place to another. However, vehicles, roads, freight and infrastructure can have environmental impacts. These include:
- reliance on non-renewable resources for fuel
- greenhouse gas emissions
- noise and air pollution
- land clearing and habitat loss due to construction of roads and infrastructure.
Reducing congestion and improving access between homes, work and service centres are important challenges for all metropolitan and regional centres. These challenges are especially impacted by making public transport and active transport more attractive options.
Generally, private modes of transport such as cars have greater impacts on the environment than public transport such as trains, buses, ferries and light rail. This is because they are less efficient at moving large numbers of people and predominantly rely on polluting energy sources. Improving and delivering better public transport will lead to increased use and lower environmental impacts. Use of private vehicles tends to increase with expansion in road infrastructure.
Freight transport by rail has a lower environmental impact than moving freight by road because it is more efficient at moving larger volumes of goods, but goods lines can have noise impacts. Noise can be reduced by improvements to the condition of rolling stock and the track.
Status and Trends
Distance travelled by motor vehicles in NSW
While the total distance travelled by motor vehicles in NSW increased by 12.6% from 62,732 million kilometres a year in 2007 to 70,696 million in 2016, the average distance travelled per vehicle per year decreased by 7.6% from 14,400 kilometres in 2007 to 13,300 kilometres in 2016 (ABS 2008, ABS 2017).
Personal travel
In-depth personal transport data is collected for the Sydney Region (as defined by the ABS Greater Capital City Statistical Area (GCCSA)), and for the Hunter and Illawarra regions, through the annual Household Travel Survey. The Survey is the most comprehensive source of personal travel data in these regions. The Survey’s statistics inform long-term planning to reduce impacts on the environment, improve amenity and meet the State’s transport needs. The most recent information is presented here.
Overall, the data indicates that demand for transport has increased over the past decade due to population growth. Use of public transport has increased in Sydney but remains a small proportion of transport use. Public transport as a proportion of all modes has continued to be consistent over the past decade. Private motor vehicles continue to dominate personal transport, but in Sydney vehicle kilometres travelled per person has declined.
Total trips
Between 2007–08 and 2016–17 on an average weekday, the number of trips in Sydney, Hunter and Illawarra regions by all modes of transport increased by 9%, from just over 20 million to around 22 million trips. This is lower than the rate of population growth over the same period (15%).
Sydney
In 2016–17 on an average weekday, Sydney residents took approximately 18.7 million trips by all modes of transport. This is an increase of 10% over 2007–08 figures. Total vehicle kilometres travelled (VKT) has also increased in the Sydney Region by approximately 10% from 2007–08 to 2016–17.
Other trends in trip numbers by all modes in Sydney since 2007–08 (TfNSW 2018c):
- the number of daily trips per person fell by 4.8% from 4.03 to 3.84
- average weekday trip distance rose 2% from 7.76km to 7.88km
- the number of trips for personal business decreased by 24%
- work-related business trips decreased by 5%
- commuter trips increased by 15%
- shopping trips grew by 11%.
More detail about the purpose of these trips is shown in Figure 4.1
Figure 4.1: The proportion of travel for various purposes in 2016–17 (Sydney)
Notes:
‘Change mode of travel’ refers to travel to reach another mode of travel, for example walking to a bus stop or driving to park on a side street before walking to a station. The next stage of travel is categorised by another relevant purpose such as ‘commute’.
Hunter and the Illawarra
Trends for the Hunter region between 2007–08 and 2016–17 include:
- remained stable at approximately 2 million trips on an average weekday
- trips per person fell by 15% from 3.9 to 3.3
- work-related business trips decreased by 38%
- population rose by 18%.
Trends for the Illawarra region during this period include:
- 1.66 million trips on an average weekday, up 6% from 1.57 million
- trips per person fell by 5% from 3.9 to 3.7
- shopping trips increased by 17%
- personal business trips decreased by 7%
- population rose by 10%.
The impact of technology on travel patterns
The decline of per person trips coincides with the rise in smart phone and information technologies. Social changes associated with these technologies, such as online shopping and working from home may be a factor in the reduction of work-related and personal business trips, but do not account for the increase in shopping trips.
The most recent data available (ABS 2018), shows that across Australia in 2016–17:
- 7% of internet users in NSW engaged in online shopping
- 46% of employed persons used the internet at home for work-related purposes.
The provision of online information on public transport services is assisting journey planning and decision making by travellers. This includes websites, contact centres, apps, social media and date feeds to third party providers. In 2016–17, 90 million trip plans were provided to public transport users through such channels (TfNSW 2017a).
Modes of transport
While public transport has numerous social, economic and environmental benefits, the Household Travel Survey indicates that private vehicles such as cars and motorbikes are the dominant mode of transport for residents in the surveyed areas (Figures 4.2, 4.4 and 4.5). The proportion of trips by different modes of transport has changed minimally over the past 10 years.
Figure 4.2: Proportion of trips by mode for Sydney Residents in 2016–17 compared to 2007–08
Notes:
* ‘Vehicle’ includes cars, motorbikes and scooters for trips by drivers and passengers
** Public Transport includes bus, train, ferry and light rail
*** ‘Other’ includes, bicycles, taxis, aircraft and wheelchairs
Sydney
In 2016–17 on an average weekday in Sydney (TfNSW 2018c):
- 69% of trips were by private vehicles
- 6% were by bus
- 6% were by train
- less than 1% were by ferries and light rail
- less than 2% were by other (mainly taxis and bicycles)
- 17% were by walking.
While the proportion of trips for each mode of transport has remained constant, total trips over the 10-year period show:
- a 25% increase in train trips
- a 19% increase in bus trips
- a 10% increase in trips by private vehicles.
Trips by private vehicles are increasing at a faster rate than reported in the 2015 State of the Environment Report (5%).
Figure 4.3 shows trips on the Opal public transport network in from 2010–11 to 2016–17. Over 727 million journeys were made 2016–17. This data may not be directly comparable to the results from the Household Travel Survey.
The Opal ticketing system was progressively rolled out across the transport network from December 2012, starting with ferries. Trains followed from June 2013, buses from September 2013 and light rail from December 2014. From August 2016 Opal was the only form of ticketed travel.
Figure 4.3: Public transport patronage by mode over the Opal public transport network 2010 – 2017
Notes:
Official estimates for journeys includes Magnetic Stripe Ticketing (pre-Opal), Opal and tickets sold on board vehicles, along with estimates to account for unticketed travel.
Historical patronage data contains changes to the methodology of calculating trips resulting in figures that may not be directly comparable across years.
Hunter and Illawarra
In both regions, the Household Travel Survey shows that over 80% of trips were by private vehicle and less than 5% of trips were by public transport (Figures 4.4 and 4.5). Walking was a more common mode of travel than public transport in both regions.
Over the past decade, the number of trips on an average weekday by private vehicles has increased, while walking and bus trips have reduced. Although train trips reduced in the Hunter, there was an increase in train trips in the Illawarra.
Figure 4.4: Proportion of trips by mode for Hunter residents in 2016–17 compared to 2007–08
Notes:
* ‘Vehicle’ includes cars, motorbikes and scooters for trips by drivers and passengers
** Public Transport includes, bus, train, ferry and light rail
*** ‘Other’ includes, bicycles, taxis, aircraft and wheelchairs
Figure 4.5: Proportion of trips by mode for Illawarra residents in 2016–17 compared to 2007–08
Notes:
* ‘Vehicle’ includes cars, motorbikes and scooters for trips by drivers and passengers
** Public Transport includes, bus, train, ferry and light rail
*** ‘Other’ includes, bicycles, taxis, aircraft and wheelchairs
Walking and cycling
Between 2007–08 and 2016–17 across all Household Travel Survey regions, walking as a proportion of weekday trips was static or declined.
In Sydney, walking as a proportion of all trips has remained the same, at 17%. While the number of trips by walking rose by 8% over the past decade, this increase is much slower than population growth (15%). In other regions, the number of trips by walking declined by 21% in the Illawarra and by 31% in the Hunter. There has been a 10% increase in resident population in the Illawarra and an 18% increase in the Hunter.
Less than 2% of trips in Sydney are by ‘other’ forms of transport, which includes bicycles and taxis. Local detail on bicycle use from bicycle counters on specific infrastructure is collected by NSW Roads and Maritime Services (RMS) and the City of Sydney.
Motor vehicle ownership
Vehicle ownership and decisions regarding use of vehicles are influenced by a variety of factors including reason for journey, income, fuel prices and environmental consciousness. If there are no convenient alternative transport options available, owning and using a private vehicle is viewed by many people as a necessity, not a choice.
There are several sources of data for vehicle ownership (ABS 2017, RMS 2018a, RMS 2018c). While this data varies, overall it shows an increase in passenger vehicle ownership, which is comparable to population growth.
Between 2012 and 2017 the Australian Bureau of Statistics Motor Vehicle Census data (ABS 2017) recorded a 13% increase in vehicle registrations in NSW. During this period, there was an 11% increase in passenger vehicle registrations and a 26% increase in motorbike registrations.
RMS vehicle registrations reflect a similar trend over a longer period, with a 29% increase in registrations for all types of vehicle between 2007–08 and 2016–17 (RMS 2018c). This is higher than the increase in gross state product (27%) and the rate of population growth (15%).
RMS data shows that registrations for passenger vehicles and people movers rose 2% and 5% respectively during this period, and registrations for off-road vehicles rose by 110% (this would include vehicles used for commercial purposes as well as those for private use). Off-road vehicles have higher rates of fuel consumption than cars, which would contribute to increasing greenhouse gas emissions. As of 30 June 2017, 31% of off-road vehicles were powered by diesel engines (RMS 2018a), which have been subject to progressive tightening of emissions standards (see the Air Quality topic). During the same period, there was a 44% increase in motorcycle registrations and a 53% increase in scooters.
Between 2007–08 and 2016–17 the Household Travel Survey indicates that across the Sydney region, vehicle ownership rose by 17%. This is a self-reported rate of ownership for private vehicles and does not distinguish between types of vehicle. The number of vehicles per household remained stable at 1.8. Over this period, average weekday trip distance by vehicle drivers reduced from 10km to 9km.
Household Travel Survey data for the Hunter and Illawarra regions shows a slightly higher number of vehicles per household (1.97 and 1.98 respectively) and slightly lower rates of increase in vehicle ownership than Sydney (14% and 10% respectively). Over this period, average weekday trip distance by vehicle drivers remained constant in both these regions (at 11km in the Hunter and 12km in the Illawarra).
Freight
Road is the main mode of transport for most commodities except for coal, which is usually transported by rail. Impacts of this can include increased congestion on roads, noise and emissions.
In 2016, the volume of freight moved on the NSW transport network was estimated at approximately 482 million tonnes, up from 409 million tonnes in 2011 (TfNSW 2018b; TfNSW 2018d).
Between 2016 and 2036, freight volume is expected to increase by 48% in the Greater Sydney Area and 12% in regional NSW (TfNSW 2018b). Population growth in greater Sydney will generate increased movements of construction materials, consumer commodities and waste.
Pressures
Population
The NSW population is expected to grow to 9.9 million people by 2036. Continued growth brings:
- an increase in passenger demand for public transport
- an increase in the number of private vehicles
- more traffic on the roads and increasing congestion
- more goods moving around the State.
The consequences of these changes, if not well managed, include:
- more noise and air pollution
- increased production of greenhouse gases
- increased pressure on non-renewable resources due to the demand for fossil fuel
- runoff from roads, which affects water quality.
Construction of new roads may induce increased road traffic through the promise of shorter travel times, and road tunnels may increase the intensity of air pollutants in localised areas. Construction of roads and transport infrastructure can also contribute to the fragmentation of ecosystems, with adverse effects on wildlife and vegetation. Road kills in newly developed areas on the urban fringe can have a particularly heavy toll on wildlife.
Air pollution
In NSW the transport sector is the fastest growing producer of greenhouse gas emissions. In 2016 the sector accounted for 20.8% of emissions, having grown steadily since 2005, an increase of 12% (DEE 2018). The sector is the second largest greenhouse gas producer in the state, behind electricity generation (see the Greenhouse Gas Emissions topic). In the Greater Sydney Region, transport emissions continue to be the main source of oxides of nitrogen (NOx) and volatile organic carbon entering the atmosphere (see the Air Quality topic).
Price signals
How often and when cars are used as an alternative to public transport can be affected by various signals, including:
- road toll pricing
- fluctuations in the price of fuel
- public transport costs and ticketing integration.
Responses
Legislation and policies
Legislation
The Transport Administration Act 1988, includes an objective to promote the delivery of services in an environmentally sustainable manner.
The Act also requires public transport agencies to comply with the principles of ecologically sustainable development as defined in section 6 (2) of the Protection of the Environment Administration Act 1991.
Strategies
The NSW Government’s priorities for transport, infrastructure investment and land use planning are set out in several linked strategies and plans:
- Future Transport Strategy 2056 and two supporting infrastructure and services plans for Regional NSW and Greater Sydney
- NSW State Infrastructure Strategy 2018–2038
- NSW Freight and Ports Plan 2018–2023.
The following tools have also been developed to include environmental sustainability in the planning, design, construction, operation and maintenance of transport projects:
- NSW Sustainable Design Guidelines (v.4) for Transport for NSW staff, contractors and industry partners
- Integrating Green Infrastructure Guideline
- Carbon estimate and reporting tool
- Climate risk assessment guide.
These tools are available from the Transport for NSW website.
The environmental impacts of transport will be lessened by reducing the distance people need to travel to workplaces and essential facilities. The Future Transport 2056 Greater Sydney Services and Infrastructure Plan sets out a vision for achieving this by shifting from one central business district to a metropolis of three cities: the Eastern Harbour City, the Central River City and the Western Parkland City. In the future, people will be able to travel to one of these cities or to their nearest strategic centre within 30 minutes from where they live to more conveniently access the jobs and services they need. Future Transport’s environmental sustainability outcomes include (TfNSW 2018a):
- increasing the use of public transport
- reducing the use of single occupant vehicles
- encouraging uptake of electric, hybrid and more fuel-efficient vehicles
- encouraging active transport
- improving the resilience of the network in a changing climate.
The NSW Government has released the Freight and Ports Plan 2018–2023, which offers opportunities for reducing environmental impacts. This is through measures such as:
- working with industry to reduce noise from locomotives
- continuing treatment of affected houses under the Freight Noise Attenuation Program
- supporting the use of electric vehicles
- investigating options to improve accountability for environmental performance in the rail freight industry
- advocating for stronger national vehicle emissions standards
- encouraging the use of safer, cleaner and more productive vehicles.
Initiatives aimed at improving the efficiency of the freight network, such as the adoption of new technologies, will also have positive environmental impacts. In addition, the Plan also includes important initiatives to improve the capacity of the rail network for freight trains and increase the use of rail for transporting freight to and from Port Botany.
Other NSW government strategies that encourage the use of active transport include:
Programs
Public transport
People are more likely to use public transport if services are frequent, reliable, there is good connectivity between different modes, and travel time is competitive with private vehicles.
A range of initiatives are in progress to meet projected demand and encourage people to use public transport.
The More Trains, More Services program will transform the rail network, creating high capacity, turn up and go services. Key elements are:
- upgrading rail infrastructure to simplify the network and improve its resilience
- deploying digital train control technology for greater capacity and reliability
- using City Circle capacity when freed up by the Sydney Metro City and Southwest (see below) to provide more services on other lines.
In 2017, a new timetable boosted capacity on the rail, bus and ferry public transport networks and encouraged increased use across the Sydney network. The new timetable delivers:
- 1,500 extra weekly train services, including 750 on the weekend
- almost 7,000 new weekly bus services
- Over 140 new weekly ferry services.
The Barangaroo Ferry Wharf, which was completed in 2017, increases Sydney’s ferry capacity and services thousands of people travelling to the Barangaroo district, with commuters connected to the CBD via Wynyard Walk.
Sydney Metro is a new stand-alone railway for Sydney, opening in the second quarter of 2019. Services start in the city’s north west, extend under Sydney Harbour, through new underground city stations and beyond to the south west. In 2024, Sydney will have 31 metro railway stations and a 66km stand-alone metro railway system. There will be capacity for a metro train every two minutes in each direction under the Sydney CBD. New metro rail will also link the Sydney CBD to Parramatta and Westmead. The railway servicing the new Western Sydney Airport will be also developed and delivered by Sydney Metro.
Newcastle Light Rail when complete in 2019 will provide a high capacity, frequent service through the city centre. Comprising six stops, it is designed to activate and rejuvenate the civic and shopping centre of Newcastle as part of an overall revitalisation program.
CBD and South East Light Rail, which is scheduled for completion in 2020, will connect Circular Quay along George Street to Central Station, the Moore Park sporting and entertainment precinct, Randwick Racecourse, the University of NSW and Prince of Wales Hospital at Randwick. Stops along the 12-kilometre route are designed to create easy interchange points with other transport modes. The light rail will significantly increase public transport capacity, carrying around 450 passengers – up to nine standard buses. An underground substation at High Cross Park in Randwick, uses geothermal cooling to decrease operational energy use.
Parramatta Light Rail will connect Westmead to Carlingford via Parramatta CBD and Camellia and is expected to open in 2023. In October 2017, the NSW Government announced the preferred route for Stage 2, which will connect the Parramatta CBD to Ermington, Melrose Park, Wentworth Point and Sydney Olympic Park along a nine-kilometre route.
B-Line Program includes bus priority measures and covers 10 bus stops and six new commuter car parks between Mona Vale and the Sydney CBD.
The Fleet Delivery Program includes:
- six new Inner Harbour ferries in 2017
- 24 eight-carriage suburban trains for Sydney in 2018–19
- the new Intercity Fleet, which will replace trains from Sydney to the Central Coast, the Blue Mountains and the South Coast from late 2019
- the Regional Rail Replacement project, which will replace the entire NSW regional train fleet with new trains in the 2020s.
Making journey planning easier
Public transport use is encouraged with apps that provide real time information about timetables and service disruptions. This in turn reduces the wait for services, advises on the fastest route and shows door-to-door options.
Opal is a reusable pre-pay card that can be used on trains, buses, ferries and light rail. It makes it easier for passengers to change mode of transport, streamlines ticket purchasing and reduces queues at stations. Opal cards have also reduced paper ticket waste.
Walking and cycling
The NSW Government’s Future Transport 2056 describes walking and cycling as the most convenient option for short trips around local areas. It emphasises that the 30-minute city will encourage people to walk or cycle, catch public transport or access centres directly by active transport. These initiatives will help improve air quality and maximise the capacity of the existing road network.
Examples of active transport projects include:
- Wynyard Walk, which opened in 2016, provides a fully accessible pedestrian link between Wynyard Station and the CBD western corridor and Barangaroo
- Central Walk, a new underground concourse at Central Station, will improve connections between trains, buses, light rail and the new Sydney Metro
- The GreenWay Active Travel project when completed in 2021, will link the Cooks River cycling and walking track with Iron Cove while enhancing remnant native vegetation
- The Nepean River Bridge, which was completed in late 2018, provides a safe crossing for pedestrians and cyclists across the Nepean River and improves connections to existing and future shared paths, including the Great River Walk
- The proposed Sydney Harbour Bridge northern cycle ramp and southern cycleway, which would provide step-free access at the northern end of the existing Sydney Harbour Bridge cycleway.
In June 2016, the Government announced the NSW Cycling Infrastructure Fund; an $80 million cycling infrastructure package. Funded projects will help build new routes to connect growing communities, provide better access to new walking and cycling paths and help link people to transport hubs, schools, shops and strategic centres.
Delivering the Sydney Green Grid is an objective in the Greater Sydney Region Plan: A Metropolis of Three Cities and in coming decades will increase green space across the Sydney region. It will encourage active transport with cycling and walking paths to provide alternative means of access to suburban centres and open space such as parks and ovals.
The annual Walking and Cycling Program aims to make walking and cycling more convenient, safer and enjoyable for short trips. Funded initiatives aim to:
- reduce congestion
- free up capacity on the public transport system
- encourage walking and cycling as the mode of choice
- create places that successfully meet their intended purpose.
The Program’s projects will prioritise delivery of the Future Transport 2056 Strategy and the Greater Sydney and Regional Services and Infrastructure Plans.
Fuel and vehicle emissions
Key initiatives to reduce emissions include vapour recovery technology at service stations, limiting petrol volatility in summer, promoting improved national vehicle emission and fuel standards and implementation of the released Diesel and Marine Emissions Management Strategy (EPA 2015). See also the responses in the Air Quality topic.
Roads
Strategies for reducing the impacts of roads and related infrastructure during construction, operation and maintenance include (RMS 2016):
- minimising the use of non-renewable resources
- recycling construction materials which diverts waste from landfill
- protecting biodiversity through Environmental Impact Assessments; implementing features such as suspended wildlife bridges and tunnels (Dexter et al. 2016; RMS 2015); and changing proposed routes
- reducing energy use and greenhouse gas emissions through LED traffic lights and GreenPower.
The Smart Motorways program uses technology to reduce congestion, which helps improve air quality. Features include traffic monitoring tools for improved network operation and ramp meters to keep traffic moving smoothly and improve travel times. The M4 Motorway (Lapstone to Mays Hill) will be the first full smart motorway, with completion expected in 2020. Some individual elements of the technology are already in place on Sydney roads including the M1, M2, M5 and M7 motorways.
New roads
Urban road projects can help relieve congestion, reduce noise and improve air quality by diverting traffic away from local roads. Improved travel times can also reduce emissions, provided increased usage doesn’t cancel out these gains.
New roads currently under construction in Sydney are:
- Westconnex, which will be complete in 2023, will link western and south-western Sydney with the city and airport and enable new public transport options on the key corridors of Parramatta Road and Victoria Road.
- Northconnex, a nine-kilometre tunnel motorway which will link the M1 Pacific Highway at Wahroonga to the Hills Motorway at West Pennant Hills. When complete in 2020, Northconnex will take around 5,000 trucks off Pennant Hills Road every day.
Managing freight-related noise
The Strategic Noise Action Plan manages the impact of freight-related noise. Measures to reduce noise at the source include:
- working with operators on the standards for, and maintenance of, rolling stock
- the freight wagon steering standard, introduced in January 2018, which will contribute to a significant reduction in wheel squeal.
The Plan also addresses the use of planning controls and building regulations to minimise development in new locations acutely affected by rail noise.
The Freight Noise Attenuation Program reduces freight noise in affected homes along NSW Government managed rail corridors between Nowra and Newcastle, and west to Lithgow. Noise treatment includes upgraded windows, solid external doors and enhanced ventilation. The program, which began in 2016, aims to treat 200 homes per year over a 10-year period. Over 525 have already been treated.
Ports
From January 2019, NSW Ports is introducing levy discounts at Port Botany and Port Kembla that provide an incentive for vessels to reduce their emissions beyond standards set by the International Maritime Organisation (IMO) (NSW Ports 2018). This is consistent with IMO targets for 70% CO2 reduction by 2050 (Ray 2018).
Future opportunities
Integrated and coordinated strategic approaches to planning will manage the impacts of population growth in NSW. Planning of new residential areas will take into account the ease and viability of public transport to key services and strategic centres in the Greater Sydney Region.
As committed in NSW’s Future Transport 2056, Transport for NSW is leading development of a whole-of-government Electric and Hybrid Vehicle Plan. The plan outlines NSW Government actions to facilitate the take up of low emission, fuel efficient vehicles and maximise their benefits for passenger and freight mobility, productivity, the environment and liveable communities.
The Plan is being developed with input from 11 government agencies and co-design workshops with over 20 industry bodies. This approach is building effective partnerships to develop clear policy directions and actions that can be implemented in partnership with industry, to prepare for and maximise the benefits that the transition to Electric Vehicles (EVs) can bring to NSW.
Improved access to transport data will allow for better planning of services and more targeted provision of new infrastructure. The availability of anonymous Opal travel data provides new opportunities for research and system planning. Data being collected on cycleway use also warrants further analysis.
Technological changes supporting ride-sharing and delivery vehicles for online purchases may also affect road usage patterns. Data on these trip reasons is now being collected through the Household Travel Survey.
References
References for Transport
ABS 2008, 9208.0 – Survey of Motor Vehicle Use, Australia, 12 months ended 31 October 2007, Australian Bureau of Statistics, Canberra [www.abs.gov.au/AUSSTATS/[email protected]/allprimarymainfeatures/9310017FE20A9F88CA2578F4001E4EB2?opendocument]
ABS 2017, 9208.0 – Survey of Motor Vehicle Use, Australia, 12 months ended 30 June 2016, Australian Bureau of Statistics (data cubes), Canberra [www.abs.gov.au/AUSSTATS/[email protected]/Lookup/9208.0Main+Features112%20months%20ended%2030%20June%202016?OpenDocument]
ABS 2018, 8146.0 – Household Use of Information Technology, Australia, 2016–17, Australian Bureau of Statistics, Canberra [www.abs.gov.au/AUSSTATS/[email protected]/allprimarymainfeatures/ACC2D18CC958BC7BCA2568A9001393AE]
BTS 2014, Household Travel Survey Report 2012/13, Bureau of Transport Statistics, Sydney [bts.nsw.gov.au/Statistics/Household-Travel-Survey/default.aspx#top]
DEE 2018, State and Territory Greenhouse Gas Inventories 2016, Commonwealth Department of Environment and Energy [www.environment.gov.au/climate-change/climate-science-data/greenhouse-gas-measurement/publications/state-and-territory-greenhouse-gas-inventories-2016]
Infrastructure NSW 2012, First Things First: The State Infrastructure Strategy 2012–2032, Infrastructure NSW, Sydney [www.infrastructure.nsw.gov.au/expert-advice/state-infrastructure-strategy-2012.aspx]
Infrastructure NSW 2014, State Infrastructure Strategy Update 2014: Recommendations to the NSW Government, Infrastructure NSW, Sydney [www.infrastructure.nsw.gov.au/expert-advice/state-infrastructure-strategy-update-2014.aspx]
NSW Ports 2018, ‘NSW Ports introduces Australia’s first environmental incentive for shipping lines’, NSW Ports, 16 May 2018 [www.nswports.com.au/news/article/nsw-ports-introduces-australias-first-environmental-incentive-for-shipping-lines]
Ray C 2018, ‘Discounts for cutting ship emissions’, The Australian, 15 June 2018 [www.theaustralian.com.au/national-affairs/climate/discounts-for-cutting-ship-emissions/news-story/ecd311c9f84ad6cd0c230e25e3d8415e]
RMS 2015, Years of research shows fauna crossings on Pacific Highway are a success, Roads and Maritime Services, Sydney [www.rms.nsw.gov.au/about/news-events/news/roads-and-maritime/2015/151023-fauna-crossings-on-pacific-highway-a-success.html]
RMS 2016, Roads and Maritime Services Environmental Sustainability Strategy 2015–19, Roads and Maritime Services, Sydney [www.rms.nsw.gov.au/about/environment/sustainability/index.html]
RMS 2018a, Table 1.1.4 Motive power by vehicle type – registered vehicles as at 30 June 2017, Roads and Maritime Services, Sydney [www.rms.nsw.gov.au/about/corporate-publications/statistics/registrationandlicensing/tables/table114_2017q2.html]
RMS 2018b, Table 1.1.1 Quarterly trend in registered vehicles by vehicle type, Roads and Maritime Services, Sydney [www.rms.nsw.gov.au/about/corporate-publications/statistics/registrationandlicensing/tables/table111.html]
TfNSW 2017a, Annual Report 2016–17, Transport for NSW, Sydney [www.transport.nsw.gov.au/system/files/media/documents/2017/tfnsw-annual-report-2016-17.pdf (PDF 13.3MB)]
TfNSW 2017b, Walking and Cycling Program Guidelines 2018–19, Transport for NSW, Sydney [www.rms.nsw.gov.au/documents/business-industry/partners-and-suppliers/lgr/walking-cycling-program-guidelines.pdf (PDF 9.8MB)]
TfNSW 2018a, Future Transport 2056, Transport for NSW, Sydney [future.transport.nsw.gov.au]
TfNSW 2018b, NSW Freight and Ports Plan 2018–2023, Transport for NSW, Sydney [www.transport.nsw.gov.au/projects/strategy/nsw-freight-and-ports-plan]
TfNSW 2018c, Sydney GMA Regions Viz, Transport for NSW, Sydney [www.transport.nsw.gov.au/performance-and-analytics/passenger-travel/surveys/household-travel-survey-hts/sydney-gma-regions]
TfNSW 2018d, Transport Performance and Analytics (TPA) data, Transport for NSW, Sydney