Summary
The climate of NSW is changing due to global warming. The effects of climate change on the people and environment of NSW are expected to become more pronounced as the climate continues to change over this century.
Why climate change is important
Emissions of CO2 and other greenhouse gases from human activity including power generation, industry, transport, land-use and land cover change, and agriculture, accumulate in the atmosphere, trapping heat and leading to global warming.
Without substantial, concerted action, climate change poses a major threat to humanity and most living systems on Earth. While impacts are being observed now, they will become more pronounced over time. Extreme events such as extreme heat, dangerous fire weather and heatwaves are projected to increase in duration, magnitude and frequency with impacts on communities and infrastructure.
In 2016, 194 nations (98%) signed the Paris Climate Agreement, which focuses on limiting global warming to well below 2°C and aims to limit warming to 1.5°C. Each country has pledged to make national contributions to reducing greenhouse gas emissions. However, concentrations are continuing to increase at rates that will increase temperatures beyond the Paris Agreement targets. Cuts in emissions well beyond those pledged under the agreement will be necessary to meet the target. Even with global warming of 1.5°C, climate-related risks for human and natural systems will be higher than they are today (). The extent of the impacts of climate change will ultimately be determined by the concerted actions taken by nations globally to reduce greenhouse gas emissions.
Watch this video to find out how the Paris Agreement works (1.40 minutes)
NSW indicators
| Indicator and status | Environmental trend |
Information reliability |
|
|---|---|---|---|
| Annual mean temperature (present) |
|
Getting worse | ✔✔✔ |
| Sea level rise (present) |
|
Getting worse | ✔✔✔ |
| Rate of temperature warming |
|
Stable | ✔✔✔ |
| Annual mean temperature (2070): projected outcomes |
|
Getting worse | ✔✔ |
| Sea level rise (2070): projected outcomes |
|
Getting worse | ✔✔ |
Notes:
Terms and symbols used above are defined in .
Status and Trends
Globally, warming has increased by approximately 1.1°C since industrialisation (1850–1900). Based on current trajectories, global temperature will likely increase by approximately 1.5°C by around 2030. Exceeding this target will result in more serious and frequent heat extremes and bushfires, and fewer cold extremes.
In NSW, the mean temperature for 2011–2020 was about 1.1°C higher than late last century (1961–90), with 2018 and 2019 being the warmest years on record. Mean temperatures during 2020 in NSW were generally above average, with the exception of the state’s south-west. Black Summer fires peaked in December 2019–January 2020, causing widespread destruction and prolonged poor air quality in Sydney and Canberra.
Other observed changes include increased seasonal variability in rainfall and increases in some extreme weather events such as heatwaves.
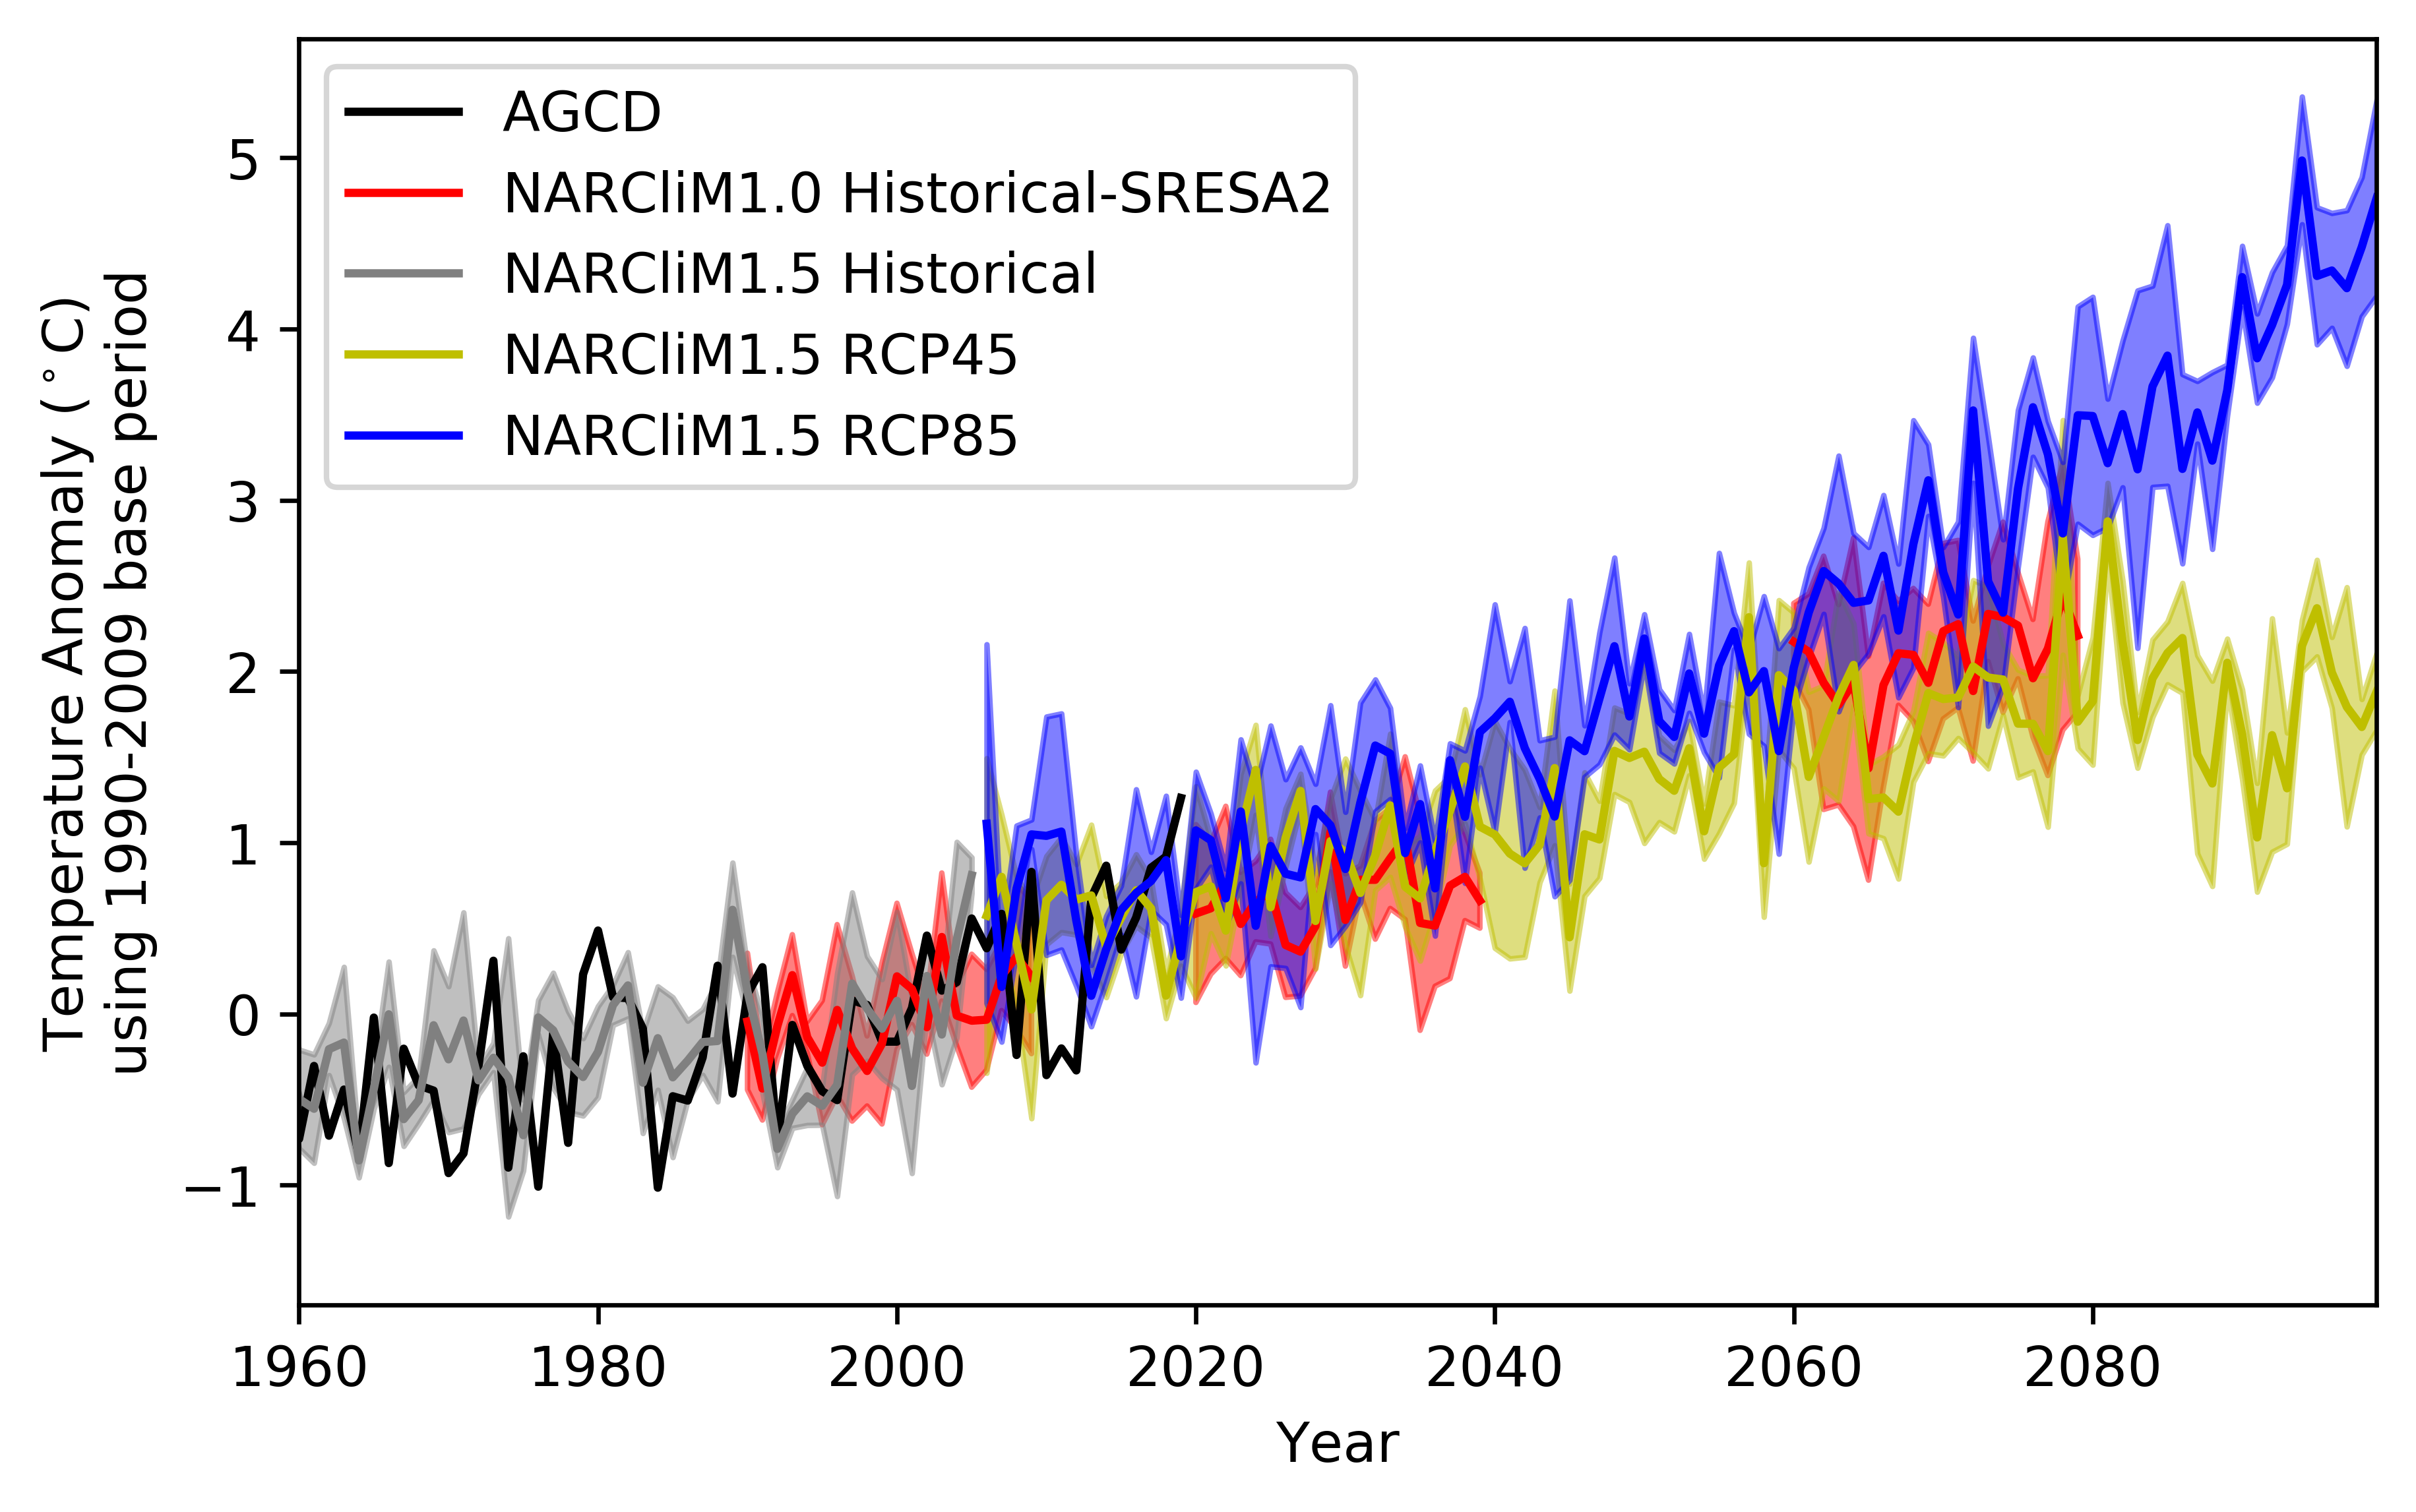
The changes to climate are expected to become more severe over time. Regional climate projections over NSW suggest that by 2070 mean temperature will have risen by a further 2.1°C relative to a 1990–2009 baseline period, with much larger increases in extreme temperatures (Spotlight figure 21).
Spotlight figure 21: Observed and projected changes in annual mean temperatures for NSW and the ACT
Notes:
Projected changes in annual mean temperatures use data from two generations of NARCliM regional climate simulations, NARCliM1.0 and NARCliM1.5. Together, these simulations are designed to complement each other and provide a range of plausible climate futures.
AGCD data is from http://www.bom.gov.au/climate/austmaps/about-agcd-maps.shtml0
Since the late 20th century, sea surface temperatures (SST) in the western Tasman Sea have increased by 0.2–0.5°C per decade. For the Sydney area, SST have increased by 0.2°C per decade since 1945.
The rate of sea level rise has nearly doubled. From an average rate of 1.7 mm per year during most of the 20th century, sea levels at the Port Kembla Baseline Sea Level Monitoring Station now indicate an average 3.4 mm increase per year since 1991. Globally, sea levels are expected to rise by a half to one metre by the end of the 21st century.
Pressures
The future effects of climate change will be extensive, including more extreme weather events, increasing coastal erosion and inundation and greater impacts on infrastructure, human health and wellbeing. The survival of many species and ecosystems, water availability, and the productivity of some agricultural systems will be affected.
Responses
Effective action to counteract the effects of climate change depends on concerted action globally. The extent of climate change impacts will be determined by mitigation and adaptation actions and the time taken to reduce greenhouse gas emissions.
The NSW Climate Change Policy Framework released in 2016 sets targets for NSW to achieve net zero emissions by 2050, become more resilient to a changing climate and adapt to climate change.
The AdaptNSW website provides guidance on implementing adaptation actions. Integrated Regional Vulnerability Assessments have been completed across NSW to identify regional areas where adaptation actions are needed.
The NSW and ACT Regional Climate Modelling project (NARCliM) (, ) provides high resolution projections of plausible future climate changes regionally for NSW and south-eastern Australia and has informed many of the projections in this chapter. NARCliM regional climate projections are available at the NSW Climate Data Portal.
Related topics: | | |
Context
A natural greenhouse effect has been warming the Earth for some 3.7 billion years, keeping it habitable for life. Energy radiated by the sun passes through the atmosphere and reaches the Earth’s surface relatively unimpeded. Some energy is absorbed by oceans, soils and vegetation, and is mostly re-emitted as infrared radiation (i.e. heat). This radiation is less able to pass through the atmosphere and is partly trapped by greenhouse gases in the atmosphere, including carbon dioxide, methane, water vapour, nitrous oxide and ozone.
The temperature of the Earth has not been constant over time. Global temperatures and atmospheric greenhouse gas concentrations have fluctuated naturally over millions of years -- climate change is therefore not a new phenomenon. However, a seemingly small change in mean global temperature can have significant impacts on the Earth’s climate. The difference between a planetary ice age and a warm interglacial period is a variation in global mean temperature of 6–7°C (). Temperature changes of this scale can lead to substantial disturbances of the world’s climate and ecosystems, and have triggered mass extinctions in the past.
Historically, these natural cycles of change have taken place gradually over millennial timeframes. Since the start of the industrial age in about 1750, the burning of fossil fuels (coal, oil and gas) with land-use changes, agriculture and other human activities, have resulted in growing emissions of greenhouse gases and an accumulation of these in the atmosphere. From the middle of the twentieth century these emissions have increased markedly. The rates of increase now being observed in the atmospheric concentrations of greenhouse gases and consequently in temperature are unprecedented in the past 800,000 years ().
These increases in atmospheric greenhouse gas concentrations have in turn led to unprecedented changes in the rate of global warming. Nineteen of the highest global mean surface temperature years have occurred since 2000 (). The global mean surface temperature in 2020 matched that of 2016 and was the highest on record since pre-industrial times (1850).
The Intergovernmental Panel on Climate Change (IPCC) is a United Nations body that assesses the latest scientific research on climate change and its effects from around the world. The IPCC has published five comprehensive assessment reports to date, releasing the Fifth Assessment Report in 2014 (). In August 2021, the IPCC released a preliminary report to the Sixth Assessment Report (). Some key findings from this report include:
- globally, warming has now reached around a 1.1°C increase in surface air temperature since industrialisation from 1850–1900
- the human influence is clear and is the dominant cause of global warming since 1950
- based on current trajectories (if nothing changes) the mean global temperature will likely increase to about 1.5°C by 2030
- for Australia, heat extremes and heatwaves are likely to increase and cold hazards will likely decrease over the 21st century
- a decrease in cool season mean rainfall is projected for eastern Australia.
Global sea level rise is accelerating due to increased rates of ice loss from Greenland and Antarctica and thermal expansion of seawater (). Sea level rise is expected to lead to increased erosion of coastlines and more frequent and extensive coastal flooding. In the longer term, permanent inundation of low-lying coastal areas and increased tropical cyclone winds and extreme waves are likely, which will exacerbate coastal hazards.
In the last 50 years, global oceans have warmed and taken up more than 90% of excess heat (). Ocean warming and acidification due to increased levels of carbon dioxide dissolved in seawater will lead to changes in the composition of marine ecosystems. Intensifying global warming will increase the exposure of small islands, low-lying coastal areas and deltas to the risks associated with sea level rise, including increased saltwater intrusion, flooding and damage to infrastructure ().
Climate conditions are likely to become less favourable for many species and ecosystems, which will be forced to migrate or adapt physiologically to survive. Changes in climate will also lead to reduced productivity in some agricultural systems, requiring a transition to alternative crops or shifting the location of some industries. Detrimental effects are also expected on human health and wellbeing.
Status and Trends
Changes in climate
Find out how the impacts of climate change may affect your community
Temperature
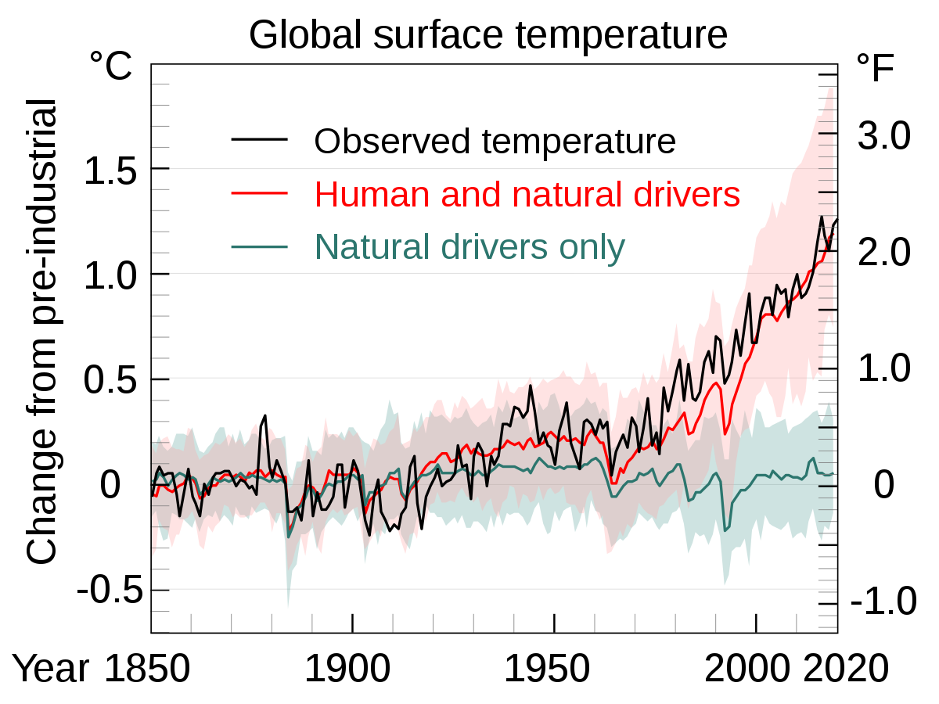
Global average temperature has risen by around 1.1°C between 1910 and 2020 (Figure 21.1, ). All of NSW and the ACT have also warmed since 1910. The average annual temperature over NSW has increased by 1.4°C since 1910 (). The recent IPCC report (2021) has shown that natural forcing alone does not account for the observed temperature trends and more than 90% of the warming is due to greenhouse gases associated with human activities (Figure 21.1).
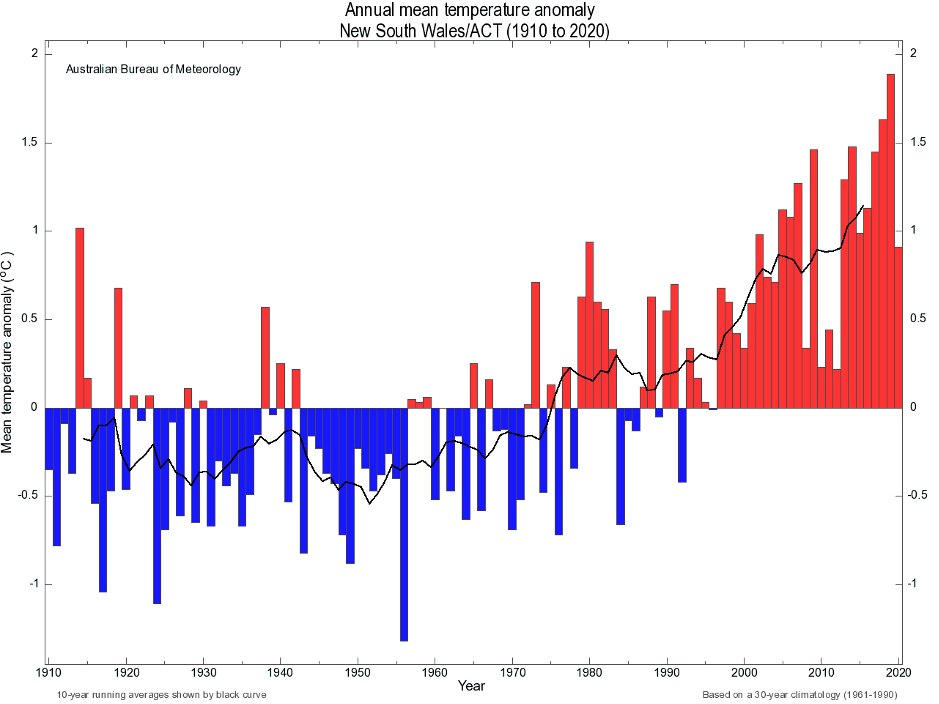
Although the mean temperature over NSW and the ACT is increasing, there is also year to year variability in average temperatures. However, since the 1960s there has been a consistent warming trend in NSW, with the average temperature of each decade being warmer than the previous decade (Figure 21.2).
There has been also a notable increase in maximum and minimum temperatures in the cool season (April through October). Compared to the 20th century, eastern coastal regions have experienced about a 0.5–0.8 °C and 0.3–0.5 °C increase in cool season maximum and minimum temperatures respectively since 2000 (Figure 21.3).
Figure 21.1: Observed and projected changes in annual mean global surface temperature from 1850–2020
Notes:
The red and green lines show CMIP6 climate model simulations of the predicted temperature when exposed to both human and natural forces (red line), and to only natural forces such as solar and volcanic activity – green line. Solid coloured lines show the multi-model average, and shaded areas show the likely temperature variations.
Figure 21.2: Observed changes in annual mean surface temperature in NSW and the ACT from 1910–2020
Notes:
The blue and red bars denote the decrease and increase in temperatures respectively from the 1961–1990 base period.
Figure 21.3: Relative change in cool season (April–October) temperatures comparing maximum (a) and minimum (b) temperatures from 2000–2019 with those from 1910–1999.
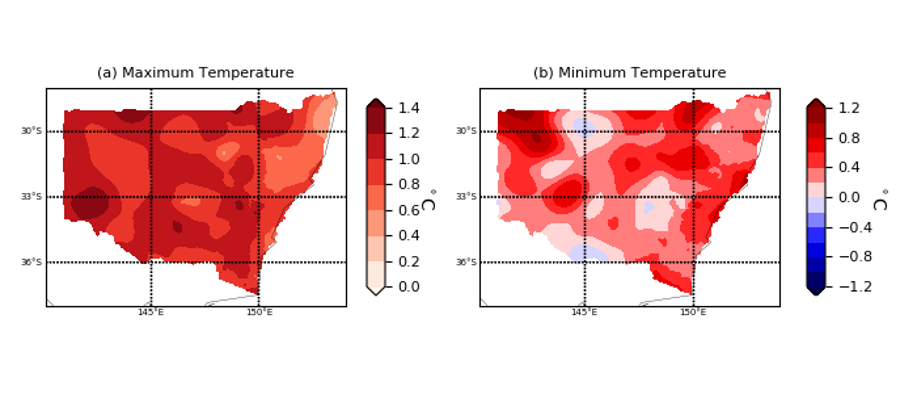
Notes:
Australian gridded climate data (AGCD) is used for analysis.
Temperature projections
Global and regional climate models provide future temperature projections. The NSW and ACT Regional Climate Modelling project (NARCliM) (, ) provides high resolution (10 km) climate projections over south-east Australia, as well as 50 km resolution climate projections over Australasia. There are currently two generations of NARCliM simulations, NARCliM1.0 and NARCliM1.5. Together, these simulations are designed to complement each other and provide a range of plausible climate futures.
NARCliM simulations show that NSW and the ACT will continue to get hotter, with less warming along the coast compared with inland areas (, ).
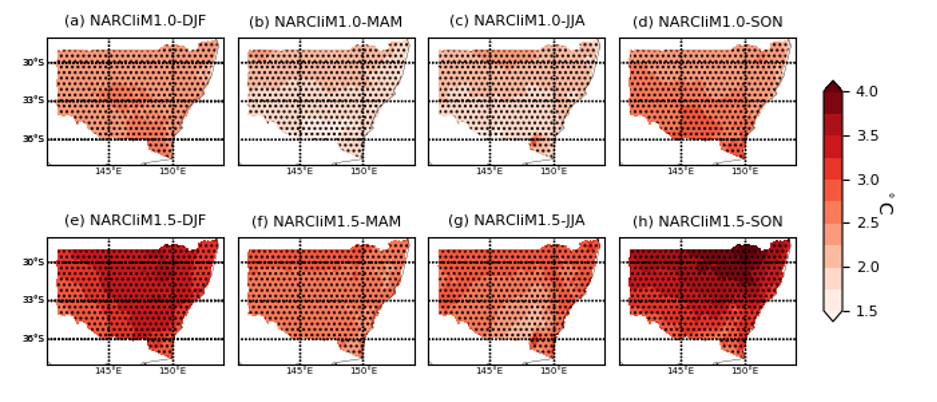
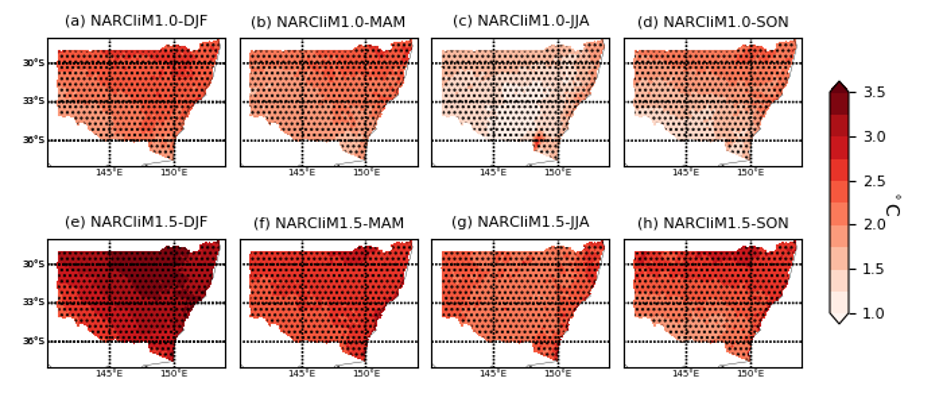
NARCliM1.0 simulations show that in a scenario for 2030 with high greenhouse gas emissions (SRES A2), average NSW and ACT annual mean temperatures are projected to increase by about 0.7°C from 1990–2009, with a 2.1°C increase expected by 2070 (). NARCliM1.5 simulations show that in an updated scenario for 2030 with high greenhouse gas emissions (RCP8.5), average NSW and ACT annual mean temperatures are projected to increase by about 1.1°C from 1990–2009, with a 2.7°C increase expected by 2070 (Spotlight figure 21).
The higher temperatures in NARCliM1.5 as compared to NARCliM1.0 are attributed to the greater emissions scenarios (RCP8.5) used, particularly in the second half of the 21st century (). There is also large seasonal variation in maximum and minimum temperature projections (Figure 21.4 and Figure 21.5) across the state, with the largest increases in spring (September–November) and summer (December–February) ().
For more information about NARCliM data, see the NSW and ACT Regional Climate Modelling project section.
These significant mean temperature increases in NSW make the state vulnerable to the related growth in the frequency and intensity of extreme heat events – see the Environmental impacts of climate change section.
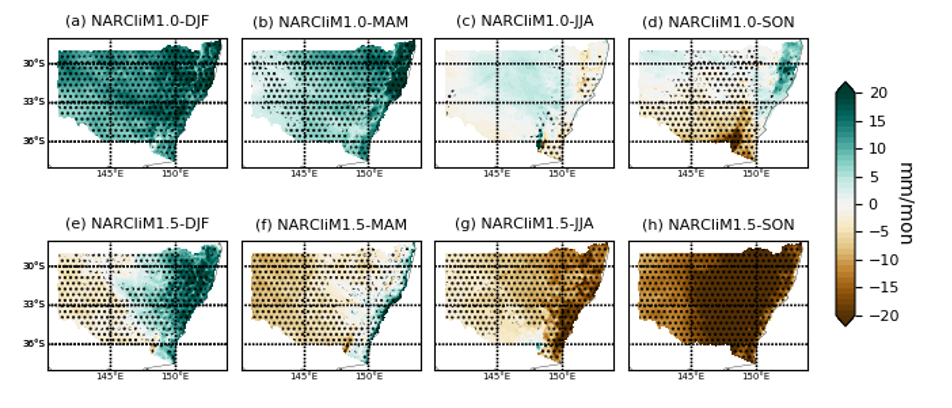
Figure 21.4: Projected changes in maximum temperatures for NSW and the ACT using data from NARCliM1.0 (a - d) and NARCliM1.5 (e - h) climate simulations
Notes:
- DJF = December, January, February (summer)
- MAM = March, April, May (autumn)
- JJA = June, July, August (winter)
- SON = September, October, November (spring).
Stippling in the graphics means the changes are statistically significant.
Figure 21.5: Projected changes in minimum temperatures for NSW and the ACT using data from NARCliM1.0 (a - d) and NARCliM1.5 (e - h) climate simulations
Notes:
- DJF = December, January, February (summer)
- MAM = March, April, May (autumn)
- JJA = June, July, August (winter)
- SON = September, October, November (spring).
Stippling in the graphics means the changes are statistically significant.
Rainfall
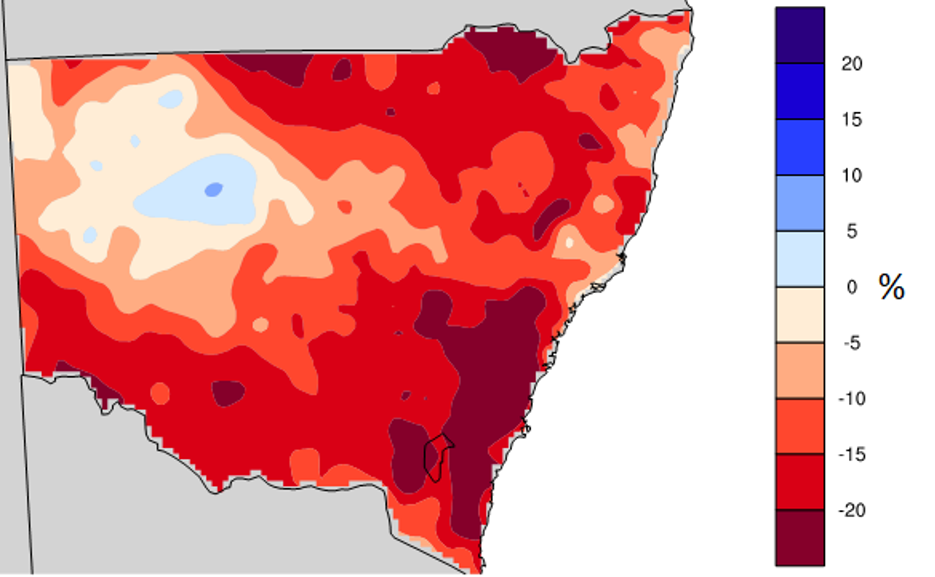
Changes in rainfall across NSW have been more variable, due to the strong influence by natural variation from drivers such as El Niño, La Niña, the Indian Ocean Dipole and the Southern Annular Mode. Despite this natural variability, some trends are evident in the observational record. Mean annual rainfall over NSW since 1900 has shown large differences between wet and dry periods between decades but no clear long-term trend (). However, there has been a notable decrease in rainfall in the cool season (April through October). Compared to the 20th Century, there has been a 15% decrease in cool season rainfall in southern NSW in 2000–2019 (Map 21.1). Southern NSW is largely dependent on cool season rainfall for agricultural production ().
Map 21.1: Decrease in rainfall between April and October (cool season) in NSW between 1900–99 and 2000–19
Rainfall projections
Projections indicate that NSW will continue to have highly variable rainfall from year to year (Figure 21.6), making longer-term changes difficult to discern. NARCliM1.0 and NARCliM1.5 simulations capture historical rainfall variability well, but the simulated future rainfall differs between the two NARCliM generations, especially for 2060–2079.
For the period 2060–2079, NARCliM1.5 simulations generally project widespread future decreases in rainfall during most seasons and in most locations in NSW, with the largest decreases in spring and winter. However, these simulations do project increases in rainfall in eastern coastal NSW in summer and autumn (Figure 21.7).
In contrast, NARCliM1.0 simulations generally project future increases in rainfall over most regions of NSW in summer and autumn. However, there will be decreased precipitation (rainfall and snowfall) in some regions, mostly in southern NSW, in winter and spring by 2060–2079.
The differences between the two generations of NARCliM can be attributed to the global climate models from which the regional projections are derived () and both outcomes (a wetter or drier future) are considered plausible.
Consistent changes projected by both versions of NARCliM include:
- increased rainfall in coastal areas during summer and autumn
- decreased rainfall in southern NSW in spring
- decreased rainfall in eastern NSW in winter.
In addition, the CSIRO predicts that extreme rain events in NSW and ACT will become heavier by the middle of the 21st century ().
Figure 21.6: Observed and projected changes in annual mean precipitation for NSW and the ACT from 1960–2080 using data from NARCliM1.0 and NARCliM1.0 climate simulations
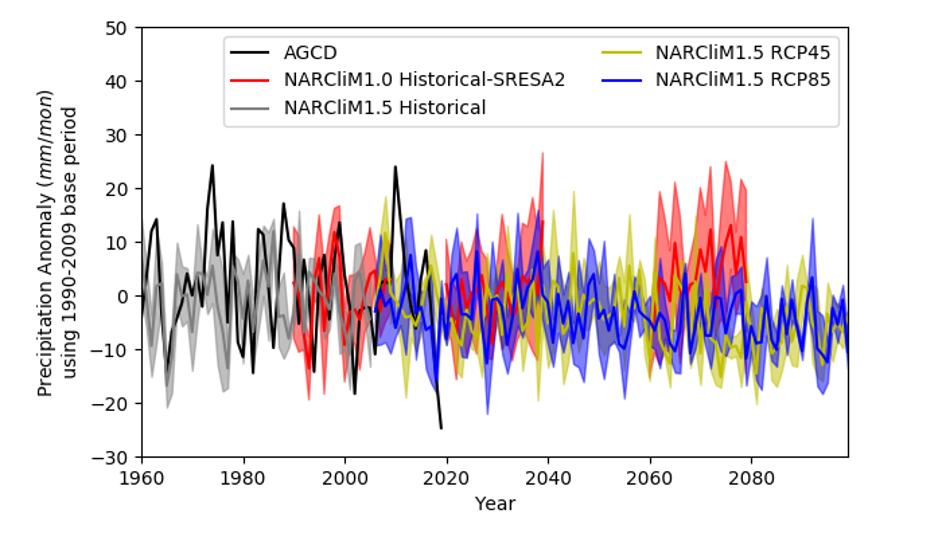
Figure 21.7: Projected changes in seasonal mean precipitation for NSW and the ACT using data from NARCliM1.0 (a - d) and NARCliM1.5 (e - h) climate simulations
Notes:
- DJF = December, January, February (summer)
- MAM = March, April, May (autumn)
- JJA = June, July, August (winter)
- SON = September, October, November (spring)
Stippling in the graphics means the changes are statistically significant. The Mann–Whitney U test (α = 0.05) is used to verify the statistical significance.
Ocean temperatures
Climate change is leading to increases in ocean temperatures, and south-eastern Australia is particularly at risk. This region is a global hotspot for ocean warming as the Tasman Sea is one of the world’s fastest warming regional seas. Warming is occurring at around four times the global average, due to the increased strength and southward penetration of the East Australian Current (EAC) (; ; ). Warming adjacent to the western boundary of the EAC is non-uniform and southern NSW shelf water temperatures are rising more rapidly than other regions along Australia’s east coast ().
With the rise in ocean temperatures, there have also been increases in 'marine heatwaves'. These expose ocean ecosystems, plants and animals to temperatures they are not adapted to. Australia’s east coast last experienced one during summer 2015–16 (). Above normal sea-surface temperatures (SST) offshore of south-east Australia lasted for up to 251 days and increased temperatures up to 2.9 °C. Impacts on regional coastal ecosystems included disease outbreaks in farmed shellfish, wild mollusc mortality, and out-of-range species observations. Marine heatwaves have been increasing globally and their occurrence in eastern Australia is projected to increase ().
An analysis of data from Sydney’s National Reference Station (NRS) off Cronulla/Port Hacking in Sydney previously indicated that SST had risen at a rate of 0.075°C per decade from 1953–2005 (). An updated analysis at the NRS to 2020 has indicated an even more rapid warming of 0.196°C per decade from 1953–2020 (Roughan et al. submitted, Figure 21.8). Statewide, increases in SST of 0.2–0.5 °C per decade have been observed off the east coast of NSW and Tasman Sea based on satellite data ().
Moored temperature sensors along Australia’s east coast from Stradbroke Island in Queensland to Maria Island in Tasmania indicate that warming is uneven and varies from north to south. Off the coast of NSW, the southern half of the state has warmed (0.48 °C per decade) at a rate twice that of the north ().
Figure 21.8: Sea-surface temperature differences from the Port Hacking National Reference Station PH100m for 1953–2020
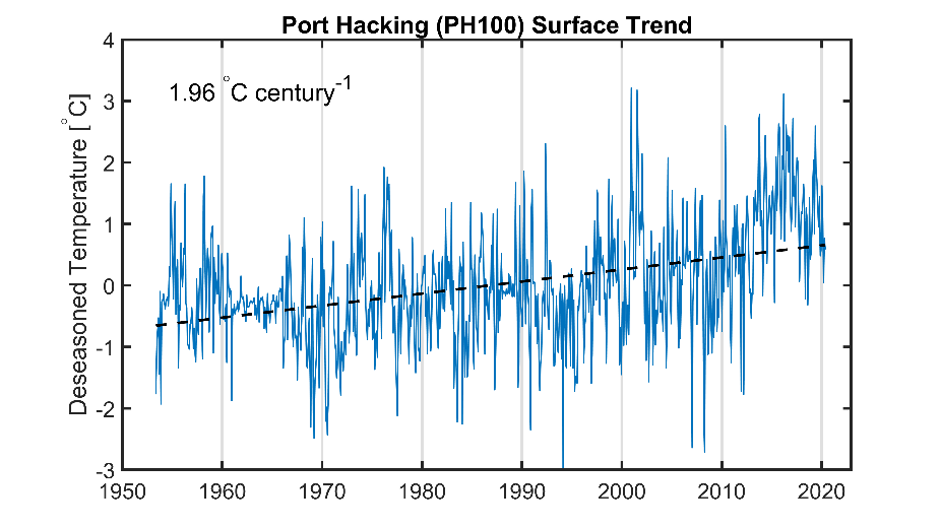
Notes:
The presence of a seasonal cycle in the temperature data has been adjusted to create the deseasonalised temperature data shown. The dashed black line is the trend.
Integrated Marine Observing System (IMOS) is enabled by the National Collaborative Research Infrastructure Strategy (NCRIS). It is operated by a consortium of institutions as an unincorporated joint venture, with the University of Tasmania as lead agency.
Sea level rise
Since 1900, around the world the sea level has risen by 0.20 m at a rate of:
- 1.3 mm a year between 1901 and 1971
- 1.9 mm a year between 1971 and 2006
- 3.7 mm a year between 2006 and 2018 ().
Globally, the magnitude of future sea level rise is determined by the extent of ocean warming (thermal expansion) and the loss of land-based ice from Greenland and Antarctica, while locally, changes in ocean dynamics also have an influence.
In south-east Australia, rates of sea level rise are generally consistent with the global average (). The measured rate of sea level rise at the NSW Baseline Sea Level Monitoring Station in Port Kembla from July 1991 to the end of July 2021 (Figure 21.9) was approximately 3.4 mm per year () equating to a total increase in mean sea level of around 10 cm.
Figure 21.9: Measured historical annual mean sea level at the Port Kembla Seaframe monitoring station from 1991 to 2020
Notes:
The 1991 data only includes the part of the year following the site’s upgrade as part of the Australian Baseline Sea Level Monitoring Project.
Sea level rise along the NSW coastline is projected to continue throughout the 21st century, with larger projected increases in the higher greenhouse gas emissions scenarios. In Sydney harbour, model predictions suggest a likely sea level rise between 0.21–1.06m by 2100 (; ).
Observed and projected mean sea level rise for Port Kembla is shown in Figure 21.10. These sea level rise projections use IPCC AR6 modelling, which uses different socio-economic developments and trajectories for greenhouse gas concentrations (see the ‘SSP-RCPs’ in Figure 21.10). The observed values (black line) include decadal observations from the Port Kembla Seaframe tide gauge. Projected mean sea level rise uses medium-confidence modelling for several SSP-RCP scenarios, all excluding ice sheet processes, which are ice mass losses arising from melting of the Greenland and Antarctic ice sheets. The projections show the medians (solid lines) and 17–83 percentile model ranges (dotted lines). Also shown is the 95th percentile high end projections for the low-confidence modelling (SSP 585), including ice sheet processes. This provides an indication of the upper potential range of sea level rise allowing for less certain ice sheet processes (see ).
Figure 21.10: Observed and projected mean sea level rise at Port Kembla using IPCC AR6 modelling (SSP-RCP) for different greenhouse gas emission levels
Notes:
See IPCC 2021 chapter 9 and IPCC 6th Assessment Report Sea Level Projections Tool for more information
Environmental impacts of climate change
The observed changes to climate and the projected future changes described in previous sections are already having widespread effects on the natural and urban environments of NSW. In many areas the impacts are already apparent and will become more extensive and pronounced over time.
Extreme weather and climate events
One consequence of increases in mean temperature is changes in temperature-related extremes. The IPCC AR6 report () shows that over Australia heat-related extremes have increased and cold-related extremes have decreased. The report also concludes that these trends in hot and cold extremes are projected to continue in future.
Another consequence of increases in mean temperature is an increase in the moisture-holding capacity of the atmosphere (). This increase is due to the Clausius-Clapeyron relation (), i.e. the water-holding capacity of the atmosphere increases by around 7% for every 1 increase in temperature, which by itself would be expected to cause an intensification of extreme precipitation events. However, changes in atmospheric dynamics (which encompass all physical processes within the atmosphere, e.g. circulation, convection) are expected to complicate this response and lead to diverse regional changes in precipitation extremes ().
Over NSW, climate extremes like heatwaves, bushfires, flooding, hail and storms have historically had the costliest impacts. This section explains how atmospheric warming impacts a range of climate extremes experienced in NSW.
Heatwaves
Heatwaves are broadly defined as prolonged periods of excessive heat (Perkins and Alexander 2013) and can have disastrous impacts on human health (), agriculture, workplace productivity, wildfire frequency and intensity, and public infrastructure (). In Australia, heatwaves are one of the deadliest natural hazards, causing 55% of all natural disaster related deaths () and costing the economy about US$6.2 billion every year ().
Heatwaves have increased in intensity, duration, and frequency in parts of NSW and the ACT since 1911 (). The most significant increases in heatwave intensity have occurred along the Great Dividing Range, in parts of the far west and eastern seaboard (). In NSW, statistically significant increases in heatwave frequency and length of the longest heatwave each year are projected for 2030 under all emission scenarios. By 2070, statistically significant increases in peak heatwave temperatures, heatwave frequency and length of the longest heatwave each year are projected.
Cold extremes
The frequency of extremely cold days and nights has declined across Australia. An exception to this is for extremely cold nights is in parts of south east and south west Australia which have seen significant cool season drying, and hence more clear winter nights (). The number of frost days per year in Australia has, on average, declined at a rate of 0.15 days per decade in the past century, except in some regions of southern Australia ().
The latest global climate models from the World Climate Research Programme’s (WCRP) Coupled Model Intercomparison Project 6 (CMIP6) project decreases in the intensity and frequency of cold extremes over south-eastern Australia, as measured by the monthly minimum value of daily minimum temperatures ().
Urban heat
Urban centres and cities are warmer and typically less humid than surrounding rural areas, a phenomenon known as the urban heat island (UHI) effect, noting though that the UHI temperature difference is usually larger at night than during the day, and also larger during winter than summer. Urbanisation exacerbates effects of global warming in cities. Cities create their own microclimates by influencing the surrounding atmosphere and interacting with climate processes.
Human activity, heat-absorbing concrete, glazing, black roof tiles and other building materials, combined with limited vegetation and tree canopy, contribute to the UHI effect. One-kilometre simulations over Sydney greater metropolitan area show that future changes to land-use could enhance temperature increases caused by climate change (). These simulations show that the largest temperature increases are projected to occur in areas converted from forest and grasslands to new urban developments (), for example, in north west and south west Sydney. The largest temperature increases are likely to occur on summer afternoons and during the night.
Note that the UHI temperature difference is usually greater at night than during the day, and during winter than in summer.
Teachers: explore this resource on urban heat Stage 3 students
Drought
Australia’s climate is dominated by high seasonal and inter-annual rainfall variability and a complex combination of large-scale climate drivers such as El Niño Southern Oscillation, the Pacific Decadal Oscillation, the Indian Ocean Dipole, and Southern Annular Mode (; ). As a result, drought is a recurring feature of the Australian environment.
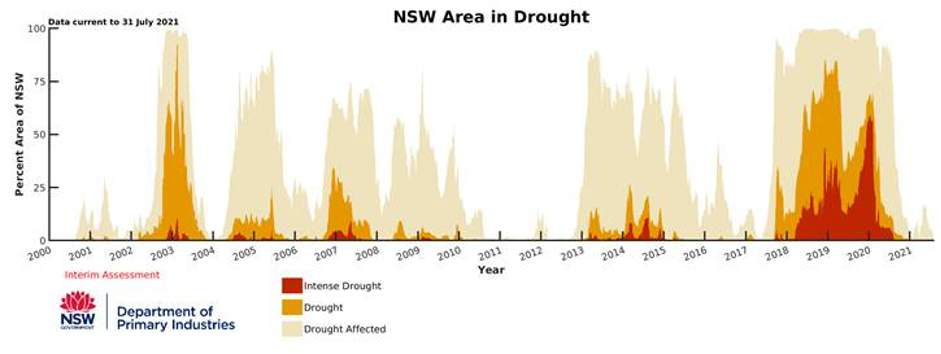
All droughts are unique, and range greatly in duration and intensity. The NSW Department of Primary Industries monitors drought across NSW through the Enhanced Drought Information System (EDIS) (). Figure 21.10 tracks drought over a 20-year period from 2000 to 2021. The ‘Millennium Drought’ was characterised by a sequence of lower intensity drought events separated by short recovery periods. In contrast, the most recent drought in 2017–19 was shorter but considerably higher intensity and covered a much larger area. This period was also characterised by the relatively weak state of major climate drivers ().
Figure 21.11: Area of NSW in drought from 2000 to 2021, as monitored by NSW DPI's Enhanced Drought Information System
Statewide, the evidence for future droughts is subject to considerable scientific uncertainty. Under climate change, drought is expected to increase in severity and frequency in some areas due to decreasing regional precipitation, and potentially increasing evaporation (; ;; ). Droughts may begin quickly, last longer and be more intense (). The strength of these overall expectations is the subject of ongoing scientific work, for example at regional level there is the prospect that feedback through evapotranspiration could dampen these effects ().
Due to the many definitions of drought and the complex interactions involved between the atmosphere and land surface, robust regional projections are difficult to formulate. However, global and regional climate models tend to agree that meteorological drought, which is concerned only with long term decreases in rainfall, will intensify, last longer and become more frequent in southern NSW (; ; ; ).
Storms and cyclones
In NSW, climate change is expected to affect the behaviour of storms and associated phenomena such as cyclones, high winds, hail and lightning. Future projections of hailstorms over NSW based on recent climate modelling remain highly uncertain ().
Research indicates that in some parts of eastern Australia climate change may be associated with future increases in the frequency of thunderstorms (). Storms with the greatest impact on NSW are East Coast Lows, which are low-pressure systems that develop off the south east coast of Australia. Decreases in the frequency of these are projected during winter months, but there is considerable uncertainty in projection of East Coast Lows in warmer months (; ; ; ).
Flood
Floods and extreme storms damage property and infrastructure and affect the health and wellbeing of communities. Changes in flood frequency and intensity and their impacts on the environment are difficult to project because changes in flood levels and associated annual exceedance of rain can be attributed to a range of factors. These include changes in atmospheric forcings, catchment management, and land use changes including urbanisation and deforestation which can affect the translation of rainfall to runoff ().
Despite the many factors contributing to flood hazard, climate models only simulate rainfall and generally at a coarser resolution than ideally required to characterise flood hazard. Nonetheless, some predictions of flood under climate change have been made. For example, increases in the magnitude and frequency of flood events in Parramatta, Hawkesbury-Nepean and Queanbeyan rivers are projected (). The frequency of a one in a 100-year flood may be reduced to:
- one in 44 years in Upper Parramatta River
- one in 35 years in Hawkesbury-Nepean River
- one in 10 years in Queanbeyan River.
Different trends may occur in other parts of the state with contrasting rainfall projections or in non-urbanised catchments.
The frequency of extreme rainfall events – which can be associated with flash flooding – is also projected to increase in many areas under global warming (). East Coast Lows have been identified as the leading cause of major floods along the south east coast of Australia (). Further, without considering changes in rainfall, increases in coastal flooding are expected due to higher sea levels interacting with higher flood levels.
Bushfires
Bushfires can be extremely destructive and may result in substantial social costs, including the loss of human lives, buildings, infrastructure, native plants and animals, and livestock. Over the last decade, NSW has experienced an increase in the number of dangerous weather conditions for bushfires (). The 'Black Summer' bushfires of late 2019 to early 2020 were exceptionally ferocious, noting that 2019 was Australia’s warmest and driest year on record (). These bushfires caused frequent spikes in air pollution across Sydney (), and across the country caused 429 smoke-related deaths (), burnt over 18 million hectares, destroyed 3113 homes (), and killed 3 billion animals ().
The Forest Fire Danger Index (FFDI) is a commonly used indicator in Australia for fire weather (). The NSW Rural Fire Service (RFS) issues fire weather warnings when the FFDI is forecast to be more than 50. In December 2019, large areas of Australia experienced their highest accumulated FFDI since records began in 1950 ().
All bushfires require an ignition source, and risk factors related to bushfire occurrence include ():
- weather conditions, including high wind speed and temperature, and low relative humidity
- the dryness of the fuel, the type of fuel and the fuel load
- the physical structure of vegetation and the terrain in which the fire is burning
- the effectiveness of fire suppression actions.
The relationship between fire and climate is complex. It involves multiple interacting processes, including both climatic and non-climatic conditions. On average, climate change is making southeast Australia more conducive to bushfires, with:
- an increase in the risk of heatwaves
- longer fire seasons
- trends towards reduced cool season rainfall in the south east and drought indicators
- variations in key climate forces such as the El Nino Southern Oscillation, Indian Ocean Dipole and Southern Annular Mode
- conditions that encourage fire-generated thunderstorms
- in coastal NSW since 1979, an increased number of incidences of dry lightning, which is one of the leading natural causes of bushfire ignition ().
Already, the fire season arrives more than three months earlier than in the mid-twentieth century ().
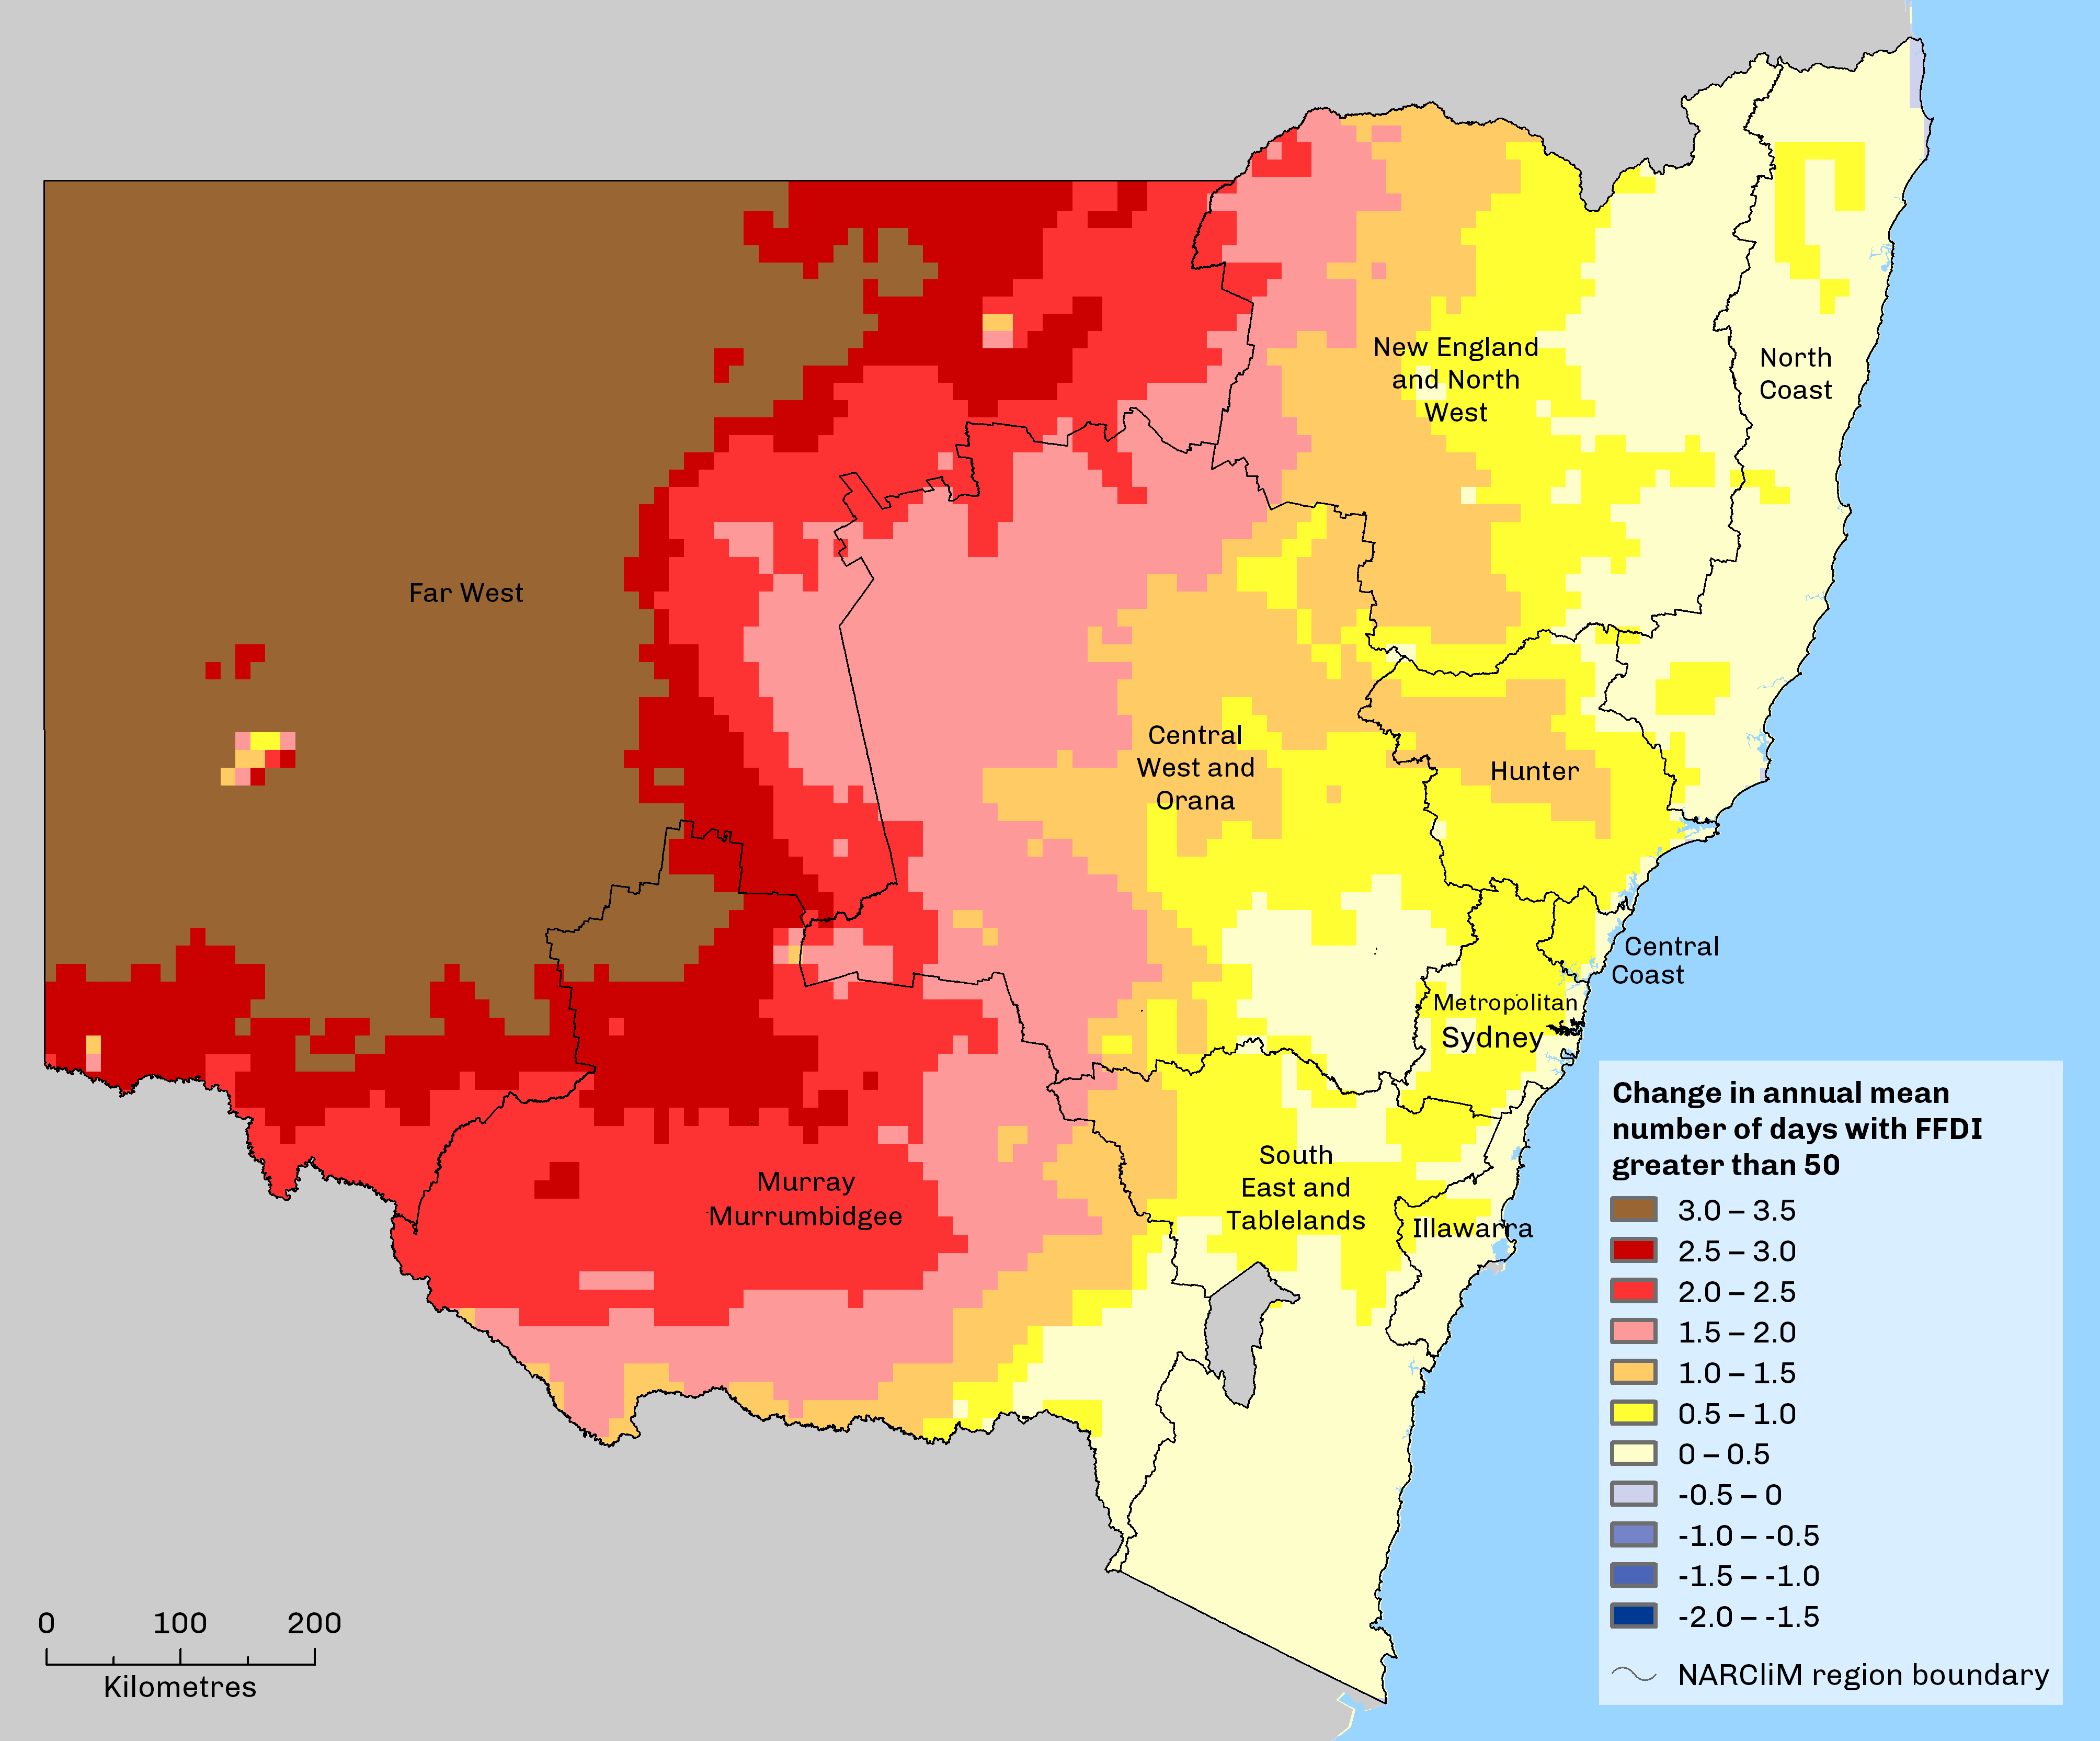
Climate projections for NSW suggest future increases in the frequency of severe fire weather, especially in the state’s west (). Map 21.2 shows the projected change in the average number of severe fire weather days per year between 1990–2009 and 2060–2079. More recent research suggests that fuel loads will also increase in the future (). The bushfire season will extend earlier into spring but severe fire weather in autumn is projected to decrease in eastern NSW due to a projected increase in rainfall.
Map 21.2: Projected increase in average annual number of severe fire days between 1990–2009 and 2060–2079 in NSW using data from NARCliM1.0 and NARCliM1.5 climate simulations
Some of the most intense and damaging bushfires in Australia, or ‘extreme wildfires’ (e.g. the 2003 Canberra fires, the 2009 Black Saturday fires, and some 2019/20 Black Summer) were characterised by widespread flaming areas that generated violent pyroconvection due to favourable atmospheric conditions. This occurs when a fire releases heat and moisture into the lower atmosphere, causing conditions similar to those that drive thunderstorms. This can contribute to the rapid spread and unpredictability of such extreme wildfires ().
Di Virgilio et al. () have shown that the conditions conducive to these extreme wildfires will increase in frequency in south-eastern Australia by the end of the 21st century. These projections indicate that the biggest increases in fire weather conditions will be in late spring, effectively resulting in longer fire seasons that extend earlier into the year. The extension of the season conducive to extreme wildfires into spring is important because extreme wildfires in south-eastern Australia are typically summer phenomena. A change in seasonality therefore has implications for resource allocations by fire agencies such as the NSW RFS.
Land and marine ecosystems and processes
Climate change is projected to alter land and marine ecosystem function. These changes will create feedbacks on regional climates (). For example, as noted above, the cooler months in NSW are expected to be warmer with less precipitation. In the NSW Alpine region, this translates to less snow accumulation (). The resulting decrease in snow cover and albedo will enhance winter warming further. The following sections describe how climate change exacerbates existing risks to biodiversity, ecosystem health, and food systems. The following sections describe ways climate change exacerbates existing risks to biodiversity, ecosystem health and food systems.
Soil health
Soils support the growth of most plant life and are a crucial element of all terrestrial ecosystems. By 2070, changes are predicted in the condition and character of soils due in part to the impacts of climate change. These will need to be considered in the future management of soils and associated agriculture, and the maintenance of native ecosystems in NSW.
Soil erosion affects soil condition, agricultural productivity and water quality. Over the next 20–50 years the erosion rate of soil is predicted to be 7–19% higher due to the effects of climate change. The areas most affected will be mountainous regions of the Great Dividing Range, especially along the Central Coast, North Coast and Hunter Valley ().
Soil organic carbon is a widely used indicator of soil health. This is expected to decline throughout the state due to climate change, resulting in average losses of 10 t/ha (to 1 m depth). In the southern alpine region, losses greater than 20 t/ha are likely (, ). The associated substantial loss of carbon into the atmosphere increases greenhouse gas emissions and makes it harder to achieve net zero emissions by 2050 and reduce the impacts of climate change ().
The pH of soil represents its degree of acidity or alkalinity. Higher pH or more alkaline soils are projected over most the state due to climate change, generally becoming more alkaline from east to west. The largest increases of up to 0.5 pH are expected in the southern alpine areas (, ).
Terrestrial species and ecosystems
As many Australian species are adapted to highly variable climates, they have capacity to cope with limited changes in climate. However, the resilience of many species may have been reduced by pressures on biodiversity which have already resulted in documented declines (see the and topics).
Climate change is expected to exacerbate threats to ecosystems and introduce additional pressures (; ). Scientific studies suggest that over the next few decades, climate change could surpass habitat destruction as the greatest threat to biodiversity (). This impact could be as great as the historical losses of biodiversity that have already occurred in NSW and Australia (). Biodiversity decline due to climate change is already approaching the magnitude of loss experienced in NSW from more than 200 years of non-climate related impacts such as natural resource exploitation, land clearing and introduction of invasive species. These other impacts are likely to continue and will be exacerbated by continued impacts of climate change ().
As the climate changes, the capacity of landscapes to support ecosystems will decline. Many of the most vulnerable ecosystems in Australia are found in NSW and are sensitive to changes in climate. These include:
- ecosystems that only exist at certain elevations, such as alpine systems
- coastal floodplains and wetlands
- the wetlands and floodplains of the Murray–Darling Basin
- temperate eucalypt forests
- saltmarshes and mangroves.
The main threats to these ecosystems are extreme weather events, changes to fire regimes and water balance and hydrology (). Although its true impacts can only be gauged in the coming years, it is likely that NSW has experienced irreversible biodiversity losses from recent drought, extreme temperatures and their culmination in driving the Black Summer (2019–20) bushfires which were extraordinary in terms of scale and severity ().
By 2070, many areas of NSW are projected to become 30–60% less suitable for their present ecosystems, requiring species to either migrate or adapt. Some of the greatest changes are expected to occur across the highly modified landscapes of the wheat–sheep belt, where the capacity to absorb climate change impacts has been diminished.
Many plant and animal species are sensitive to changes in climatic variables, such as temperature, rainfall and humidity. Species identified as the most at risk from climate change include those with:
- a narrow range of physiological tolerances
- low genetic variability and long generation times
- specialised relationships with other species or narrow geographic ranges
- limited physical capacity to disperse or move to new habitats ().
Some species and ecosystems may adapt to the effects of climatic change through a range of strategies, such as:
- evolving or changing their behaviour in their current location
- taking refuge in local areas that are buffered from the changes
- migrating or dispersing to areas where the climate is more suitable.
However, these responses may be constrained by both the increasing rate of climate change and pre-existing threats to biodiversity, such as habitat fragmentation (; ).
Listen to a podcast on one of the ways we can protect plants from climate change (19 minutes)
Ocean acidification
The increase in atmospheric carbon dioxide concentrations is increasing ocean acidity. There has been an observed increase in acidity of ocean waters off NSW since the late 1800s. Elevated atmospheric carbon dioxide and resulting ocean acidification may affect marine organisms through changes to their metabolic physiology and the calcification rates of hard structures such as shells and external skeletons. Acidification will cause losses to species diversity and abundance, with shifts to unusual communities of non-calcifying organisms.
Evidence for the impacts of acidification comes mostly from experimental work on calcifying, stationary animals, which are most vulnerable to ocean acidification (; ). Marine molluscs such as oysters, abalone and whelks are thought to be particularly vulnerable to ocean acidification, especially in their juvenile reproductive stages (; ). Acidification acts with temperature to reduce fertilisation in Sydney rock oysters, resulting in smaller size, longer development times and increased abnormality of larval stages (). Acidification also acts with other pressures to threaten their survival ().
Regular measurements of aragonite saturation state and pH of ocean waters were limited until sampling commenced at National Reference Stations as part of the Integrated Marine Observing System (IMOS) in 2009. Using a combination of recent data and models, a time-series analysis indicated a decline in both aragonite saturation state and pH for Australian temperate waters during 1870–1890 to 2009–2018 (). Ocean acidity is projected to increase, with a further fall in pH by 0.04-0.05 units by 2040 (IPCC) in eastern Australia.
Coastal erosion and inundation
Sea level rise is likely to be one of the most difficult impacts of climate change to manage. The rate of sea level rise is projected to increase, resulting in greater exposure of communities, properties and infrastructure in the coastal zone to inundation and erosion. Low lying properties and infrastructure around the foreshore of rivers and estuaries are particularly vulnerable. The potential implications include:
- higher and more frequent inundation by tides and storm surge events, eventually leading to permanent inundation of low-lying areas
- the landward recession of sandy shorelines
- saltwater intrusion into groundwater aquifers
- the landward advance of tidal limits in estuaries
- changes to the frequency of entrance opening and flooding behaviour of intermittently closed and open lakes and lagoons
- the failure of stormwater infrastructure and sewerage systems.
Image 21.1: Nuisance inundation from high tides, Marks Point, May 2020
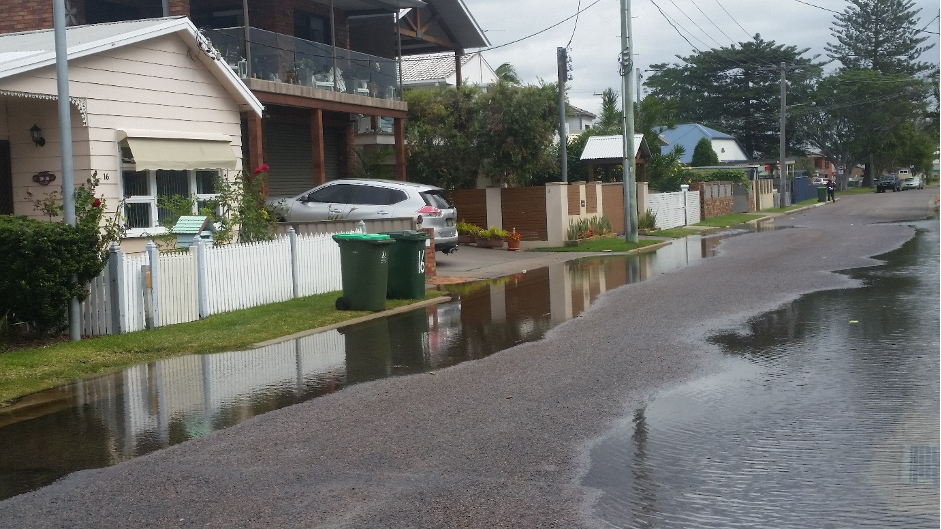
Many sites in NSW are subject to tidal inundation which floods streets and paths during higher tides. This is sometimes referred to as ‘sunny day’ or ‘nuisance’ flooding. The frequency of these events, while variable from year to year, has increased over the last few decades (; ) as sea levels rise.
Considerable development along the NSW coast is exposed to inundation and erosion hazards, and this will increase with climate change. A recent erosion assessment for NSW found approximately 250 property lots where more than half the allotment was subject to coastal erosion. The number of property lots affected by coastal erosion is expected to increase to around 1,860 by 2050, and to around 3,300 by 2100 (; ).
Using the same measure (more than half the property lot), exposure to tidal inundation during king tides currently affects around 600 properties near estuaries in NSW. This is predicted to increase to:
- 4,300 with 0.5 m of sea level rise
- 22,100 with 1m of sea level rise
- 43,300 with 1.5 m of sea level rise (; ).
Nutrients and ocean productivity
Declines in the nutrients available in the water column has implications for the reproduction and growth of the organisms at the base of the food chain including microbes and the phytoplankton. Planktonic microbes are the ocean food chain nutrient recyclers and are, by number, the most common organism on earth. They make up 90% of the mass of organisms in the world’s oceans followed by other types of plankton. A decline in nutrient availability associated with these organisms has implications throughout the food web from the smaller zooplankton, larvae and baitfish up to those at the top of the food chain including sharks, seals, dolphins and whales. In the period 2003 to 2018, ocean waters off NSW experienced a 12.9% decline in mean daily production by microscopic plants (phytoplankton) (). Declines in nutrient concentrations of nitrate, phosphate and silicate over the NSW shelf and Tasman Sea are probably associated with intensification of the East Australian Current (; ; ). The current brings clear warm water south from the Coral Sea into NSW that is low in nutrients. Large spinning ‘eddies’ of ocean water form south of Byron Bay and as they move south, they push or pull water and nutrients to and away from the coast.
North easterly winds that blow onshore during the summer create wind-driven currents that drive warm surface water offshore. The surface water is replaced by water from deeper areas off the continental shelf. This deep water is cold and relatively nutrient rich, and can spike phytoplankton blooms that can be seen from space. In the past 20 years, there has been a decline in volume and abundance of phytoplankton off the coast of Sydney (, ; ) but not in zooplankton (organisms that depend on phytoplankton to survive).
Marine species and ecosystems
The long-term impacts of climate change on ocean warming and acidification are expected to have significant effects on marine species and ecosystems across south east Australia (; ; ).
In general, climate change impacts include changes to:
- the composition of foreshore communities
- the distribution and abundance of marine species, including phytoplankton () and copepods (small or microscopic crustaceans that are a food source for many other species) ()
- the timing of life cycle events
- the physiology, morphology and behaviour of individual species, for example, rates of metabolism, reproduction or development
- the composition of biological communities
- connectivity among populations, species and habitats (; ).
Specific studies have identified that increases in temperature are likely to result in:
- the establishment, spread and virulence of pathogens and exotic species (; ; )
- changes in the range and distribution of harvested species (; )
- changes in the composition, structure and dynamics of communities (; )
- disease in seaweeds (; )
- the poleward contraction of kelp and other macroalgal habitats ()
- a reduction in kelp habitat and associated changes in community composition and ecosystem function, particularly in northern NSW ().
Predictive studies show that changes in the movement of water masses, rather than temperature, will have the greatest potential impact on future distributions of species in NSW waters (), though this is an area that needs further research. Whereas species from tropical and subtropical areas will be able to survive further south in NSW, existing species in those areas will migrate south into Victoria, Tasmania and even further. Some marine organisms will run out of available habitat ().
Socio-economic effects
Climate change poses risks to the socio-economic wellbeing of the people and industries of NSW. At their extremes, climate-driven events like natural disasters can have very significant economic, fiscal and social impacts () – with the 2019–20 bushfire season a high-profile recent example. For communities, livelihoods can be disrupted through damage to homes and other property, services and businesses, impacts on physical and mental health, and in some instances, fatalities (). Costs can be significant, with some impacts still felt months and years after the disaster.
Agriculture, fisheries and forestry
The $15.4 billion (2016–17) NSW primary industries sector operates in one of the most variable climates in the world. Primary industries are already experiencing the effects of climate change, mainly due to rising temperatures, but also due to lower than average winter and spring rainfall in some areas (see Changes in climate section).
Despite operating in an environment of substantial climate variability, the agricultural sector has maintained relatively high rates of productivity. There is still considerable uncertainty about future regional rainfall patterns and the impacts of increasing carbon dioxide concentrations on plant growth, so there will be challenges and opportunities for existing and emerging industries.
The trend towards decreased winter and spring rainfall will generally threaten dryland broadacre crop yields. However, higher carbon dioxide concentrations under climate change may benefit crop growth and could offset some decline in rainfall. The interaction between higher carbon dioxide and lower rainfall levels and increased evapotranspiration (a process transferring water from the ground to the atmosphere) needs to be better understood. Due to lower rainfall and inflows into major water storages, irrigated crops are likely to face reduced water supplies. However, a reduction in the number of cooler days under climate change may benefit major irrigated crops such as rice and cotton, which are sensitive to cool temperatures at key times in their production cycle.
Rising temperatures are likely to pose challenges for horticulture and viticulture. Higher minimum temperatures, for example, are likely to reduce essential winter chill and reduce yields for some fruit and nut crops, such as cherries. Some wineries are reporting that harvesting is now occurring several weeks earlier than in the past and that the climate is becoming too warm to produce good quality crops of some premium grape varieties. Earlier harvesting is also affecting labour and infrastructure capacity as multiple grape varieties need to be picked at the same time.
Climate change is likely to have mixed effects on livestock. While higher carbon dioxide levels may promote pasture growth, higher temperatures and less rainfall at key times will affect the quantity and quality of pasture production and more than offset these gains.
Impacts of climate change will vary with production in higher rainfall/cooler areas of the state more resilient to climate change than lower rainfall/warmer areas. Higher minimum temperatures in winter may reduce stock losses from cold snaps. Conversely, increases in maximum temperatures will increase heat stress and result in decreased animal health and productivity. Warmer temperatures will also influence the geographic distribution and intensity of diseases caused by parasites, potentially increasing pests and diseases.
In the forestry sector, higher concentrations of carbon dioxide are likely to result in increased woody growth rates, but these effects may be counteracted by reduced soil nutrient and moisture levels. There is also more risk of bushfires and damage from pests. Climate change may result in the development of new bioclimatic niches for weeds, pests and diseases, which may lead to increased biosecurity issues for some regions or primary industry sectors.
Increasing temperatures and changes in rainfall patterns will also affect the migration and breeding patterns of freshwater fish, as well as altering their habitat and food sources (). Increasing temperatures will see marine fish species moving to new areas and changing their ranges along the coast. These issues will provide challenges but also opportunities if commercial and recreational fish industries can focus on different species.
Human health
Climate change affects human health and wellbeing. Climate-related risks to health, livelihoods, food security, water supply, human security and economic growth are projected to increase as climate change continues ().
The impacts of climate change make the symptoms of many health conditions worse, with vulnerable groups across the community particularly at risk (). More frequent and intense weather affects health delivery service, with potential increases in visits to emergency departments, hospitalisations and death (, ). These events also affect electricity supply, transport and communication systems, which in turn affect the ability to meet an increased health services demand ().
Studies have identified that increasing temperatures and more frequent and intense heatwaves result in more heat-related symptoms and deaths (see and references). Examples include exacerbation of the symptoms of heart and lung disease (). Increased temperatures also lead to specific effects, for example the urban heat island effect (see Urban heat section).
Climate change has been linked to bushfire weather becoming increasingly frequent and of greater intensity in south eastern Australia (, ), resulting in more days of reduced air quality due to bushfire smoke (). People with asthma and other respiratory conditions, diabetes and cardiovascular illness are most at risk from poor air quality, particularly fine particulate matter (). Climate change can also affect pollen production, leading to worsened respiratory conditions and allergic conditions such as hay fever ().
Climate change and its corresponding events such as floods, heavy downpours and droughts negatively affect mental health, particularly among young people and populations in regional areas. In NSW’s northern rivers region, many residents reported mental health impacts from the 2017 floods (). Farmers and regional communities experiencing decreased productivity and incomes due to drought are at increased risk of depression and suicide ().
Economic and fiscal impacts
In 2019–20, the NSW government spent a record amount on natural disaster relief following the weakest economic output from the agricultural sector in a decade due to prolonged drought and a dramatic and damaging bushfire season ().
Depending on the climate in the future, NSW can expect an increase in the economic impacts of climate change by 2061. Dollar values below are based on modelling conducted by NSW Treasury for the 2021–22 NSW Intergenerational Report which assessed four key physical climate risks ().
Economic impacts could include, by 2061:
- the annual total economic costs of natural disasters to increase to $15.8–$17.2 billion, up from $5.1 billion in 2020–21
- direct economic costs to increase to $2.7–$2.9 billion, up from $870 million in 2020–21
- direct fiscal costs (as measured through annual NSW Government Disaster Recovery Arrangements) to increase to $630–$700 million, up from $200 million in 2020–21
- total economic costs from bushfires to increase to $830 million–$1.01 billion, up from $270 million in 2020–21
- total economic costs from flooding to increase to $7.8–$8.7 billion, up from $2.5 billion in 2020–21
- total economic costs from storms to increase to $5.5–$5.7 billion, up from $1.8 billion in 2020–21.
With regards to the impacts of natural hazards, the NSW Treasury estimates the following by 2061:
- between 39,000 and 46,000 coastal properties will be exposed to coastal erosion and tidal inundation as a result of sea level rise, at a cost of $850 million– $1.3 billion a year
- between 700,000 and 2.7 million additional days of work will be lost due to more and hotter heatwaves
- productivity loss in agriculture will cost $750 million–$1.5 billion from changes in rainfall patterns, runoff and temperatures.
Climate change will also increase the indirect and intangible costs of natural disasters, which already include:
- increased mortality, and decreased physical and mental health – the estimated health costs associated with air quality and smoke from the 2019–20 NSW bushfires were $1.1 billion, including premature death and hospitalisation ()
- destroyed Aboriginal cultural heritage – the 2019–20 bushfires damaged thousands of significant cultural sites representing tens of thousands of years of history ()
- biodiversity and wilderness loss – since 2013, bushfires have resulted in a 39% reduction in the ecological carrying capacity of NSW ()
- loss of business and tourism – there has been a loss of tourism and longer lasting reputational damage, particularly in the south coast region of NSW which was hard-hit by the 2019–20 bushfires.
Pressures
Economic activity
The separation of economic growth (gross state product or GSP) from carbon emissions in the NSW economy over the past 30 years is demonstrated in the topic . Since 1990 there has been a 60% reduction in carbon emissions per dollar of GSP in the NSW economy.
A report for the Australian Business Roundtable for Disaster Relief and Safer Communities () estimated the total economic cost of natural disasters in Australia. For NSW this figure was $3.6 billion per year, on average. By 2050, this is estimated to rise to $10.6 billion. However, this estimate is conservative and excludes climate change from the analysis, so these costs are likely to be much higher (see ).
Population
Over the past five years the NSW population has grown at a rate of 1.4% annually. A higher population leads to an increased demand for food, resources, energy and transport, all of which can increase greenhouse gas emissions. Over the past 10 years, total energy consumption has remained relatively stable, but there has been an overall decline in the per capita consumption of electricity in NSW.
Energy use and transport
The production and use of energy from non-renewable sources is the main cause of greenhouse gas emissions in NSW. Total energy use has fallen slightly over the past 10 years. Fossil fuels currently account for about 93.5% of the final energy use.
Transport is the largest and fastest growing sector for total energy use, at 45%. Electricity use has fallen slightly and accounts for around one-fifth of total energy use. For more information, see the topics and .
Greenhouse gas emissions
The main cause of global warming and climate change is the accumulation in the atmosphere of greenhouse gas emissions from human activities including power generation and use, transport, industry and agriculture.
In NSW, greenhouse gas emissions peaked in 2007 and are now about 25% lower than their 1990 levels. Stationary energy from electricity generation is the most carbon intensive form of energy use and is responsible for the largest proportion of emissions in NSW (49%), while the transport sector accounts for about 20%.
NSW’s (and Australia’s) contribution to total global greenhouse gas emissions is small, but on a per capita basis it is relatively high. In isolation, efforts to reduce emissions will have little impact, so global cooperation is needed to achieve effective reduction and change.
Climate tipping points
The more greenhouse gas build-up in the atmosphere, the greater the risk that a climate tipping point will be triggered (). A tipping point in the climate system is when a critical threshold is crossed in response to global warming, leading to a dramatic and possibly irreversible shift in the climate (). Once triggered, the tipping process may unfold over years to millennia. More than 12 potential global tipping points have been identified which if crossed would have severe impacts on society and the natural environment. Some could potentially affect NSW.
One tipping point that could affect NSW is the potential melting of the West Antarctic and Greenland ice sheets which could raise global sea levels and disrupt natural systems, leading to more monsoons and collapse of the Atlantic meridional overturning ocean circulation (see bullet point two below)
Three other climate tipping points associated with greenhouse gases are ():
- the release of methane from melted permafrost in the Arctic region, which would drastically increase atmospheric greenhouse gas concentrations and sea levels ()
- a collapse of the Atlantic meridional overturning ocean circulation, which influences the global distribution of heat, nutrients and gases, associated with increased fresh water and warming near the ocean surface ()
- deforestation that would permanently damage the rainfall cycle and reduce the ability of forests to absorb greenhouse gases and to sustain local ecosystems (, ).
Given these systems can interact, tipping points can also cascade (). The thresholds for some tipping points may be crossed when global warming increases by 1.5–2°C from pre-industrial times ().
Responses
Two types of actions reduce the effects of climate change:
- mitigation actions limit or reduce the extent of global warming by reducing the levels of greenhouse gas emissions produced by human activity, remove emissions from the atmosphere or remove sources of emissions
- adaptation actions reduce, moderate or adjust to the expected or actual effects of climate change, or take advantage of new opportunities.
This section outlines the key adaptation actions being taken in NSW when global mitigation actions are insufficient. Mitigation actions are described in the Responses section of the and topics.
Because global action is needed for mitigation of climate change to be effective, a balance between mitigation and adaptation strategies is appropriate.
Legislation and policies
NSW Climate Change Policy Framework
In November 2016, the government released its NSW Climate Change Policy Framework with the objectives to achieve net zero emissions by 2050 and make NSW more resilient to a changing climate. The framework articulates the state’s endorsement of the Paris Agreement and sets key policy directions for mitigation and adaptation. For adaptation, directions include:
- taking advantage of opportunities to develop new industries in NSW
- reducing risks and damage to public and private assets in NSW arising from climate change
- reducing climate change impacts on health and wellbeing
- managing impacts on natural resources, ecosystems and communities.
In line with the policy framework, several long-term planning strategies set goals for the government to build the state's resilience to climate impacts and to prepare for changes in the climate.
NSW climate change adaptation strategy and statements
On 29 September 2021 in the Net Zero Plan Stage 1: 2020–2030 Implementation Update the NSW Government committed to develop an adaptation strategy for NSW that sets out the Government’s strategic approach to preparing the State to manage the impacts of climate change. This strategy is currently under development.
In the same announcement the NSW Government also committed to develop and publish biennial climate change impact, risk and adaptation statements which set out the economic, financial and physical impacts, risks and opportunities of climate change on the State across various climate scenarios. The statements will be consistent with the framework established by the Task Force on Climate-Related Financial Disclosures (TCFD) and other relevant international guidance or standards, which will be peer reviewed by an appropriately qualified person, such as an auditor. The statements will be prepared on a whole of Government basis to address the impacts, risks and opportunities of climate change on the NSW Government and the State as a whole. The NSW Government has also committed to pilot entity-specific TCFD statements for the National Parks and Wildlife Service, Environment Protection Authority and Essential Energy.
These two initiatives will help achieve the objective of making NSW more resilient to a changing climate set under the NSW Climate Change Policy Framework.
2021–22 NSW Intergenerational Report
The 2021–22 NSW Intergenerational Report is a snapshot of the future to inform future policies. The report projects 40 years ahead to 2061 to understand ways the State’s population, economy and finances may change based on global and local trends, and current policies.
The report examines key long-term challenges associated with an ageing population, growing expenditure and rapid transformation in the economy, as well as climate change. The aim is to better understand ways that NSW can maintain a modern, diversified economy to ensure continued prosperity. A strong economy, supported by productivity-raising reform, high-quality services and responsible fiscal management will enable the NSW Government to help build the collective wealth of the people of NSW, and create resilience to challenges, shocks and uncertainty.
NSW 2040 Economic Blueprint
The NSW 2040 Economic Blueprint sets the direction for the state’s continued success in a changing world and expanding global economy. Launched by the Treasurer on 20 November 2019, it identifies challenges and risks and highlights major opportunities for the NSW Government to develop industries, innovate and improve the economy.
The report outlines a range of key aspirations for NSW to reach by 2040:
- the nation’s first trillion-dollar economy
- healthy, productive people
- liveable and connected cities
- productive, vibrant regions
- innovative and world class businesses
- a sustainable environment with reliable and affordable energy
- enhanced performance of government.
The report highlights opportunities to build resilience and adapt to climate change across an array of different NSW Government activities.
Design and Place State Environmental Planning Policy
The new Design and Place State Environmental Planning Policy (SEPP) aims to put place shared responsibility to sustain healthy, thriving communities at the forefront of development. The SEPP spans places of all scales, from precincts, large developments, and buildings to infrastructure and public space.
The SEPP includes design requirements around climate change, with an emphasis on design for resilience and sustainability. These new design requirements will help make the built environment more resilient as the climate changes.
The SEPP is planned for final release at the end of 2021.
Future Ready Regions
Future Ready Regions is the NSW Government’s commitment to build strong communities and diversified regional economies that are built to survive drought and thrive as the climate changes.
The strategy identifies 14 commitments to:
- achieve sustainable, secure and healthy water resources
- build stronger primary industries prepared for drought
- support stronger communities and diverse regional economies.
These commitments draw on the lessons learnt from the worst drought on record to help future-proof regional NSW.
This strategy will evolve and adapt over time, with an update planned for 2022 to ensure the NSW Government remains focused on the changing conditions, priorities and needs of regional NSW.
20-Year Economic Vision for Regional NSW
The 20-Year Economic Vision for Regional NSW, released in 2018, sets out the government’s priorities and plans to achieve long-term social and economic success for regional communities across the state. The 2018 vision has been changed in response to the changed economic landscape and opportunities that have emerged in regional NSW following the drought, bushfires, flood and COVID-19 pandemic. The vision covers initiatives that will help build the resilience of regional NSW to climate change.
Strategic planning for natural hazards
Climate change will escalate and intensify certain natural hazards. The NSW Government is committed to building sustainable and hazard-resilient communities through smart land use planning. The Department of Planning, Industry and Environment (DPIE) has developed a draft statewide natural hazards package that encourages councils to consider natural hazard risk in strategic land use planning. With building regulation and emergency management, smart planning can increase community wellbeing and build resilience to natural hazards.
The natural hazards package is currently under development is planned for release in the near future.
NSW Water Strategy and regional and metropolitan water strategies
The NSW Government released its 20-year statewide NSW Water Strategy and 12 regional and two metropolitan water strategies in August 2021. These set out the approach to maintain and build the resilience of the state’s water resources over the coming decades, including in response to climate change.
The strategies address key challenges and opportunities for water management and service delivery across the state and, set the long-term strategic direction for the NSW water sector as the climate changes.
State Infrastructure Strategy 2018–2038
The State Infrastructure Strategy 2018–2038 prioritises making the state’s $300 billion asset base resilient to shocks and stresses such as floods, bushfires and storms. Strategies include:
- improving the collection and sharing of data on natural hazards
- undertaking regular assessments of the vulnerability of assets
- considering natural hazards in land-use planning
- undertaking investment assessments for new and upgraded infrastructure.
Future Transport 2056 Strategy
The Future Transport 2056 Strategy commits to making the transport network more resilient to greater extremes of weather and more frequent extreme weather events.
Greater Sydney Region Plan and Regional Plans
The Greater Sydney Region Plan and Regional Plans for 10 state planning regions across NSW include strategies to minimise the impacts of climate change on local communities. For example, the Greater Sydney Region Plan and accompanying District Plans proposes to strengthen Sydney’s resilience to climate change by increasing the urban tree canopy to reduce the impact of extreme heat and to use energy and water resources more efficiently.
Coastal Management Framework
The NSW Government’s new Coastal Management Framework, which started in 2018, establishes a new strategic land-use planning framework for coastal management. This requires local councils to prepare management programs that consider the effects of climate change on coastal processes. It also includes a Coastal Management SEPP and local planning direction, which requires councils and other planning authorities to consider current and future hazards in strategic planning when assessing coastal development proposals.
State Level Emergency Risk Assessment
The government’s 2017 State Level Emergency Risk Assessment made recommendations to integrate climate change impacts and adaptation mechanisms into emergency management arrangements.
National Climate Resilience and Adaptation Strategy
In October 2021 the Australian Government released the new National Climate Resilience and Adaptation Strategy 2021–2025. This Strategy builds on the first national adaptation strategy released in 2015. The Strategy positions Australia to better anticipate, manage and adapt to climate change.
The strategy sets out what the Australian Government will do to support efforts across all levels of government, businesses and the community, to better anticipate, manage and adapt to the impacts of climate change. The strategy recognises that adaptation is a shared responsibility that requires sustained and ongoing action. It operates across four domains – natural, built, social and economic.
The strategy details three objectives to enable more effective adaptation across Australia:
- Objective 1 - Drive investment and action through collaboration
- Objective 2 - Improve climate information and services
- Objective 3 - Assess progress and improve over time.
The Strategy is expected to support the extensive adaptation efforts already underway in NSW. The NSW Government is currently working with the Australian Government to implement the Strategy
National Drought Agreement
NSW policy on drought is linked to the National Drought Agreement. The agreement builds on drought policy reform and prioritises objectives and outcomes that enhance long-term preparedness, sustainability, resilience and risk management for farms and farming communities in Australia. The agreement describes the way Commonwealth, state and territory governments will cooperate and collaborate on drought-related issues.
National approach to Agriculture and Climate Change
Agricultural ministers committed to a coordinated national approach to addressing climate change in 2019. A work program has been developed to support the agricultural sector in adapting to climate change and managing emissions. The work program will support a collaborative approach between jurisdictions, focused on four priorities:
- delivering information and tools for better decisions and risk management
- driving research and innovation to support adaptation and mitigation
- strengthening market opportunities and business models to build resilience
- preparing for increasing biosecurity risks as the risk of pest, disease and weed incursions change.
A Climate Change Task Group will oversee delivery of the work program and report to AGSOC and Ministers on progress.
Electric Vehicle (EV) Strategy
The NSW Government recently released an EV strategy to make NSW the easiest place to buy and drive an EV in Australia. Under the strategy, the government aims to increase EV sales to more than 50% of new cars sold in NSW by 2030 and for EVs to be the main new cars sold in NSW by 2035. The government is introducing new measures to reduce the upfront cost of purchasing an EV by:
- waiving stamp duty for EVs under $78,000
- providing $3,000 rebates for the first 25,000 EVs sold under $68,750
- offering incentives for medium-sized to large fleet buyers, such as local councils, car hire and car share companies, to purchase EVs.
The NSW Government is also:
- investing $171 million to build a widespread, world-class EV charging network
- incentivising the private sector to build ultra-fast charging stations every 100km along all major NSW highways, every 5km along metropolitan commuter corridors and in areas with limited off-street parking
- installing chargers at public transport sites such as commuter car parks
- providing grants to regional businesses to provide chargers at regional tourist locations.
The government is also deferring the introduction of a road user charge (RUC) for EVs to July 2027 or when EVs make up at least 30% of new car sales. The new RUC will replace stamp duty on EVs and help replace declining revenue from fuel excise, ensuring that the government has the sustainable funding to undertake critical roadwork over the coming decades.
Programs
The NSW Government supports a range of programs that develop, support and provide information and data to inform communities, businesses, State government agencies and local governments about climate change.
NSW Climate Change Fund
The Climate Change Fund was established to address the impacts of climate change, encourage energy and water saving activities and increase public awareness and acceptance of climate change.
It was established in 2007 under Part 6A of the Energy and Utilities Administration Act 1987 and is administered by DPIE. The key programs under the Fund include:
- delivering energy savings and reducing emissions
- delivering reliable, clean and affordable energy
- increasing resilience to a changing climate.
Under the Fund the NSW Government is investing over $900 million between 2017 and 2022 on adaptation and resilience programs. These extensive programs include supporting local communities, protecting our national parks, preparing for bushfires and planting more trees. The Fund supports many of the initiatives outlined in this chapter.
NSW and ACT Regional Climate Modelling project
The NSW and ACT Regional Climate Modelling (NARCliM) project is a world-leading climate modelling program developed in partnership with the ACT Government with contributions from the University of NSW. The first generation of climate data, NARCliM1.0, was released in 2014 and produced climate projections at 10 km resolution for south-east Australia and 50 km resolution over all Australia in 20-year intervals (1990–2009, 2020–2039 and 2060–2079) ().
In 2020, the updated NARCliM1.5 added to the efficiency of the earlier NARCliM1.0 with newer global climate models, expanded continuous projections (1950–2100), and two future scenarios with different levels of greenhouse gas emissions. (RCP4.5 and RCP8.5). Together, NARCliM1.0 and 1.5 provide an improved, more comprehensive data set to measure potential climate change impacts, research adaptation strategies, and develop local policies to mitigate climate change effects ).
DPIE is developing NARCliM2.0, which uses the latest global climate models used by the Intergovernmental Panel on Climate Change assessment report (AR6), and will generate climate projections at finer spatial resolution than previous versions of NARCliM.
NARCliM data has been used in this chapter to inform Spotlight figure 21, Figure 21.5, Figures 21.6–7 and Map 21.2.
To find out how to use NARCliM climate data, email [email protected].
NSW Climate Data Portal
The NSW Climate Data Portal provides NARCliM climate data and data products in various formats, suitable for users ranging from curious citizens and academics to professional and government decision-makers. Data sets cover a broad range of climate variables and are available by greenhouse gas concentration scenario and user-selected extents and time periods. The portal includes tools so users can search, explore and download specific subsets of the data they are interested in. The portal provides data from all available NARCliM scenarios and will include all associated products produced by DPIE including high-resolution downscaled temperature and precipitation data sets and projections of natural hazards under climate change.
AdaptNSW website
The AdaptNSW website provides comprehensive climate change information, analysis and data to support action to address climate change risks and capture opportunities. It includes:
- climate projections
- information on the causes of climate change
- likely impacts on biodiversity, bushfires, east coast lows, heat, sea level, coasts, rivers, soil, water resources, human health, cultural values, built environment and the economy
- information on regional climate change vulnerabilities
- guidance and case studies on implementing adaptive responses to climate change for households, community groups, business and government.
This video is an example of the kinds of projects ADAPT NSW supports (5.30 minutes)
Climate Change Information and Knowledge Delivery Program
The Climate Information and Knowledge Delivery program is helping NSW build resilience to climate change by equipping governments and communities with information, knowledge and the capacity to respond to impacts. In 2020–21, the program continued to increase NSW’s resilience to climate change impacts and natural hazards, by ensuring that:
- decision makers can assess and address the risks of climate change using consistent, integrated and accurate information
- stakeholders better understand sectoral, regional and local risks and opportunities to respond to identified impacts.
Ecosystem Adaptation Program
The Ecosystem Adaptation Program supports NSW land managers to build climate change adaptation into the protection of biodiversity and culture, including:
- working across both publicly- and privately-owned land
- assessing strategic plans for climate change impacts
- providing technical management solutions for threatened species and cultural values.
This program also delivers World Heritage Adaptation Action plans, the Climate Ready Revegetation program and, as lead program, the Marine Estate Management Strategy Initiative 3: Climate change actions.
NSW Aboriginal Culture Adaptation Program
This program is a priority action in the Our Place on Country Aboriginal Outcomes Strategy 2020–23. This strategy includes supporting pilot Aboriginal landholders and their communities in strategic planning for climate adaptation.
Climate Risk Ready NSW Program
The Climate Risk Ready NSW Program aims to increase the capability and capacity of NSW state and local government agencies to respond to increasing climate change impacts. In 2021, through the program, the Climate Risk Ready NSW Guide was delivered and a nationally accredited course with Western Sydney University was launched to build skills in climate change risk assessment and management.
The program continues to deliver policy integration, collaborative governance initiatives and capability building.
XDI (Cross Dependency Initiative) NSW Project
The XDI NSW Project commenced in 2020, following an internationally award-winning pilot project delivered with five asset owners in the Sydney Basin. The scaled up XDI NSW Project provides owners and operators of critical infrastructure in NSW with a tool that:
- supports them in understanding how their assets may be affected by natural hazards and climate change now and in the future
- enables them to make more informed decisions about how to plan and manage their assets
- provides a risk assessment that estimates potential damage, costs, disruption and interdependency with other infrastructure, noting that climate risk assessments will always involve some uncertainty.
Identification interdependencies encourages asset owners to work together on asset management and share costs of adaptation, potentially making considerable savings compared with adapting their own assets and improving the resilience of community service delivery.
Integrated Regional Vulnerability Assessments
Integrated Regional Vulnerability Assessments have been completed for 11 regions across NSW, involving over 1,500 state and local government representatives. These assessments identify ways that climate change can create vulnerabilities in key regional systems through socio-economic and demographic change, and provide strategies to respond through planning and delivering government services. In 2020 the Hunter Central Coast was the last region to complete an assessment.
An adaptation strategy is now being developed to identify priority actions and measures of success that can be monitored and guided by cross-agency regional leadership.
Increasing Resilience to Climate Change
The NSW Government is helping local councils and communities adapt to climate change by investing in programs that help reduce exposure to natural hazards and other climate risks. The Increasing Resilience to Climate Change (IRCC) grants program has:
- provided nearly $1.3 million for 62 councils to implement 21 climate change adaptation projects across the state
- awarded grants across multiple rounds, totalling $3.4 million, to support 54 council and community-led projects to respond locally to the impacts of climate change
- in grant round 1, awarded $615,659 to 23 community groups – between $10,000–$30,000 per project was awarded to help NSW communities increase their resilience and reduce the impacts from climate change.
In 2020–2021, the third and final round of IRCC councils grants awarded $611,700 to eight councils, bringing the total number of projects funded since June 2019 to 31, with a total value of $2,867,230.
These projects are helping local councils and community groups to adapt, foster partnerships and manage climate change impacts by being able to better plan, prepare for, and respond to heatwaves, storms, floods, drought and bushfires.
The grantees will deliver their projects by March 2022.
NSW Climate Change Adaptation Research Hub
Established in 2012, the NSW Climate Change Adaptation Research Hub is a collaboration between leading NSW universities and DPIE. All research was concluded in 2020.
The hub has delivered over 70 research projects that are supporting climate change adaptation across four priority areas:
- biodiversity
- adaptive communities
- coastal processes and responses
- human health and social impacts.
Five Million Trees Program
DPIE is helping to increase the urban tree canopy in Sydney from 16% to 40% by 2036, through the Five Million Trees (5MT) program. The trees will provide more shade, enhanced biodiversity, cooler suburbs and improved thermal comfort for communities to adapt to increasing temperatures and more frequent heatwaves. The 5MT program includes case study sites, pilot projects, community engagement initiatives, a behaviour change project, and grants to enable organisations and communities to plant trees in their local area.
Other programs
Many other natural resource management programs incorporate a consideration of climate change and the development of resilience in their objectives and delivery. These include:
- Enhanced Bushfire Management Program, which is designed to improve hazard reduction and bushfire response capabilities to protect against increasing fire risks due to the impacts of climate change
- private land conservation – the NSW Government has provided $240 million in funding through the Biodiversity Conservation Trust to support willing landholders to manage their land for conservation and increase their resilience to climate change
- protected area management, which supports the delivery of infrastructure and works in NSW National Parks to build resilience to climate change and other pressures and increase awareness of the importance of adaptation
- NSW Forest Monitoring and Improvement Program, which aims to assess the health and stability of soil in forests, and their predicted trajectory into the future, by focusing on actions on to improve soil health and stability – climate change is a major consideration
- The Primary Industries Climate Change Research Strategy, which focuses on the areas of energy, carbon opportunities and climate resilience – research, pilots and trials are providing information on investment opportunities in renewable energy and efficiency, the feasibility of different carbon farming opportunities, and ways climate change will impact on primary industries and digital technology can support adaptation
- Marine Estate Management Strategy – this strategy includes over 100 projects covering planning, programs and research to address key threats to coastal, estuarine and marine ecosystems.
References
Clark AJ, McGowen IM, Crean JJ, Lines-Kelly R & Wang B 2016, Stage 1: Enhanced Drought Information System, NSW DPI Combined Drought Indicator. Technical Report, Australian Government and NSW Department of Primary Industries, Australia
DPIE 2020a, NSW Fire and the Environment 2019–20 Summary, Department of Planning, Industry and Environment, NSW
Drijfhout S, Bathiany S, Beaulieu C, Brovkin V, Claussen M, Huntingford C, Scheffer M, Sgubin G & Swingedouw D 2015, Catalogue of abrupt shifts in Intergovernmental Panel on Climate Change climate models, Proceedings of the National Academy of Sciences, Oct. 2015, vol. 112 (43), pp. E5777–E5786, doi: 10.1073/pnas.1511451112
Evans JP, Ji F, Lee C, Smith P, Argüeso D & Fita L 2014, Design of a regional climate modelling projection ensemble experiment – NARCliM, Geoscience Model Development, vol. 7, pp. 621–29
Field CB, Barros V, Stocker TF and Dahe Q (Eds.) 2012, Managing the Risks of Extreme Events and Disasters to Advance Climate Change Adaptation, Intergovernmental Panel on Climate Change, Cambridge University Press.
Filkov AI, Ngo T, Matthews S, Telfer S, Penman TD 2020, Impact of Australia's catastrophic 2019/20 bushfire season on communities and environment. Retrospective analysis and current trends, Journal of Safety Science and Resilience, pp. 44–56
Hague BS, McGregor S, Murphy BF, Reef R, & Jones DA 2020, Sea level rise driving increasingly predictable coastal inundation in Sydney, Australia, Earth's Future, 8(9), e2020EF001607
Hanslow D J, Fitzhenry MG, Power HE, Kinsela MA & Hughes MG 2019, Rising tides: tidal inundation in south east Australian estuaries, In Proceedings of the Australasian Coasts and Ports 2019 Conference
Hanslow DJ, Morris BD, Foulsham E & Kinsela MA 2018, A regional scale approach to assessing current and potential future exposure to tidal inundation in different types of estuaries, Scientific Reports, 8(1), pp. 1–13
Harvell, CD, Mitchell CE, Ward JR, Altizer S, Dobson AP, Ostfeld RS, Samuel MD. 2002. Climate warming and disease risks for terrestrial and marine biota. Science 296 (5576):2158–2162
IPCC 2019a, Summary for policymakers, In Climate Change and Land: an IPCC special report on climate change, desertification, land degradation, sustainable land management, food security, and greenhouse gas fluxes in terrestrial ecosystems, Shukla PR, Skea J, Calvo Buendia E, Masson-Delmotte V, Pörtner HO, Roberts DC, Zhai P, Slade R, Connors S, van Diemen R, Ferrat M, HaugheE, Luz S, Neogi S, Pathak M, Petzold J, Portugal Pereira J, Vyas P, Huntley E, Kissick K, Belkacemi M, Malley J, (Eds.)
IPCC 2019b, Summary for policymakers, In: IPCC Special Report on the Ocean and Cryosphere in a Changing Climate, Pörtner HO, Roberts DC, Masson-Delmotte V, Zhai P, Tignor M, Poloczanska E, Mintenbeck K, Alegría A, Nicolai M, Okem A, Petzold J, Rama B & Weyer NM (Eds.)
IPCC 2018, Summary for policymakers, In Global Warming of 1.5°C. An IPCC Special Report on the impacts of global warming of 1.5°C above pre-industrial levels and related global greenhouse gas emission pathways, in the context of strengthening the global response to the threat of climate change, sustainable development, and efforts to eradicate poverty, Masson-Delmotte, V, Zhai P, Pörtner HO, Roberts D, Skea J, Shukla PR, Pirani A, Moufouma-Okia W, Péan C, Pidcock R, Connors S, Matthews JBR, Chen Y, Zhou X, Gomis MI, Lonnoy E, Maycock T, Tignor M & Waterfield T (Eds.)
IPCC 2014, Summary for policymakers, In Climate Change 2014: Impacts, Adaptation, and Vulnerability. Part A: Global and Sectoral Aspects, Contribution of Working Group II to the Fifth Assessment Report of the Intergovernmental Panel on Climate Change, Field CB, Barros VR, Dokken DJ, Mach KJ, Mastrandrea MD, Bilir TE, Chatterjee M, Ebi KL, Estrada YO, Genova RC, Girma B, Kissel ES, Levy AN, MacCracken S, Mastrandrea PR & White LL (Eds), Cambridge University Press, Cambridge, pp. 1–32
Ishak E & Rahman A 2019, Examination of changes in flood data in Australia, Water, 11(8), 1734
Ji F, Evans JP, Argueso D, Fita L & Di Luca A 2015, Using large-scale diagnostic quantities to investigate change in East Coast Lows, Climate Dynamics 45(9-10), pp. 2,443–2,453
King AD, Pitman AJ, Henley BJ, Ukkola AM & Brown JR 2020, The role of climate variability in Australian drought, Nature Climate Change
Kinsela MA, Morris BD, Linklater M & Hanslow DJ 2017, Second-pass assessment of potential exposure to shoreline change in New South Wales, Australia, using a sediment compartments framework, Journal of Marine Science and Engineering, vol. 5, p. 61
Lenton TM, Rockström J, Gaffney O, Rahmstorf S, Richardson K, Steffen W, & Schellnhuber HJ 2019, Climate tipping points - too risky to bet against, Nature, 575, pp. 592-595, doi: 10.1038\\d41586-019-03595-0
Lüthi D, le Floch M, Bereiter B, Blunier T, Barnola J-M, Siegenthaler U, Raynaud D, Jouzel J, Fischer H, Kawamura K & Stocker T 2008, High-resolution carbon dioxide concentration record 650,000–800,000 years before present, Nature, vol. 453(7193), pp. 379–82
Malan N, Roughan M & Kerry C 2021, The rate of coastal temperature rise adjacent to a warming western boundary current is nonuniform with latitude. Geophysical Research Letters, 48(3), p.e2020GL090751
McArthur AG 1967, Fire Behaviour in Eucalyptus Forests. Department of National Development Forestry and Timber Bureau, Canberra, Leaflet 107
Nicholls N, Drosdowsky W & Lavery B 1997, Australian rainfall variability and change, Weather, 52(3), pp. 66–72
Nishant N, Evans JP, Di Virgilio G, Downes SM, Ji F, Cheung KK, Tam E, Miller J, Beyer K & Riley ML 2021, Introducing NARCliM1. 5: evaluating the performance of regional climate projections for southeast Australia for 1950–2100. Earth's Future, e2020EF001833
NSW Treasury 2021, TTRP21-05 An indicative assessment of four key areas of climate risk for the 2021 NSW Intergenerational Report, NSW Treasury, Sydney
OEH 2018, NSW Estuary Tidal Inundation Exposure Assessment. Office of Environment and Heritage. ISBN 978-1-76039-958-0 OEH 2017/0635 July 2018
OEH 2017, Coastal Erosion in NSW–Statewide Exposure Assessment, NSW Office of Environment and Heritage, ISBN 978-1-76039-953-5
OEH 2016, Biodiversity impacts and adaptation project–NSW and ACT Regional Climate Modelling Project, Office of Environment and Heritage, Armidale, NSW
Parker LM, Ross PM & O’Connor WA 2010, Comparing the effect of elevated pCO2 and temperature on the fertilization and early development of two species of oysters, Marine Biology, vol. 157, pp. 2,435–52
Parker LM, Ross PM, O’Connor WA, Pörtner HO, Scanes E & Wright JM 2013, Predicting the response of molluscs to the impact of ocean acidification, Biology, vol. 2, p. 651
Pecl GT, Doubleday Z, Ward T, Clarke S, Day J, Dixon C, Frusher S, Gibbs P, Hobday A, Hutchinson N, Jennings S, Jones K, Li X, Spooner D & Stoklosa R 2011, Risk Assessment of Impacts of Climate Change for Key Marine Species in South Eastern Australia. Part 2: Species profiles, Fisheries and Aquaculture Risk Assessment, Fisheries Research and Development Corporation, Canberra, Project 2009/070
Perkins-Kirkpatrick SE & Lewis SC 2020, Increasing trends in regional heatwaves, Nature communications, 11(1), pp. 1–8
Pfahl S, O’Gorman PA & Fischer EM 2017, Understanding the regional pattern of projected future changes in extreme precipitation. Nature Climate Change, 7 (6):423-427
Provost EJ, Coleman MA, Dworjanyn SA, Russell BD, Connell SD, Ghedini G, Gillanders BM, Figuiera W & Kelaher BP 2017, Climate-driven disparities among ecological interactions threaten kelp forest persistence, Global Change Biology, vol. 23(1), pp. 353–61
Qui Z, Coleman MA, Provost E, Campbell A, Kelaher BP, Dalton S, Thomas T, Steinberg PD & Marzinelli E (in review), Future climate change affects the microbiome and condition of habitat-forming kelp
Raupach TH, Martius O, Allen JT, Kunz M, Lasher-Trapp S, Mohr S, Rasmussen KL, Trapp RJ & Zhang Q 2021, The effects of climate change on hailstorms, Nature Reviews Earth & Environment, 2(3), pp. 213–226
Risbey JS, Pook MJ, McIntosh PC, Wheeler MC & Hendon HH 2009, On the remote drivers of rainfall variability in Australia, Monthly Weather Review, 137(10), pp. 3233–3253
Ross PM, Parker L, O’Connor WA & Bailey EA 2011, The impact of ocean acidification on reproduction, early development and settlement of marine organisms, Water, vol. 3, 1005
Scanes E, Parker LM, O’Connor WA & Ross PM 2014, Mixed effects of elevated pCO2 on fertilisation, larval and juvenile development and adult responses in the mobile subtidal scallop Mimichlamys asperrima (Lamarck, 1819), Plos One, e93649
Scanes E, Parker LM, O’Connor WA, Stapp LS & Ross PM 2017, Intertidal oysters reach their physiological limit in a future high-CO2 world, Journal of Experimental Biology, vol. 220(5), pp. 765–74
Schreider SY, Smith DI & Jakeman AJ 2000, Climate change impacts on urban flooding, Climatic Change, 47(1), pp. 91–115
Sharples JJ, Cary GJ, Fox-Hughes P, Mooney S, Evans JP, Fletcher MS, Fromm M, Grierson PF, McRae R & Baker P 2016, Natural hazards in Australia: extreme bushfire, Climatic Change, vol. 139(1), pp. 85–99
Sheffield J & Wood EF 2008, Projected changes in drought occurrence under future global warming from multi-model, multi-scenario, IPCC AR4 simulations, Climate Dynamics 13, pp. 79–105
Sheffield J, Wood EF & Roderick ML 2012, Little change in global drought over the past 60 years. Nature 491(7424), pp. 435-438
Vergés, A, Steinberg PD, Hay ME, Poore AGB, Campbell AH, Ballesteros E, Heck KL, et al. 2014. The tropicalization of temperate marine ecosystems: climate-mediated changes in herbivory and community phase shifts. Proceedings of the Royal Society B: Biological Sciences 281 (1789):20140846
Vergés A, Doropoulos C, Malcolm HA, Skye M, Garcia-Pizá M, Marzinelli EM, Campbell AH, Ballesteros E, Hoey AS, Vila-Concejo A, Bozec YM, and Steinberg PD. 2016. Long-term empirical evidence of ocean warming leading to tropicalization of fish communities, increased herbivory, and loss of kelp. Proceedings of the National Academy of Sciences 113 (48):13791-13796
Wernberg T, Russell BD, Moore PJ, Ling SD, Smale D, Campbell A, Coleman MA, Steinberg PD, Kendrick GA & Connell SD 2011, Impacts of climate change in a global hotspot for temperate coastal biodiversity and ocean warming, Journal of Experimental Marine Biology and Ecology, vol. 400, pp. 7–16
Yang X, Yu B & Xie X 2016, Predicting Changes of Rainfall Erosivity and Hillslope Erosion Risk Across Greater Sydney Region, Australia. Journal of Earth Science and Climatic Change. 7:340. doi:10.4172/2157-7617.1000340