Summary
The overall diversity and richness of native species and communities in NSW remains under threat of further decline.
Why native animals are important
NSW has a rich biodiversity, much of which is recognised as being internationally significant. Shrinking distributions of species of mammals, birds, fish, reptiles and amphibians can indicate early that their populations are decreasing. Declines in population of many species have been under way for decades or longer but have largely gone unrecorded. Over the past three decades, heightened awareness of the plight of native fauna has revealed the extent of population declines and the threats that cause them.
Aboriginal people attribute tremendous spiritual, cultural or symbolic value to many animals, plants and ecological communities, a value that is critical to identity and relationship with Country. The protection of these species and communities is fundamentally important in maintaining Aboriginal culture, language and knowledge.
NSW indicators
| Indicator and status | Environmental trend |
Information reliability |
|
|---|---|---|---|
| Native terrestrial mammals: Loss of long-term distribution over the past 200 years |
|
Stable | ✔ |
| Native birds: Loss of long-term distribution over the past 200 years |
|
Stable | ✔ |
| Proportion of vertebrate fauna species that is presently non-threatened |
|
Getting worse | ✔✔ |
| Birds: Decline in populations – short-term (decades) |
|
Getting worse | ✔✔ |
| Native fish communities |
|
Getting worse | ✔✔✔ |
| Large kangaroos: Population |
|
Stable | ✔✔✔ |
Notes:
Terms and symbols used above are defined in .
Status and Trends
A pattern of long-term decline in biodiversity is seen in the reduced range or abundance of many native vertebrate species. At the same time, many species less susceptible to current pressures have maintained their distributions, while a small number of adaptable species have flourished.
Over the past 200 years, birds have been more resistant to declines in range than mammals, which have experienced substantial declines, especially small- to medium-sized ground-dwelling species. However, over recent decades there is evidence that populations of some bird groups are declining.
Spotlight figure 12: Population health index (PHI) ratings for 28 native fish species in the NSW part of the Murray–Darling Basin in 2014–19
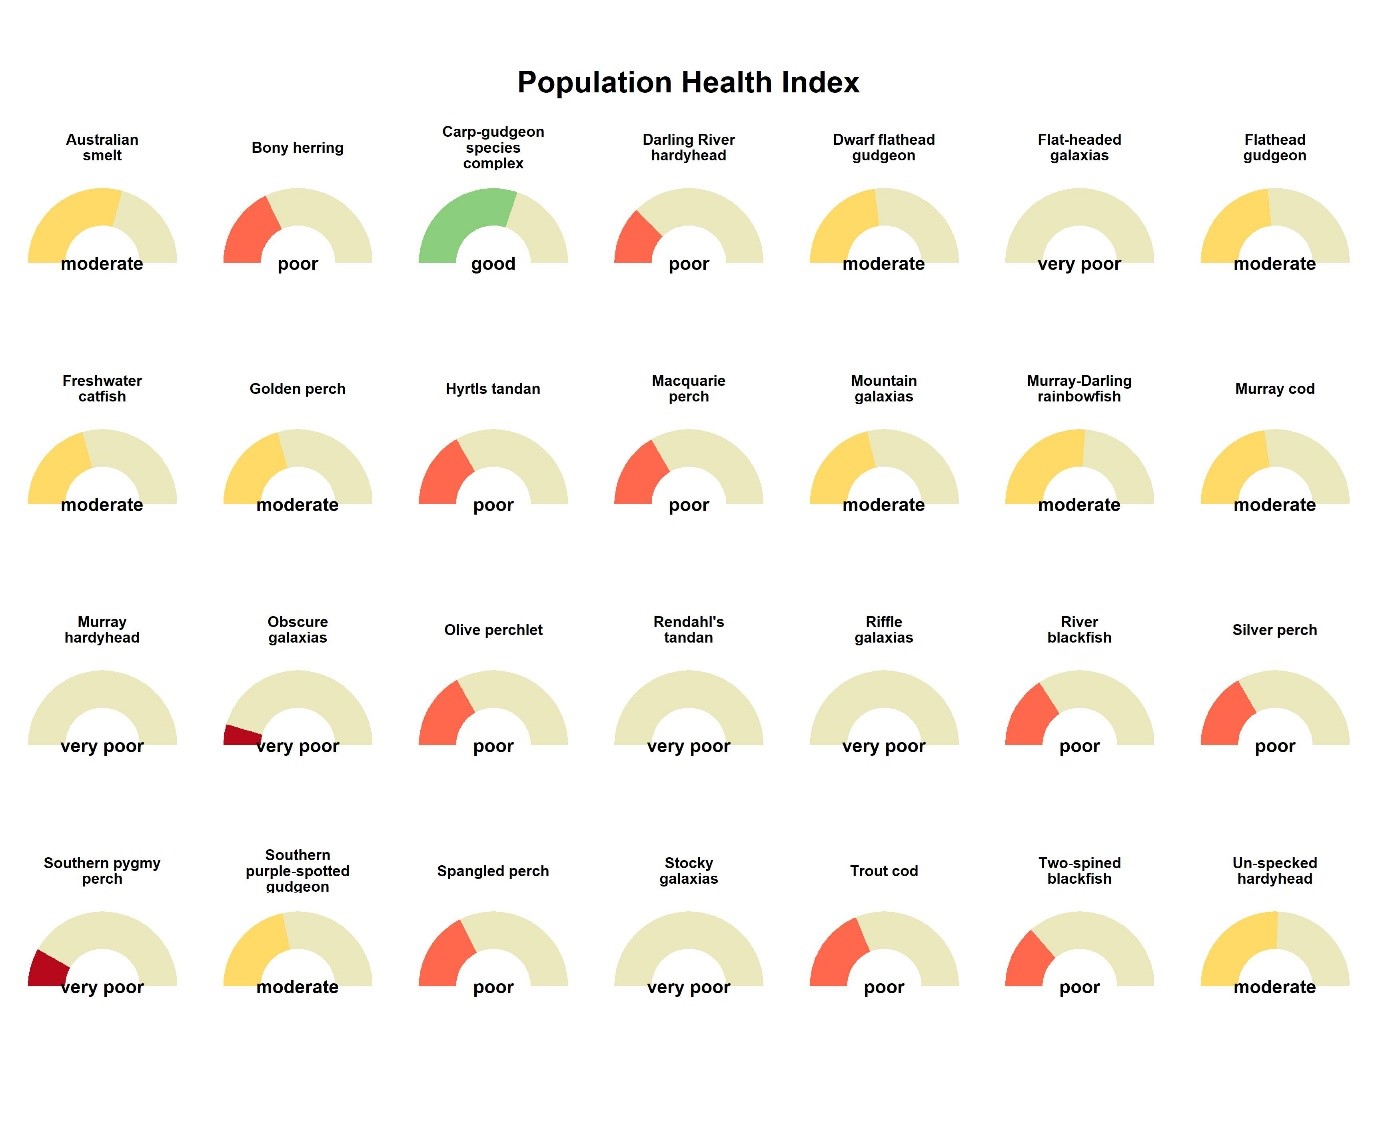
A good population health index (PHI) rating represents an overall improvement in general viability and resilience. In the Spotlight figure, only the carp-gudgeon species complex had a good PHI rating, meaning carp-gudgeons have a stable abundance, an improving distribution and adequate recruitment, and are in good individual condition.
Nine fish species had a moderate PHI rating, representing stable population health. The remaining 16 species (57%) were in poor or very poor population health, reflecting a substantial decline in one or more population health indicators and overall declining viability and resilience.
There are no PHI ratings for coastal fish species due to a lack of monitoring in coastal catchments.
Pressures
The decline in native fauna species is due to the cumulative impacts of threats such as vegetation clearing, habitat degradation and invasive species that prey on native animals and compete with them for habitat. Foxes and cats prey on native fauna on the mainland and introduced rodents affect species’ survival on islands and on the mainland. Climate change is expected to be a major threat to the future survival of many species. Without significant action, climate change is expected to become one of the most significant of all the human induced pressures.
Responses
The NSW Government has streamlined and integrated legislation for biodiversity conservation and protection. The main measures to address the decline in biodiversity are:
- conservation of native species in national parks and other reserves
- the Biodiversity Conservation Trust which funds landowners to manage, protect and conserve biodiversity on private land and through biodiversity offsets
- the Saving our Species program which aims to secure as many threatened species in the wild as possible
- an expanded NSW Biodiversity Offsets scheme to facilitate ecologically sustainable development.
Locally extinct mammals are being reintroduced in carefully managed areas in national parks and reserves kept free of invasive species, with more reintroductions planned for 2021–23 (see ).
There are opportunities to assess longer term impacts of legislative change on threatened species and their natural habitats, and to conserve threatened species on privately-owned land. There are also opportunities to continue to learn more about how Aboriginal cultures and practices improve the care, protection and management of species, their habitats and the overall environment. This includes qualitative data collection, oral stories and Aboriginal cultural knowledge.
Related topics: | | |
Context
Biodiversity refers to the full range of ecosystems, the species and populations they support and the genes they contain. It also encompasses the complex interactions between living organisms and the environment which provide the basis for a range of ecosystem services, and maintain the health and productivity of the land.
NSW has a rich biodiversity, much of which is recognised as being internationally significant.
It is not possible to monitor or report on biodiversity across its breadth () because of the limited data available and the sheer amount of biodiversity to be monitored. Most species are invertebrates or microorganisms, especially bacteria (). The focus of this topic is therefore limited to describing the status of native fauna, in particular land-based vertebrate species (mammals, birds, reptiles and amphibians). See the topic for a description of the status and prospects of native plants and animals listed as threatened in NSW.
A shrinking distribution is often the first indication that a species is declining in numbers. Declines in many species have been under way for decades or longer but have largely gone unrecorded. Over the past three decades, heightened awareness of the plight of native flora and fauna has revealed the extent of many of these declines and the threats that cause them.
For example, the eastern quoll ranged over most of eastern NSW but became locally extinct in the 1960s. Despite recent efforts to locally reintroduce eastern quolls in NSW, the species is currently found only in Tasmania.
In western NSW, 24 species of mammals became locally extinct between European settlement in 1841 and Federation in 1901 (; ).
Much effort has gone into arresting declines that largely occurred before 1995 when the NSW Government recognised the need to formally protect native species. A focus on the extent of declines in species has in some cases overshadowed recent achievements in stabilising declines and recovering some species.
The status of species under threat varies regionally and across Australia. Some species lost from NSW, such as the pig-footed bandicoot, are extinct throughout Australia, while others, such as the numbat, are still found in other parts of Australia. Some species no longer exist on the mainland of NSW but survive on predator-free islands. The brush-tailed rock-wallaby is listed under both the Biodiversity Conservation Act 2016 and the Commonwealth Environment Protection and Biodiversity Conservation Act 1999, but is more threatened in Victoria than NSW. Conversely, the koala is threatened in NSW but not in Victoria, where it is regarded as over-abundant in some areas.
Status and Trends
Long-term historical surveys
Long-term or wide-ranging monitoring of species and ecosystems based on observations in the field provides the best indication of the status and trends in biodiversity for some fauna groups where such data is available. Such data are complementary to new measures currently being developed, which aim to provide indirect estimates of the status of biodiversity based on remote sensing and modelling techniques. However, such techniques will still rely on field-based observations of biodiversity from relatively intact sites for comparison and validation.
Conservation status of vertebrate species
There are few studies available that have looked at data on the distribution and abundance, or the conservation status, of a broad range of native species. The first comprehensive assessment of vertebrate fauna in NSW was undertaken in 1992 () to determine which vertebrate species should be listed as threatened under the then newly introduced Threatened Species Conservation Act 1995 and those which did not require listing.
Most extinctions of native fauna that had occurred in NSW were of small- to medium-sized species of ground-dwelling mammals, including small wallabies, native mice, bandicoots and bettongs (; ). Many of these species inhabited semi-arid shrublands and grasslands in the west of the State (18 extinct species) and most of them had become extinct by the end of the nineteenth century, largely due to predation by foxes and cats and overgrazing by stock. Other factors that may also have contributed to their decline included altered fire regimes and competition with invasive species, such as rabbits and goats, for habitat and food. Rabbits and goats also caused general degradation of habitat.
Nine of the 14 species of birds that are extinct in NSW were previously found only on Lord Howe Island, with introduced rodents and human settlement being mainly responsible for their demise. The other three species were found in central or western NSW.
Historical declines in distribution of reptiles and amphibians has been considered in earlier reporting (see SoE 2009). More recent data on reptiles include and , and for Australian frogs, .
Declines in distribution of vertebrate species
A study (; ) conducted as part of the NSW Natural Resources Monitoring Evaluation and Reporting Strategy 2010–2015 (), used species survey records to provide further evidence that the decline of NSW species was ongoing and concluded that the long-term prospects of survival for many species were poor.
The study described the reduced distributions of native species since European settlement for all species with adequate and reliable data. This assessment used all available data of sufficient quality from species surveys collected rigorously and continuously, but not necessarily systematically, over the past 200 years. It assessed all records in the Atlas of NSW of Wildlife and the Atlas of Australian Birds. Current records (those collected in the past 12 years) were compared to historical records to build up a cumulative record of patterns of distribution over a 200-year timeframe. As these outcomes are only expected to change slowly and over much longer time frames than the present three-year cycle of State of the Environment (SoE) reporting, the results of the 2009 analysis are still relevant.
The outcomes of this analysis were determined for mammals, birds, amphibians and reptiles. Of the 897 species assessed, distributional changes could be estimated with a reasonable level of confidence for about half of the species in each vertebrate group. The results for birds and mammals are shown in Figure 12.1 and Figure 12.2 respectively, illustrating the biggest and smallest losses of range across the four groups assessed.
Figure 12.1: Long-term (200 years) loss of distribution for native birds
Notes:
Presumed extinct – 100% change (contraction) in distribution
Severe decline – 50–<100% change in distribution
Moderate decline – 25–<50% change in distribution
No significant decline – less than 25% change in distribution
n = the total number of species recorded as inhabiting NSW at the time of European settlement, but not including species regarded as ‘vagrants’ (occasional or accidental sightings of species well outside their normal range). Total differs from that used in Figure 12.10.
Figure 12.2: Long-term (200 years) loss of distribution for native mammals
Notes:
Presumed extinct – 100% change (contraction) in distribution
Severe decline – 50–<100% change in distribution
Moderate decline – 25–<50% change in distribution
No significant decline – less than 25% change in distribution
n = the total number of species recorded as inhabiting NSW at the time of European settlement, but not including species regarded as ‘vagrants’ (occasional or accidental sightings of species well outside their normal range). Total differs from that used in Figure 12.10.
Over the longer term, the described outcomes for birds have been much better than for mammals, with only 2% of bird species (12 out of 452) becoming extinct compared with 19% of mammals (26 of 138 species). Only 6% of birds (31 species) have had a reduced range of 50% or more (including extinctions) compared with 29% of mammals (40 species). The range of 64% of all mammal species has decreased.
The data reveals that, historically, birds have been significantly less susceptible to the pressures resulting in range reduction that have affected other terrestrial vertebrates, particularly mammals. If the figures for bird extinctions on Lord Howe Island (where nine of the 11 extinctions occurred), are excluded, the resilience of bird species on mainland NSW is even more pronounced.
Current field surveys
Most current surveys of change in the numbers or distribution of species over time tend to be narrower in scope and more constrained in the numbers of species and the areas surveyed than the long-term historical data described previously. However, the greater accuracy of the data from these surveys is useful to corroborate the findings of the broader long-term surveys by providing supporting information that is more reliable and up-to-date. The outcomes of these surveys are quite variable, demonstrating that different species and groups have different responses to environmental disturbances and pressures. A uniform trend does not apply to outcomes for all species. The surveys are mostly limited to selected mammals and birds, which on their own do not provide a sufficient basis for broader generalisations about outcomes for biodiversity.
Bird surveys
In contrast to the relatively good outcomes for birds recorded over longer time frames, more recent surveys indicate that these outcomes may not be sustainable. Shorter term data on bird populations produced over the previous 15 years shows that the numbers and range of some birds have declined significantly (; ). Populations of woodland birds have declined the most (; ), due to the extensive clearing of woodlands described in the topic and the decline in habitat condition due to the Millennium Drought.
The State of Australia’s Birds
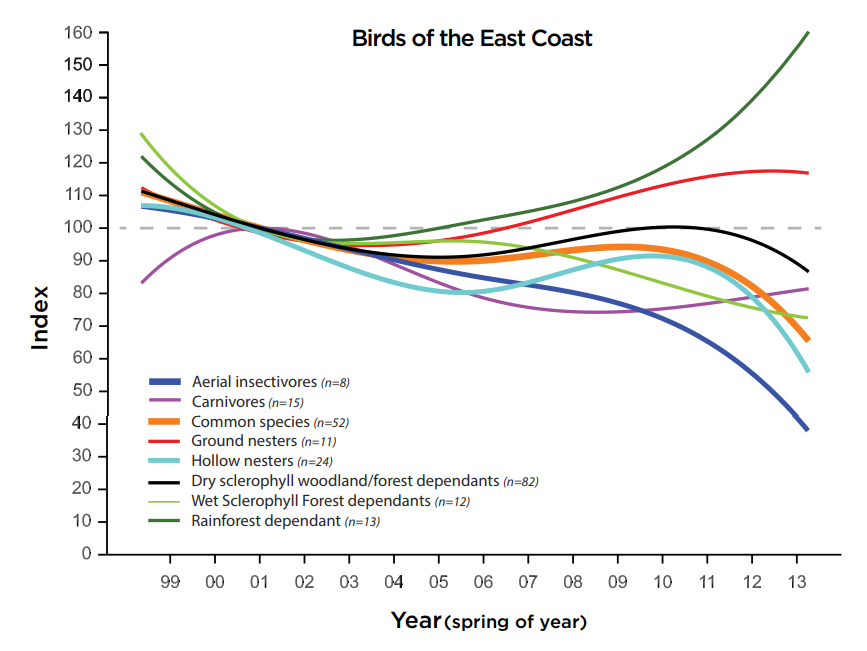
The State of Australia’s Birds 2015 () developed indices for terrestrial birds for various regions and bird groups across Australia. The indices were developed from rigorous scientific analysis of Australia’s largest dataset of bird sightings, collected by thousands of volunteers across the country.
These indices describe average outcomes for different groups of bird species. The results are quite variable across the different regions defined in the study and across groups (). For birds that occur in several regions, quite different trends were often observed – only 10% of 137 species found across three or more regions showed a consistent overall trend.
Much of the east coast and south-east mainland regions are in NSW. Indices for groups of east coast birds did not follow a uniform pattern, with two indices in 2013 well above the 1999 baseline and five below (see Figure 12.3). While the index value for rainforest birds displayed a marked increase, aerial insectivores and hollow-nesting birds showed clear declines. The patterns were less distinct for south-east mainland birds. Four indices were slightly above the baseline level and two slightly below, with differing outcomes observed for individual species in most groups.
More recently, some rainforest habitat in NSW was burnt during 2019, but trends in birds below did not cover these dates.
Figure 12.3: Indices for east coast birds showing increases or declines in range and numbers, 1997–2013
Part of the eastern mallee region is in NSW. All bird indices in this region showed declining values, with the greatest decline in Mallee woodland dependent birds.
Only a small part of the arid zone is in NSW. Four bird indices showed declines in value, while a further two indices remained at around baseline levels.
Threatened Species Index for Australian birds
A collaborative project led by the University of Queensland and Birds Australia is developing a framework for a Threatened Species Index for Australia, based on the Living Planet Index method (). A publicly accessible web visualisation app for birds was launched in November 2009 enabling interpretation of the index and data downloads. The index measures declines in populations of various bird species. Indexes for other groups such as mammals and plants are expected to follow.
To develop the bird index, an aggregated database was compiled with contributions of data from more than 130 government and non-government agencies and citizen science groups. Bird species were grouped into four groups depending on the habitats they prefer to relate trends to the threats in those habitats:
- marine
- shoreline
- terrestrial
- wetland.
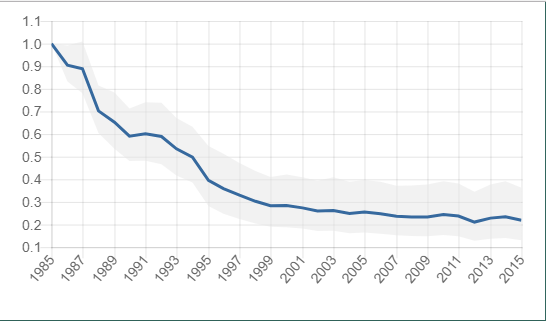
An initial index was calculated for NSW on data for 16 species of threatened and near threatened birds (Figure 12.4). The year 1985 was chosen as the baseline for the overall index, as this is the earliest year for which consistent data are available. The baseline in the first year is set to one and future trends measured against this.
However, great care is needed in interpreting these early results. From the initial baseline set at 1985, the index shows a sharp decline. In 1985, data was only available for about four species of shorebirds known to be strongly declining and this is reflected in the results. The index pattern flattens out from about 2000 when data for about 20 species was available.
Note that:
- it is likely that a decreasing trend would be observed as all threatened species have been listed due to previously observed declines in their populations
- not all species have sufficient data to be included in the analysis, so the index is not fully representative
- for at least some species, more monitoring effort is likely to have occurred at sites where recovery programs are underway.
As more data for more species is added, the index will become more robust in reflecting broader patterns for threatened bird species. Coverage that is more representative of overall outcomes for threatened birds will likely be provided for a shorter period, from a baseline reset to a more recent starting point.
Figure 12.4: NSW index of threatened birds, 1985–2015
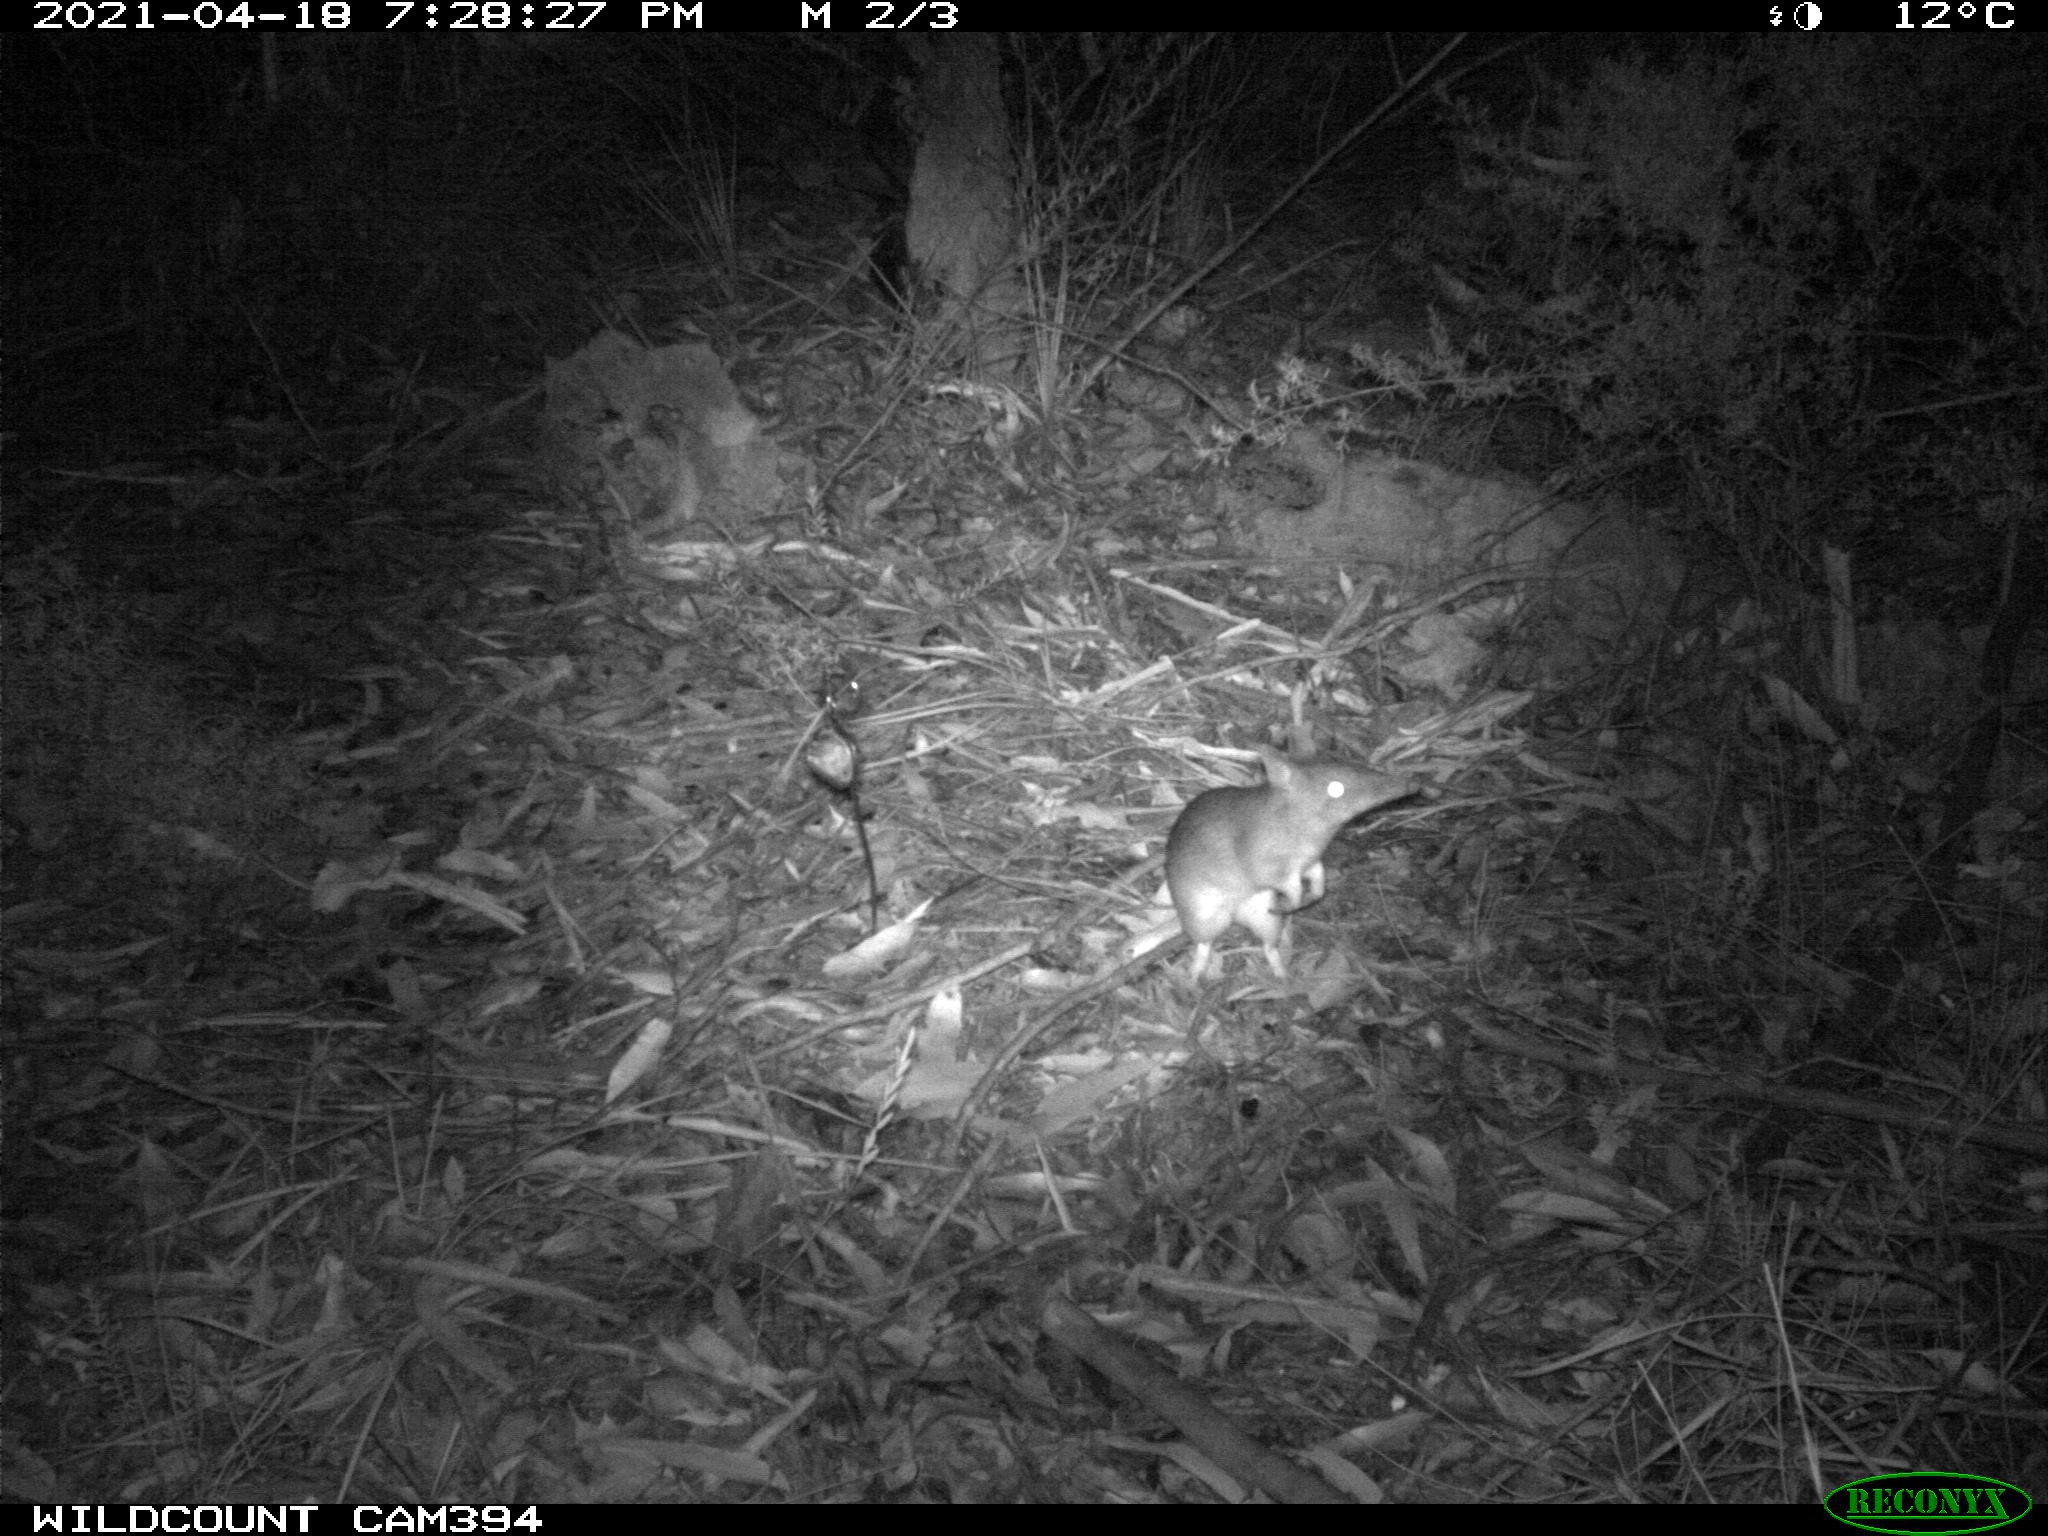
WildCount
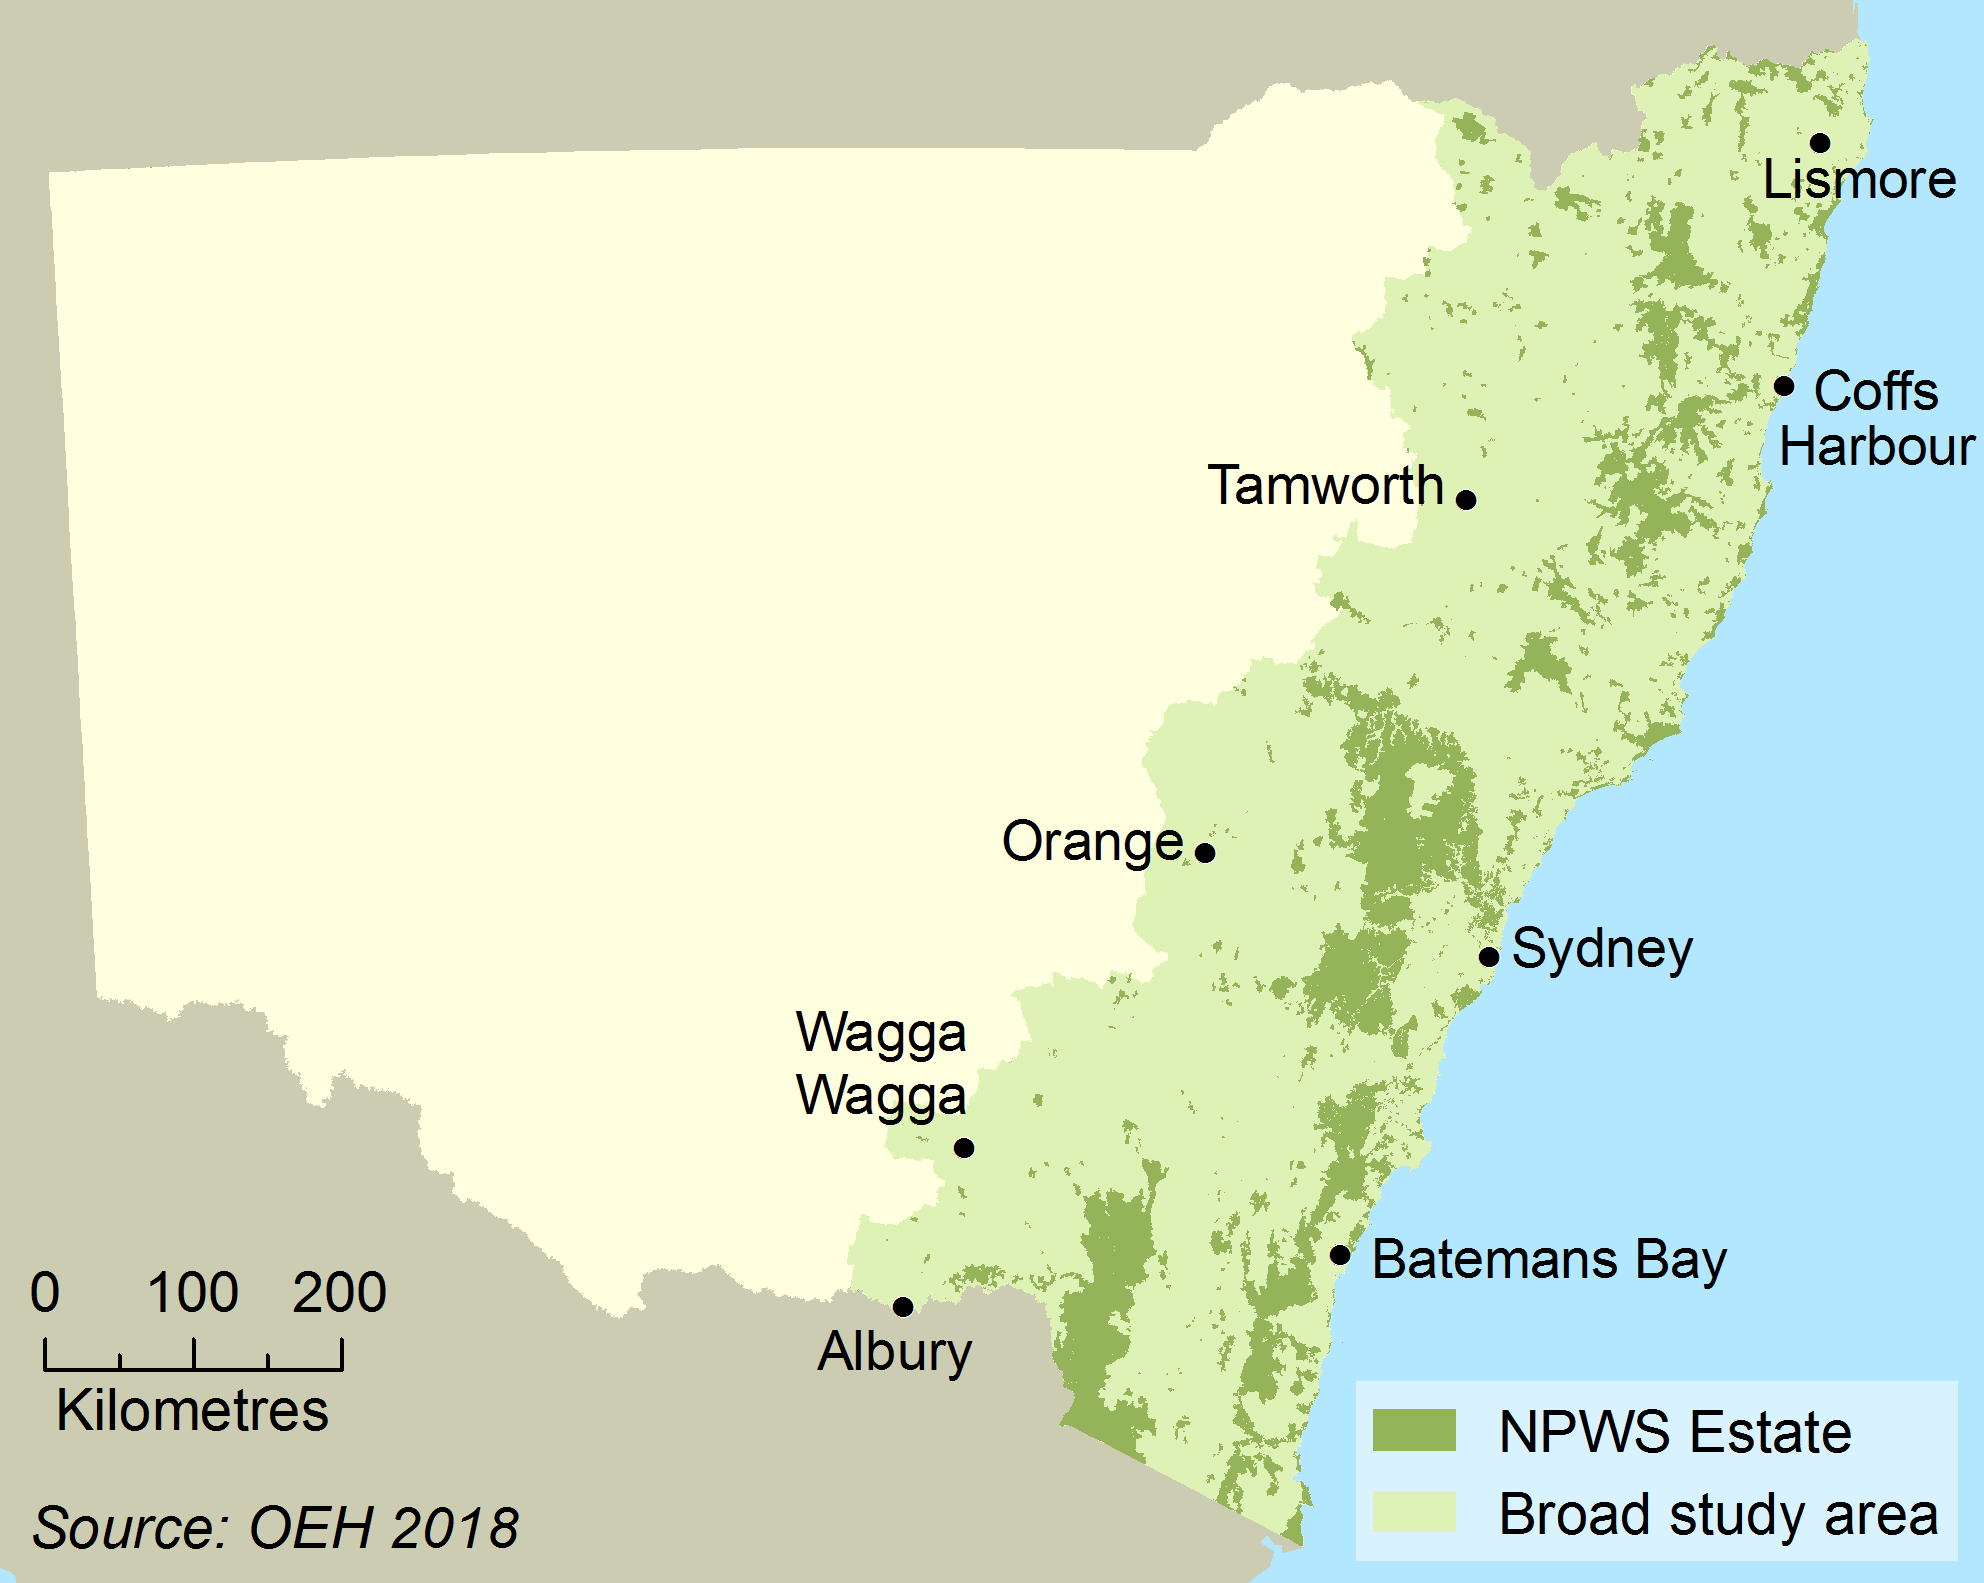
WildCount uses camera-trap technology to capture images on remotely deployed cameras (see Image 12.1) to monitor species’ distribution and occupancy patterns of commonly occurring land-based animals in NSW national parks and reserves. The program is monitoring species trends over 10 years from 2012–2021. Monitoring occurs during autumn at 204 sites in the reserve system across eastern NSW, (see Image 12.2).
Image 12.1: Long-nosed bandicoot captured by WildCount camera
Map 12.1: WildCount study area
The program aims to identify changes in the presence and absence of species so species occupancy can be used as an indicator of abundance and the risk of extinction. Occupancy is an estimate of presence/absence that takes into account the uncertainty of detectability. A report covering the first five–years of the program is publicly available. More recent data are now available for the last five–years of monitoring (2017–2021) but not yet publicly reported. However, 2017–2020 species records are available from Bionet. The program captures approximately 190,000 images of animals every year with about 180 species/taxa identified to date. Around 80% of images from the camera-traps are from just eight species (swamp wallaby, common brushtail possum, eastern grey kangaroo, common wombat, red-necked wallaby, Rattus species, red fox and superb lyrebird).
From the first five years of data, species occupancy models were developed for 39 of the most commonly found species, based on the proportion of sites they occupied. Models were developed for:
- 17 species of native mammals
- 14 species of birds
- 1 reptile
- 7 feral animals.
The models indicated that two species were likely to be declining in occupancy rates – the long-nosed bandicoot and the rabbit; and five species were likely to be increasing in occupancy rates – the mountain brushtail possum, satin bowerbird, spotted quail-thrush, wonga pigeon, and feral pig (Table 12.1). No trend was identified in the other 32 species monitored.
Table 12.1: WildCount species occupancy estimates
| Species | Trend | First (2012) | Last (2016) | Difference | Proportional change (%) |
|---|---|---|---|---|---|
|
Long-nosed bandicoot |
Down | 0.409 | 0.318 | 0.091 | -22.3 |
|
Rabbit |
Down | 0.295 | 0.141 | -0.154 | -52.2 |
|
Mountain brushtail possum |
Up | 0.070 | 0.097 | 0.027 | 38.6 |
|
Spotted quail-thrush |
Up | 0.163 | 0.242 | 0.079 | 48.5 |
|
Wonga pigeon |
Up | 0.208 | 0.319 | 0.111 | 53.4 |
|
Satin bowerbird |
Up | 0.108 | 0.628 | 0.520 | 481.5 |
|
Feral pig |
Up | 0.097 | 0.246 | 0.149 | 153.6 |
For the eight most commonly recorded species, trend models for the period 2016–2020 were developed to see if there had been any changes in occupancy since 2016 across the 204 WildCount sites, with the exception of Rattus species which could not be identified from most images. None of the other seven species showed any evidence of decline.
This is despite the widespread, and sometimes severe impact of the 2020 bushfires. Part of the reason might be that 58% of WildCount sites were not burnt and a further 13% were either lightly or moderately burnt and these may have been serving as refuges. Further analyses are continuing to look at other commonly recorded species and the impact of the wildfires on their distribution and occupancy.
Species occupancy was also modelled for all commonly occurring species as a function of fire severity (0=unburnt, 100=100% of the site severely burnt) from mapping conducted on the bushfires that ravaged eastern Australia in the summer of 2019–20.
There was a varied response to fire severity from analyses of the 2020 data, immediately post-fire. Species such as the long-nosed bandicoot, short-beaked echidna and eastern grey kangaroo were negatively affected by the fires. While the superb lyrebird, bare-nosed wombat, swamp wallabies and common brushtail possums showed no discernible change in occupancy in response to fire severity. The reasons for this variability remain unclear and analyses are ongoing to identify likely causes.
The occupancy model data for the long-nosed bandicoot for the period 2016–2020 are presented in Figure 12.5. After the decline recorded in 2012–16, occupancy across the 204 Wildcount sites has remained relatively stable at around 0.3, meaning that 30% of the 204 sites were occupied by bandicoots. This is despite the widespread occurrence of wildfires in the summer of 2020.
Figure 12.5: Occupancy model for long-nosed bandicoot, 2012–2021
Species co-occurrence models were developed for the long-nosed bandicoot and red fox for 2016 and 2017 (Figure 12.6). Models were not reliable for 2018–2020 (long-nosed bandicoot detections when the red fox invasive species was present were too low to be reliably estimated). Occupancy estimates of long-nosed bandicoot in the absence of foxes were approximately three times the estimates for when foxes were present (0.30 versus 0.10).
Figure 12.6: Co-occurrence model for long-nosed bandicoot and red fox, 2016 and 2017
Figure 12.7: Long-nosed bandicoot occupancy after the 2019/2020 bushfires as a function of fire severity
Notes:
Solid red line is mean occupancy, dashed red lines are upper and lower 95% confidence intervals.
As fire severity increases, the probability of site occupancy decreases for this species. But the relationship gets more uncertain at the higher values of fire severity (as shown by the error estimates, denoted by dashed lines).
Koala Surveys
The NSW Department of Planning, Industry and Environment (DPIE) developed a statewide, cross-tenure koala monitoring framework under the NSW Koala Strategy 2018–21. The framework will support the conservation management of koalas by helping us better understand changes in koala populations and assess the effectiveness of conservation actions
The framework advocates a consistent, best practice approach that will provide reliable information on population trends and indicators of population health.
Another current survey, although not a field survey, is the NSW Community Wildlife Survey which relies on citizen science records from the public that are uploaded online. This is a follow-up to a large NSW postal survey conducted in 2006 ().
In addition, NSW Department of Primary Industries (DPI) and Forestry Corporation of NSW are collaborating on annual occupancy monitoring in state forest and national park, and GPS tracking studies in forestry landscapes. Annual occupancy monitoring in north-east NSW has taken place since 2015 and is revealing a stable trend in the region’s koala meta-population, including after the 2019–2020 fires. DPI has also been deploying acoustic arrays to estimate koala density before and after timber harvesting and the 2019–20 wildfires. Assessments of the fires have shown that the impact of fire on koala density is strongly related to fire severity with little impact after low severity fire, but a large impact after high fire severity. In contrast, selective timber harvesting had little impact on koala density. In conjunction with this, genetic assessments of sex ration have been undertaken using fresh scats to confirm 1:1 male-female sex ratios. The results of this research are currently being peer-reviewed in scientific journals.
Kangaroo surveys
In contrast to most smaller ground-dwelling mammals, the four largest kangaroo species in NSW (the red, western grey and eastern grey kangaroos and the wallaroo) are among the most abundant mammals in the State.
Kangaroo research, monitoring and management have been conducted in the commercial harvesting zones of NSW for 46 years, under the NSW Kangaroo Management Program. This is the longest running field monitoring study of wildlife in Australia.
The population sizes of large kangaroo species in the Western Division of NSW have been estimated by aerial survey every year since about 1975. The Northern Tablelands and south-east NSW regions were added to the monitoring program in 2001 and 2003 respectively, while the Central Tablelands have been monitored since 2010. Tablelands regions are monitored on rotation, once every three years. The aerial survey methods have improved over time, increasing the precision and accuracy of the population estimates.
Figure 12.8 provides a general overview of variation in estimates of total kangaroo population, since 1975. It should be noted that improved survey methods and increases in the area covered by surveys mean that the data is not directly comparable across this timeframe. However, declines in population are largely consistent with periods of drought and population increases follow patterns of increased rainfall.
Figure 12.8: Changes in the estimated population of large kangaroo species in NSW, 1975–2020
Freshwater fish surveys
The status of native freshwater fish communities in NSW has been monitored on an ongoing basis for over 20 years.
Data are collected on:
- nativeness (the proportion of native versus introduced fish)
- expectedness (the presence of native fish species compared to historic distributions)
- the recruitment of juvenile fish.
This monitoring provides what is probably the most complete picture of the distribution and abundance of any group of native species in NSW, as well as insight into the factors that are driving changes in the populations (). The status of NSW fish communities in 2015 is displayed online for all NSW river basins.
An update of the condition of fish communities by river basin in the Murray-Darling Basin is provided in the topic. Ten of the 29 native freshwater fish species found in the NSW area of the Murray-Darling Basin are listed as threatened with extinction under the Fisheries Management Act 1994 (FM Act).
To meet Murray-Darling Basin Plan reporting obligations, a new Population Health Index (PHI) has been developed to compare the relative viability and resilience of individual fish species. PHI provides a consistent means of tracking how native fish populations are responding to long-term conservation interventions like the delivery of future environmental flows.
PHI was calculated for each species by combining four indicators:
- abundance – an indicator of whether the abundance of a species is increasing or decreasing
- distribution –an indicator of ways in which the population of a fish species is spread across the sampling area, and whether they are present where they are expected to occur
- recruitment – an indicator of species breeding success
- condition – an indicator of how healthy individual fish are and whether they show signs of disease or parasites.
Figure 12.9 shows the PHI ratings for 28 native fish in the NSW area of the Murray–Darling Basin for 2014–19.
Only a single taxa, the carp-gudgeon species complex was rated as being in good population health. A Good PHI rating represents an overall improvement in general viability and resilience. For carp-gudgeons, this is a reflection of stable abundance, improving distribution, adequate recruitment and good individual condition.
Nine fish species were rated as being in moderate population health, representing a stable trajectory of population health. The remaining 16 species (57%) were rated as in poor or very poor population health. This reflects a substantial decline in one or more population health indicators, and overall declining viability and resilience.
Due to a lack of monitoring in coastal catchments, population health assessments for coastal fish species are not available.
Figure 12.9. Population Health Index (PHI) ratings for 28 native fish species in the NSW portion of the Murray–Darling Basin for the period 2014–2019.
Surveys of forest-dwelling terrestrial species
A range of ongoing species-specific monitoring programs have been underway in State forest areas for many years. These include monitoring Southern Brown Bandicoot and other critical weight range vertebrates, Smoky Mouse, Giant Burrowing Frog and Yellow-bellied Glider in the Tumbarumba area. A range of flora species are also being monitored. The Natural Resources Commission is also developing a CIFOA monitoring program, with remote sampling devices (ultrasonic sound recorders, sound recorders and cameras), likely to be used to track species occupancy over time.
Overall patterns for species
Species that are not threatened
Where the total number of species in a group is known and there is sufficient information to systematically assess their conservation status, the overall prospects of survival of the group can be calculated by looking at changes in the proportion of species that are listed as threatened over time. This information is available for terrestrial vertebrates (mammals, birds, reptiles and amphibians) and is shown in Figure 12.10.
Of the 903 land-based vertebrate species that inhabited NSW, 664 (or 74%) were not listed as threatened when the Threatened Species Conservation Act 1995 was introduced, following the first assessment of conservation status. By December 2020, this number had declined to 561 or (62%). The deteriorating conservation status of these species reflects the increasing pressures affecting the biodiversity of NSW. Other less well-studied groups are likely to be similarly declining.
Figure 12.10: Changes in the number of vertebrate species not threatened under the Threatened Species Conservation or Biodiversity Conservation Acts, 1995–2020
Notes:
For the purposes of this analysis, ‘vertebrate species’ refers to mammals, birds, reptiles and amphibians listed under the Threatened Species Conservation Act 1995, which was replaced by the Biodiversity Conservation Act 2016.
It does not include fish, which are listed separately under the Fisheries Management Act 1994 or marine mammals about which less is known due to their cryptic lifestyles and habits.
Species with stable populations
Assessments of change in the distribution and abundance of species tend to focus on declines because these are the most common type of change. The topic deals exclusively with species that are declining in numbers as their survival has been assessed to be at risk in the longer term.
However, Figure 12.10 shows that overall, fewer species are considered to be threatened than not threatened. Figure 12.1 also shows that most bird species have not decreased in range over the longer term, although more recent surveys indicate that numbers are decreasing in some habitat types or groups. Even in the case of land-based mammals, when the figures for extinctions are excluded, slightly more species now have stable than declining distributions. Therefore, while many species are declining in numbers and range due to a variety of human-caused disturbances, many others have been less susceptible to pressures and have maintained relatively stable populations.
Some species are more adaptable and can take advantage of human disturbances to create or occupy new local habitat niches, for example:
- brush-tailed possums can live in the roofs of houses
- ibis survive near airport runways or at waste disposal sites
- flying-foxes forage in orchards, or near houses and schools
- kangaroos graze on rural lands.
These species may appear common, as they have adapted to anthropogenic landscapes (landscapes modified by human activity) but overall populations, particularly the grey-headed flying fox population, have declined.
There is also some limited evidence that a few native species may be expanding in numbers or range, but such outcomes are rarely studied and difficult to demonstrate conclusively. In a few instances, species of native freshwater fish such as eel-tailed catfish and climbing galaxias, and native garden plants such as sweet pittosporum and the Cootamundra wattle, have become invasive after being translocated from their natural habitats.
Pressures
Listing of key threatening processes
The biodiversity of NSW is subject to an increasing number and range of threats. The Biodiversity Conservation Act 2016 and the Fisheries Management Act 1994 both list the key threatening processes (KTPs) that impact on listed threatened species.
At 31 December 2020, a total of 47 KTPs were listed for NSW – 39 under the Biodiversity Conservation Act and eight under the Fisheries Management Act. There is some overlap in the threat listings, with climate change, shark meshing and changes to river flow regimes listed under both Acts in slightly different forms.
Table 12.2 summarises the types of KTPs listed. Over half relate to invasive species, with 25 associated with pests and weeds and a further five pertaining to pathogens and diseases. Ten KTPs relate to the clearing and disturbance of native habitat.
One additional KTP has been listed over the latest reporting period: Habitat degradation and loss by feral horses (Equus caballus) Linnaeus 1758.
Table 12.2: Key threatening processes listed in NSW, 2021
| Issue | Number of KTPs |
|---|---|
| Invasive species | 25 |
| Habitat change | 10 |
| Disease | 5 |
| Over-exploitation | 3 |
| Climate change | 2 |
| Altered fire regimes | 1 |
| Pollution | 1 |
| Total | 47 |
Notes:
As at 31 December 2020
It should be noted that not all of these threats are equivalent in effect and the numbers are not necessarily indicative of the cumulative impact of any type of threat. For example, it is expected that over time climate change will become one of the most significant of all the threats described here.
Main threats to biodiversity and threatened species
When a species, population or ecological community is listed as threatened under the Biodiversity Conservation or Fisheries Management Act, the main pressures and threats affecting its conservation status are described in the listing. These threats were analysed for all threatened species listed at the time of analysis under the Threatened Species Conservation Act 1995, the predecessor to the current Biodiversity Conservation Act, to identify those that have the greatest impact on biodiversity and the environment in NSW ().
The pressures affecting the largest number of threatened species in NSW were found to be native vegetation clearing and permanent habitat losses (87%) followed by invasive pest and weed species (70%).
Permanent clearing and habitat destruction
The clearing of native vegetation results in the direct loss of species and destruction of habitat, followed by lag effects due to disturbance from subsequent land uses and the fragmentation of remnant vegetation. This in turn impedes regeneration and the movement of species across the landscape, leading to a loss of genetic diversity (; ).
The decline in habitat condition through clearing and fragmentation is described by three Biodiversity Indicator Program indicators for habitat quality – ecological condition, ecological connectivity and ecological carrying capacity. The baseline level of ecological carrying capacity remaining in 2013 was assessed at 33% of the natural levels before European settlement and 31% in 2020 following the Black Summer bushfires of 2019–20. These indicators are discussed further in the topic and the Biodiversity Outlook Report.
The Land Management and Biodiversity Conservation reforms commenced in August 2017 and theses reforms changed how native vegetation is managed across rural regulated land in NSW. The rate of permanent native vegetation clearing has significantly increased since this time (see the topic). A Rural Boundary Clearing Code was also introduced in September 2021, giving landholders an option to clear certain vegetation within 25 metres of their landholding’s boundary to reduce potential bushfire spread. This may further change the rural vegetation landscape.
Invasive species
Invasive species have contributed to the decline of many native species. Pest animals, particularly foxes and cats, are likely to have had the greatest impact on native fauna and are considered to be responsible for the majority of mammal extinctions on mainland NSW (; ; ). Black rats had a similar effect on endemic bird species on Lord Howe Island, while introduced carp is now the predominant species in most rivers of the Murray–Darling Basin.
Climate change
As many Australian species are adapted to highly variable climates, they are likely to have the capacity to cope with a certain level of climate change. However, the resilience of many species has been eroded by other existing pressures, resulting in the declines in numbers and range described in this and the Threatened Species topic. Climate change is expected to exacerbate the effects of existing threats and introduce additional pressures (; ; ). Climate change is likely to surpass habitat destruction as the greatest global threat to biodiversity over coming decades (). For further information see the topic.
Other threats
Water extraction and altered river flows and cycles affect the critical ecological processes that trigger breeding in a range of aquatic and bird species (see the topic), while altered fire regimes impact the ability of plant species and communities to regenerate or repropagate.
Most of the main threats to biodiversity in NSW are described in greater detail in other sections of this report, including:
- clearing, fragmentation and the disturbance of native vegetation (see )
- the introduction and spread of invasive species – pests, weeds, diseases and pathogens (see )
- lack of groundcover retention such as by overgrazing (see )
- water extraction and changes to river flows (see )
- increasing populations and expanding human settlements (see )
- the increasing impacts of climate change (see )
- altered fire regimes due to European settlement and climate change (see ).
Threats not dealt with specifically in other sections of this report include:
- the indirect impacts of development, particularly in new areas where high rates of mortality and injury to wildlife can occur
- disturbance to behaviour and breeding cycles from infrastructure, noise and lighting ().
It should be noted that many of these threats can operate together to have a cumulative impact and hasten the decline of species and communities. Sometimes these impacts may be synergistic, where the cumulative impact is greater than the sum of the individual pressures (; ; ).
Lack of information
It is unrealistic to expect that a full range of biodiversity could ever be monitored systematically with the resources available. Compared to plants and mammals, there is much to learn of the taxonomy of insects, fungi, and algae. Much of this taxonomic work is done by museum and herbarium-based taxonomists, and is generally underfunded. The ongoing challenge, therefore, is to optimise the collection of the information necessary to manage biodiversity as effectively as possible.
Although knowledge of the conservation status of species has improved markedly over the past 20 years, especially the distribution and abundance of land-based vertebrates, less is known about other groups. Patterns of decline that are likely to have been present for many years are still being discovered in the less well-studied groups of species. For most invertebrates, microorganisms and many plant groups which comprise the vast majority of species, information exists for only a few isolated species and this provides little insight into the broader status and management needs of these groups.
The 2014 Independent Biodiversity Legislation Review panel recommended the development of a comprehensive system for monitoring and reporting on the extent and quality of biodiversity in NSW (). In response, the Biodiversity Indicator Program was established in 2017 to collect, monitor and assess information on the status and trends in biodiversity in NSW. The results of the first NSW Biodiversity Outlook Report were published in February 2020 and are summarised above in this topic and the topic. A Forest Monitoring and Improvement Program (FMIP) established and overseen by the Natural Resources Commission has been established as part of the Regional Forest Agreement renewal process.
Responses
Legislation and policy
Biodiversity Conservation Act 2016
Following the Independent Biodiversity Legislation Review, sweeping reforms were made to the legislative framework for land management and biodiversity conservation, taking effect from August 2017. Biodiversity legislation in NSW was consolidated under the Biodiversity Conservation Act 2016, which replaced the Threatened Species Conservation Act 1995, Nature Conservation Trust Act 2001 and the plant and animal provisions of the National Parks and Wildlife Act 1974. A new rural land management framework was also introduced with the Local Land Services Amendment Act 2016. The framework for regulating impacts on native vegetation from rural land management activities applies a risk-based approach to authorising clearing (see topic for more information). This replaced the Native Vegetation Act 2003, which, as one of its objectives, was put in place to prevent broadscale clearing except where it improved or maintained environmental outcomes.
Protections for aquatic and marine species remain in the Fisheries Management Act 1994. Amendments to the Act are still being progressed to make this legislation consistent with the Biodiversity Conservation Act and the Common Assessment Method for national listing of threatened species.
Policy and guidelines for fish habitat conservation and management
In 2013, an updated policy and guidelines were published to maintain and enhance the habitat of native fish species (including threatened species) in the marine, estuarine and freshwater environments ().
Programs
Saving our Species program
Saving our Species (SoS) is a ground-breaking statewide conservation program that addresses a number of plants and animals in NSW facing extinction. The objectives of SoS are to:
- increase the number of threatened species that are secure in the wild for the next 100 years
- control the key threats facing our threatened plants and animals.
The program is driven by a framework that:
- uses a science-based approach to plan and prioritise the actions needed to conserve each species in the wild for the next 100 years by producing practical management strategies for each site
- provides increased opportunities to work with partners in the community, including the private sector and Aboriginal people, to deliver effective work on the ground
- drives evaluation and transparent public reporting through rigorous monitoring and evaluation that ensures threatened species recovery is driven by the best available science.
Under Saving our Species, every threatened species project falls into one of nine management streams that groups together species based on their ecology and management requirements. Each management stream has a specific objective, performance indicators and a monitoring approach to ensure achievement of outcomes.
The nine management streams are as follows:
- Site-managed species are those for which discrete populations can be geographically defined and critical threats identified and feasibly managed and where mitigation of these threats at a selection of sites is likely to secure the species in NSW in the long term.
- Landscape species are typically widely distributed, highly mobile or dispersed, and best recovered by managing threats associated with habitat loss or degradation at a landscape scale.
- Iconic species: Species in the iconic stream are important to the community socially, culturally and economically and there are high expectations for their effective ecological management. Iconic species, are able to leverage support for SoS from the wider community, through their role as flagship species for the program.
- Partnership species are animals and plants listed as threatened in NSW that have less than 10% of their total distribution in the state. As partnership species occur across state or territory borders, the best way to conserve them is to work with other jurisdictions.
- Data-deficient species: Species are allocated to the data-deficient management stream when there is insufficient knowledge about their ecology, distribution, threats or management needs to inform an effective management strategy. Typically, data-deficient species need investment in targeted research or surveys to fill these knowledge gaps and determine the best approach to on-ground management.
- Keep watch species: The SoS program allocates species to this stream where strong quantitative evidence shows the species populations are secure without targeted investment in management. Strategies for keep watch species include monitoring actions only to ensure populations remain stable or improve and identify potential new and/or emerging threats to the security of the species.
- Threatened ecological communities: An ecological community is a naturally occurring collection of native plants, animals and other organisms occupying a particular area. Where ecological communities are threatened, SoS works to guide stakeholder investment in broad-scale reserve planning, restoration, revegetation, increasing habitat connectivity, private land stewardship and land management, as well as more targeted on-ground activities.
- Key threatening processes are a focal point for SoS as they drive the extinction of species and ecological communities. Some of the most destructive key threatening processes (KTPs) in NSW are pests and weeds, climate change and habitat loss. In managing KTPs, threat abatement is fundamental to ensuring the long-term viability of threatened species and ecological communities.
- Threatened populations: A threatened population is a group of plants or animals of the same species occupying a particular area that is listed in the legislation as likely to become extinct in the near future. Because threatened populations are geographically discrete, critical threats can be managed at priority sites to secure a threatened population in the long term.
For each listed species, ecological community and key threatening process, Saving our Species develops a conservation strategy which lists the critical sites, threats and actions needed to secure a species in the wild. These strategies guide the work on the ground to manage and restore the 369 species, 15 key threatening processes and 40 threatened ecological communities covered by the program.
SoS outcomes are discussed in the Status and Trends section of this topic.
Reintroduction of locally extinct mammals
Since 2016, the NSW National Parks and Wildlife Service has been working with the Australian Wildlife Conservancy (AWC) and the University of New South Wales (Wild Deserts) to reintroduce up to 13 locally extinct mammal species into three national park reserves. The NSW Government has committed $41.3 million over 10 years towards this feral-predator free area partnership project, part of the Saving our Species program.
As part of this project, fenced areas have already been established at Sturt National Park, Mallee Cliffs National Park and the Pilliga State Conservation Area. As of December 2021, feral-free fences are protecting just under 20,000 hectares and eight mammal species have been reintroduced.
On 18 December 2020, the NSW Government announced the establishment of four new feral predator-free areas.
The extended project proposes one of the most significant threatened fauna restoration projects in NSW history, enabling the reintroduction of 28 locally extinct species (23 of them threatened) and delivering a measurable conservation benefit for at least another 30 threatened species which, in turn, will help restore essential ecosystem function and processes (see the topic).
Wildlife licensing
The Biodiversity Conservation Act established a risk-based approach to managing wildlife actions through a tiered framework that:
- permits low-risk activities through Biodiversity Conservation Regulations
- allows moderate risk activities under a code of practice
- ensures high-risk activities will continue to require a licence
- provides for actions that have direct impacts on biodiversity, including threatened species, to be treated as offences under the Biodiversity Conservation Act.
The NSW Government is consulting with stakeholders to identify which actions should continue to require licensing and which should be regulated by codes of practice and regulations.
Identifying areas of outstanding biodiversity value
The Biodiversity Conservation Act 2016 enables the Minister for the Environment to declare Areas of Outstanding Biodiversity Value (AOBVs). These are special areas that contain irreplaceable biodiversity values that are important to the whole of NSW, Australia or globally. The purpose of declaring an AOBV is to identify, highlight and effectively conserve areas that make significant contributions to the persistence of biodiversity. See topic.
Existing areas of declared critical habitat under the repealed Threatened Species Conservation Act (Wollemi pine and little penguin habitats) became AOBVs when the Biodiversity Conservation Act took effect.
Listing of threatened species and communities
The Biodiversity Conservation Act modernised the process for listing threatened plants and animals. It aligns threat categories with international best practice and provides greater coordination between Australian jurisdictions. The Biodiversity Conservation Regulations prescribe criteria for listing threatened plants and animals which align with standards developed by the International Union for Conservation of Nature.
The Commonwealth, state and territory governments agreed to establish a common method for assessing and listing threatened species. In NSW, a Threatened Species Scientific Committee, established under the Biodiversity Conservation Act 2016, is an independent committee of scientists appointed by the Minister for the Environment to consider listing threatened species and communities. For example, the committee assesses the risk of extinction of a species in Australia and determines which species should be listed as critically endangered, endangered, vulnerable or extinct in NSW.
The process of aligning assessment and listing under a common method is ongoing. It will reduce duplication of effort among governments by allowing jurisdictions to adopt successful listing assessments by other jurisdictions and lead to better conservation outcomes for Australia's species.
NSW public reserves system
The public reserves system is the cornerstone of conservation efforts in NSW. It plays a vital role in protecting habitat and provides a refuge for many threatened species that are sensitive to habitat disturbance.
The NSW public reserves system covers around 7.56 million hectares or about 9.4% of the state (see the topic). It conserves representative areas of most habitats and ecosystems and the majority of NSW plant and animal species are found in the public reserve system. The Biodiversity Conservation Act adopted an increased focus on conservation measures on private land to supplement land managed for conservation in the public reserve system.
NSW Koala Strategy
The NSW Government recognises the koala as an iconic threatened species and is committed to stabilising and increasing its populations across NSW. In May 2018, the government released the NSW Koala Strategy, committing $44.7 million towards securing the future of koalas in the wild. The strategy supports a range of conservation actions over three years.
The strategy was a response to the Independent Review into the Decline of Koala Populations in Key Areas of NSW (), which recommended a whole-of-government koala strategy for NSW. An expert advisory committee chaired by the NSW Chief Scientist and Engineer guided the strategy’s development along with extensive community and stakeholder consultation.
Components of the NSW Koala Strategy include:
- $20 million from the NSW Environmental Trust to purchase and permanently conserve land that contains priority koala habitat in the national park estate
- $3 million to build a new koala hospital at Port Stephens
- $3.3 million to fix priority road-kill hotspots across NSW
- $4.5 million to improve the care of sick or injured koalas
- $6.9 million to improve knowledge about koalas, starting with the development of a statewide koala habitat information base
- $5 million to deliver local actions to protect koala populations, including through the Saving our Species program
- $2 million to research impacts of natural hazards and weather events on koalas.
Management and control of invasive species
Once established, the eradication of invasive species is seldom feasible. Therefore, control of some high-priority invasive species, such as foxes and bitou bush, is specifically targeted at sites of high conservation value. Control is delivered through threat abatement plans which facilitate whole-of-government coordination across agencies and local authorities.
Broad-scale rabbit control is being provided through the release of rabbit haemorrhagic disease, while rats, mice and rabbits have been eradicated from some NSW islands. Local Land Services is responsible for identifying priority weeds regionally and developing programs to manage them (see the topic).
Adaptation to climate change
Priorities for Biodiversity Adaptation to Climate Change () was produced in response to the listing of anthropogenic climate change as a key threatening process under the Biodiversity Conservation Act. This identifies priority measures for dealing with the effects of climate change, focusing on four key areas:
- enhancing understanding of the likely responses of biodiversity to climate change and readjusting management programs where necessary
- protecting a diverse range of habitats by building a comprehensive, adequate and representative public reserve system in NSW, with a focus on under-represented bioregions
- increasing opportunities for species to move across the landscape by working with partners and the community to protect habitat and increase connectivity by consolidating areas of vegetation in good condition
- assessing adaptation options for ecosystems most at risk from climate change in NSW.
A key threatening processes strategy has been prepared for the SoS program, that includes adaptation processes in response to climate change following the listing of Climate change as a KTP.
The AdaptNSW website provides comprehensive climate change information, analysis and data to support action to address climate change risks and capture opportunities. It includes information on the causes of climate change and the likely impacts on biodiversity. For further information see the topic.
Future opportunities
Conservation of threatened species outside the reserve system is a field of growing importance. Measures to improve connectivity across landscapes and build the health and resilience of the land will enhance the capacity of species and ecosystems to adapt to, and cope with, disturbance.
More information about the factors contributing to the resilience or success of some native species and processes, in contrast to the declines of many others, may assist in efforts to maintain sustainable populations of flora and fauna species.
The NSW Government will conduct a statutory five-year review of the land management and biodiversity conservation framework commencing in 2022. This will be an opportunity to assess impacts of recent legislative change on threatened species and their native vegetation habitats, and assist in planning future responses and safeguards to protect threatened species and ecological communities.
Monitoring ways in which management actions, particularly those funded through Saving Our Species, increase populations and survival of threatened species, would provide much needed information on best conservation practices.
There is scope to introduce significant qualitative data on Aboriginal cultural species to understand how significant cultural species are faring and ways to care for them and their habitats. Qualitative data collection includes oral stories and knowledge about Aboriginal culture and practises. The EPA Aboriginal Knowledge Group has identified a need for management authorities to learn more and apply how Aboriginal cultures and practices improve the care, protection and management of species, their habitats and the overall environment, and that support for this remerging research and understanding is essential for all aspects of environmental health.
References
Cogger H, Dickman C & Ford H 2007, The Impacts of the Approved Clearing of Native Vegetation on Australian Wildlife in New South Wales, WWF-Australia, Sydney
Mitchell N, Cox N, Bowles P, Tingley R, Macdonald S, Shea G, Keogh JS, Woinarski J and Chapple D 2019, The Action Plan for Australian Lizards and Snakes 2017, CSIRO Publishing, Melbourne, Australia
Morton SR 1990, ‘The impact of European settlement on the vertebrate animals of arid Australia: A conceptual model’, in Saunders DA, Hopkins AJM & How RA, Australian Ecosystems: 200 years of utilisation, degradation and reconstruction, Proceedings of a symposium held in Geraldton, Western Australia, 28 August–2 September 1988, Proceedings of the Ecological Society of Australia, 16, pp. 201–13
Raffaele EA, Veblen TTB, Blackhall MA & Tercero-Bucardo NA 2011, ‘Synergistic influences of introduced herbivores and fire on vegetation change in northern Patagonia, Argentina’, Journal of Vegetation Science, 22(1), pp. 59–71
Simberloff D & Von Holle B 1999, ‘Positive interactions of nonindigenous species: Invasional meltdown?’, Biological Invasions, 1(1), pp. 21–32
Taylor MFJ & Dickman CR 2014, NSW Native Vegetation Act Saves Australian Wildlife, WWF-Australia, Sydney