
Summary
The climate of New South Wales is changing due to global warming. The effects of climate change on the people and the environment of NSW are expected to become more pronounced and increase in severity as warming continues over the next century.
Emissions of CO2 and other greenhouse gases from human activity (including power generation, industry, transport and agriculture) are leading to a build-up of these gases in the atmosphere, trapping heat and leading to global warming.
Average temperatures for the most recent decade (2008 to 2017) are ~1oC higher than late in the last century (1960 to 1990), with 2014 and 2017 reaching up to 1.5oC higher. Other observed changes include increased variability in rainfall and temperature and some increase in the incidence of extreme weather events.
Since the late 20th Century, sea surface temperatures have warmed by 0.5–0.8oC. The rate of sea level rise has almost doubled, increasing from an average of 1.7mm per year for the past century to approximately 3.2mm per year since 1993.
The changes to climate are expected to become more severe over time. Best estimates suggest that by 2070 temperature will have risen by a further 2.1oC with much larger increases in extreme temperatures. Sea levels are expected to rise by a half to one metre by the end of the 21st Century.
The future effects of climate change will be extensive, including more extreme weather events, increasing coastal erosion and inundation and impacts on infrastructure, human health and wellbeing. The survival of many species and ecosystems, water availability and the productivity of some agricultural systems will be affected.
Effective action to counteract the effects of climate change will depend on concerted action globally. The extent of the impacts from this threat will be determined by the actions and the time taken to reduce greenhouse gas emissions.
The NSW Climate Change Policy Framework released in 2016 sets targets for NSW to achieve net zero emissions by 2050 and to become more resilient to a changing climate and sets out directions for adaptation to climate change.
The NARCliM climate modelling project provides projections of likely changes in climate at regional levels of NSW. Integrated Regional Vulnerability Assessments have been completed across NSW to identify specific regional vulnerabilities. The AdaptNSW website provides guidance on implementing adaptive responses.
Related topics: Economic Activity and the Environment | Energy Consumption | Greenhouse Gas Emissions | Transport
NSW indicators
| Indicator and status | Environmental trend |
Information reIiability |
|
|---|---|---|---|
| Annual mean temperature (present) |
|
Getting worse | ✔✔✔ |
| Sea level rise (present) |
|
Getting worse | ✔✔✔ |
| Rate of temperature warming |
|
Stable | ✔✔✔ |
| Annual mean temperature (2070): projected outcomes |
|
Getting worse | ✔✔ |
| Sea level rise (2070): projected outcomes |
|
Getting worse | ✔✔ |
Notes:
Terms and symbols used above are defined in How to use this report.
Context
A natural greenhouse effect has been warming the Earth for some 4 billion years, keeping it habitable for life. Energy radiated by the Sun passes through the atmosphere and reaches the Earth’s surface relatively unimpeded. Some is absorbed by oceans, soils and vegetation. The rest is either reflected or re-radiated as infrared radiation (heat). This radiation is less able to pass through the atmosphere and is partly trapped by naturally occurring greenhouse gases in the atmosphere, including carbon dioxide, methane, water vapour, nitrous oxide and ozone.
The temperature of the Earth has not been constant over time. Global temperatures and atmospheric greenhouse gas concentrations have fluctuated naturally over the millennia. Climate change is therefore not a new phenomenon. The difference between a planetary ice age and a warm interglacial period is a variation in global average temperature of 6–7°C. Temperature changes of this scale can lead to substantial disturbance of the world’s climate and ecosystems and have triggered mass extinctions in the past. (IPCC 2007b).
However, these natural cycles of change have taken place gradually over millennial timeframes. Since the start of the industrial age in about 1750 the burning of fossil fuels (coal, oil and gas) together with land-use changes, agriculture and other human activities, have resulted in growing emissions of greenhouse gases. This is leading to an accumulation of these gases in the atmosphere. From the middle of the 20th Century these emissions have escalated markedly. The rates of increase now being observed in the atmospheric concentrations of greenhouse gases and consequentially in temperature are unprecedented in the past 800,000 years (Lüthi et al. 2008).
The Intergovernmental Panel on Climate Change (IPCC) is a United Nations body that assesses the latest scientific research on climate change and its effects from around the world. The IPCC has published five comprehensive assessment reports to date, the most current being the Fifth Assessment Report in 2014 (IPCC 2014).
Key findings include the following:
- warming of the climate is unequivocal, and since the 1950s, many of the observed changes are unprecedented over decades to millennia
- human influence is clear and is the dominant cause of global warming since 1950.
Without substantial action, climate change poses a major threat to humanity and most living systems on Earth. While impacts are being observed now, they will become more pronounced over time. Some extreme climate events are projected to increase in duration, magnitude and frequency in the future with impacts on human communities and infrastructure.
Sea level rise is expected to lead to increased erosion of coastlines and more frequent and extensive coastal flooding. In the longer term, permanent inundation of low-lying coastal areas is likely. Ocean warming and acidification due to increased levels of carbon dioxide dissolved in seawater will lead to changes in the composition of marine ecosystems.
Climate conditions are likely to become less favourable for many species and ecosystems, which will be forced to migrate or adapt physiologically to survive. Changes in climate will also lead to reduced productivity in some existing agricultural systems, requiring a transition to alternative crops or shifting the location of some industries. Detrimental effects are also expected on human health and wellbeing.
In 2016, a total of 194, or 98% of nations, signed the Paris Climate Agreement, which has a focus on limiting global warming to well below 2°C and aims to limit it to 1.5°C. Each country has pledged to make national contributions to reducing greenhouse gas emissions. But presently, concentrations are continuing to rise at rates that will see temperatures increase above the Paris Agreement targets. Cuts in emissions well beyond those already pledged under the agreement will be necessary to meet the target. The extent of the impacts of climate change will ultimately be determined by the actions taken by nations globally to reduce greenhouse gas emissions.
Status and Trends
Changes in climate
Temperature
Temperatures are rising across the planet due to global warming, caused by the build-up of greenhouse gases in the atmosphere. The global average temperature in 2017 was the second highest on record since pre-industrial times (before 1850). The same year was Australia’s third hottest on record, and the hottest for NSW (BoM 2017).
In Australia and NSW, average temperatures over the past decade show a rise faster than the global average of 0.82oC, with temperatures now 0.95oC for Australia and 0.99oC for NSW, above their late 20th Century averages (BoM 2017).
Figure 21.1 shows model simulations of temperature for Australia using solely natural atmospheric drivers (e.g. solar and volcanic) in blue shading and those including all atmospheric drivers (e.g. natural drivers, greenhouse gases and ozone) in pink shading and compares these to observed temperature trends (black curve).
Figure 21.1: Climate model mean projections for temperature averaged over Australia
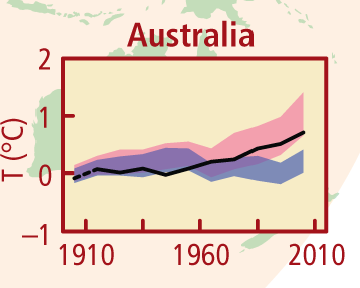
Natural forcing alone does not account for the observed temperature trends. The observed build-up in greenhouse gases is needed to explain the observed increases in Australian temperatures.
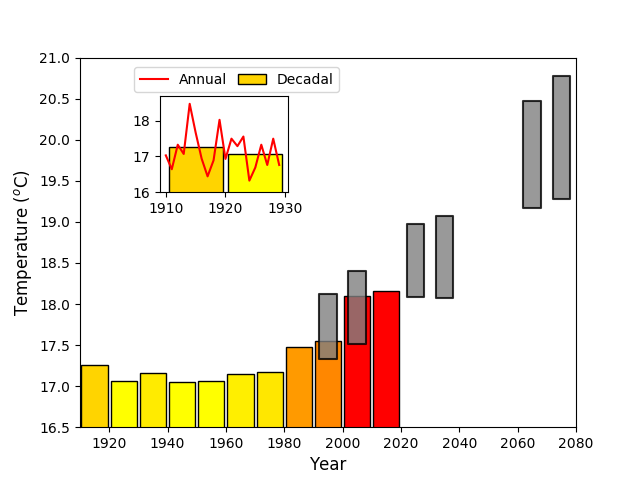
Temperatures in NSW vary from year to year, but since the 1960s there has been a warming trend in NSW, with the average temperature of every decade being warmer than the previous decade (see Figure 21.2).
Figure 21.2: Measured and projected average temperatures for NSW/ACT for selected decades in the 20th and 21st centuries
Notes:
Grey bars represent the range of temperatures projected by regional climate models adjusted to the observed 1990–2009 BoM data).
The final BoM decadal average presented is only for the period 2011–2017.
Inset: The temperature varies from year to year within each decade. The first two decades of the BoM data, shown as decadal averages (yellow columns) and annual averages (red lines), illustrate year-to-year temperature variability.
This warming will continue in the future, with the amount dependent on how much reduction has occurred in global emissions. By 2030, average NSW/ACT temperatures are projected to rise by 0.7oC above the 1990–2009 period, with a 2.1oC increase expected by 2070 (OEH 2014) (Figure 21.2). This is the mean increase projected across regional climate models for a high-emissions scenario that assumes the Paris Agreement will fail to achieve its target. These changes may be mitigated if significant action is taken to reduce greenhouse gas emissions by the second half of the 21st Century.
By 2070, the temperature increase over the early 20th Century average will be 2.6 oC.
The nation is also experiencing new record high temperatures on a regular basis. In early April 2018, NSW and other states experienced record high temperatures for April, with inland NSW temperatures unusually exceeding 30oC (BoM data 2018).
Inland NSW currently experiences around 80 hot days (temperatures reaching over 35oC) annually, with coastal NSW experiencing fewer than 10. The number of hot days across NSW has been increasing since the mid-20th Century, with a decrease in the number of cold nights (temperatures dropping to less than 2oC overnight).
By 2030, the number of hot days for inland NSW is projected to increase by 10–20 days annually, with an increase of over 40 days annually by 2070. Meanwhile, by 2030, cold nights in the Snowy Alpine regions will decrease by 5–10% and by 2070, by almost 20%.
Significant temperature changes have been observed along the NSW coastal and marine waters. Since 1950, average sea surface temperatures in NSW coastal waters have increased by 0.13oC each decade (BoM & CSIRO 2016).
Climate change predictions for NSW include higher sea surface temperatures (potentially by up to 4°C by 2070), more frequent and powerful storms and stronger currents that affect nutrient distribution and impact ecosystems (Hobday et al. 2006; Hobday & Lough 2011, Wernberg et al. 2011).
Sustained ocean surface warming over periods of months to years of 2 to 4oC above average (termed ‘marine heatwaves’) has been observed in south-east Australian coastal waters and other coastal regions globally (Oliver et al. 2017, Oliver et al. 2018). This has major impacts on marine ecosystems (Wernberg et al. 2016).
Rainfall
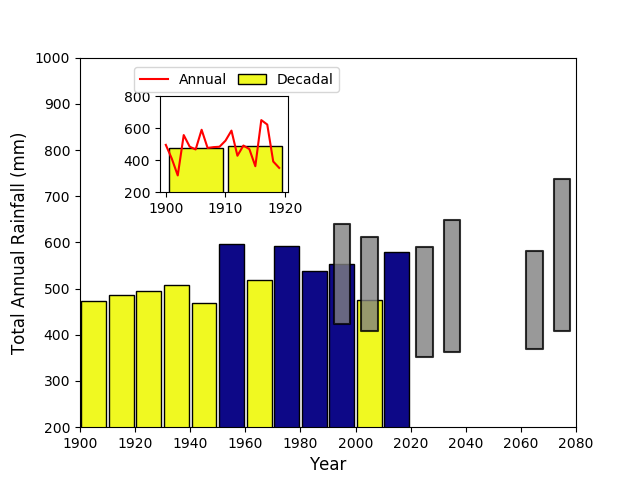
Unlike temperature, which shows a clear increase over the past 50 years, no clear pattern of change is evident for rainfall across the state. This is due to the large variability in natural rainfall patterns in NSW. As shown in Figure 21.3, the main feature of NSW rainfall since the beginning of the 20th Century is large annual and decadal variations between wet and dry periods.
Figure 21.3: Measured and projected average annual rainfall values for NSW/ACT for selected decades in the 20th and 21st centuries
Notes:
Periods drier than the 1900–2010 average are represented by yellow bars, with wetter periods shown in blue. The grey bars represent the range of rainfall values projected by regional climate models. The final BoM decadal average is only for 2011–2017.
Inset: Rainfall varies from year to year within each decade. The first two decades of the BoM data are shown as decadal averages (yellow bars) and the annual averages (red line), illustrating large year-to-year rainfall variability.
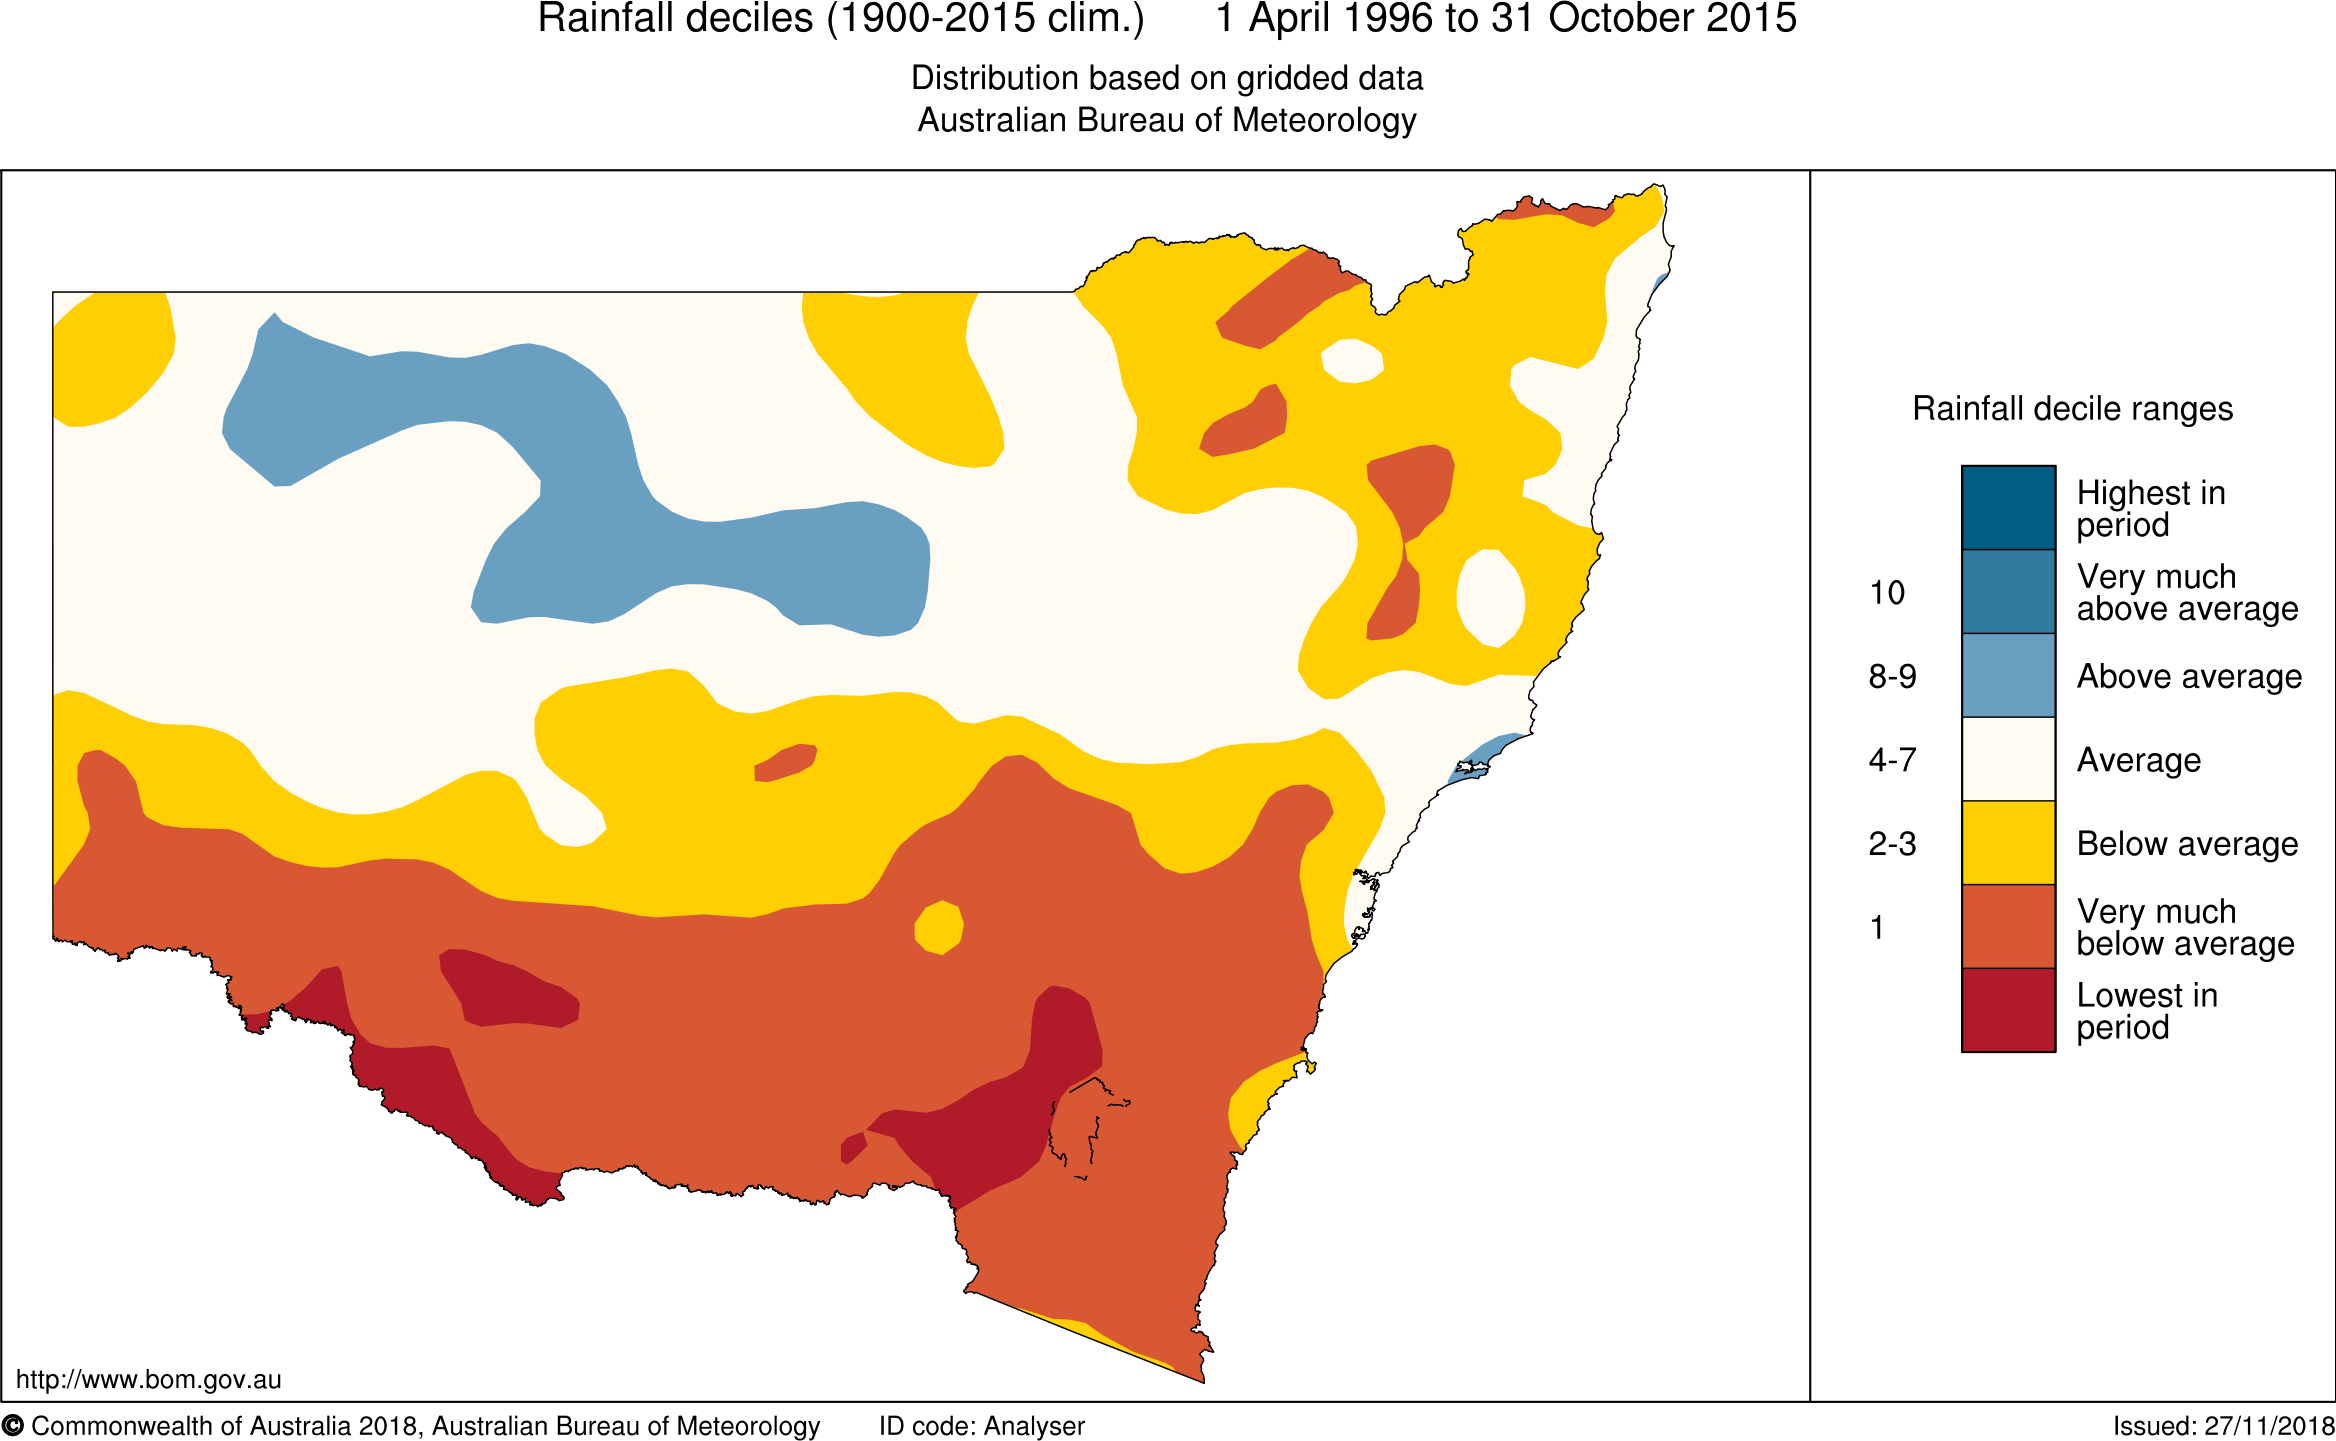
Despite this large natural variability, underlying longer-term trends are becoming evident in the warm season (October to April) and cool season (April to October) since the mid-1990s (BoM & CSIRO 2016). The cool season has seen the largest change with rainfall very much below average over the past 20 years in southern NSW as shown in Map 21.1.
Map 21.1: Southern growing season (April–October) rainfall deciles for the last 20 years (1996–2015)
NSW will continue to experience considerable rainfall variability from year to year (grey bars in Figure 21.3), making longer-term changes difficult to discern as they take effect. However, over the next 20 years, some areas of the state may start to experience significant changes in rainfall in some seasons as part of underlying longer-term trends. These trends will be different for each region and season of the year.
The latest regional climate projections suggest:
- a decline in both summer and winter rainfall is likely in the north-east of NSW
- some parts of the south-east may experience drier springs but wetter summers
- summer and autumn may become wetter in some parts of the west (OEH 2014).
The combined effect of increasing temperatures and declining rainfall across most of NSW during the winter and spring period mean that the time spent in drought will likely increase over the course of the century (OEH 2014; CSIRO & BoM 2015).
Changes in the behaviour of heavy rainfall events are not the same as changes in seasonal average rainfall. Since 1911, the amount of heavy rainfall on the wettest day of the year has increased significantly across most of NSW (Evans et al. 2014b).
Climate change is expected to bring further increases in the intensity of heavy rainfall, even where average rainfall is expected to decrease. However, it may be difficult to discern long-term changes against significant year-to-year variability. The smaller scale weather systems responsible for many rainfall extremes are especially difficult to represent in computer models, which means there is uncertainty in exactly how the behaviour of heavy rainfall may change in the future.
Recent research shows that most modelling studies may have underestimated future changes in heavy rainfall, especially for the most intense rainfall events (Bao et al. 2017). Ongoing developments in computer modelling may lead to more precise information becoming available (Kendon et al. 2017).
Ocean temperatures
Climate change has increased ocean temperatures, with periodic variations sometimes referred to as 'marine heat waves'. These will have extreme consequences for the survival of marine and estuarine species and lead to changes in the distribution of many others. South-east Australia is a global hotspot for ocean warming, occurring at around four times the global average, due to the increased strength and southward penetration of the East Australian current (Hobday et al. 2006; Ridgway 2007; Poloczanska et al. 2012).
However, predictive studies show that changes in the movement of water masses, rather than temperature, will have the greatest potential impact on future distributions of species in NSW waters (Cetina-Heredia et al. 2015); though this is an area that needs further research.
Sea level rise
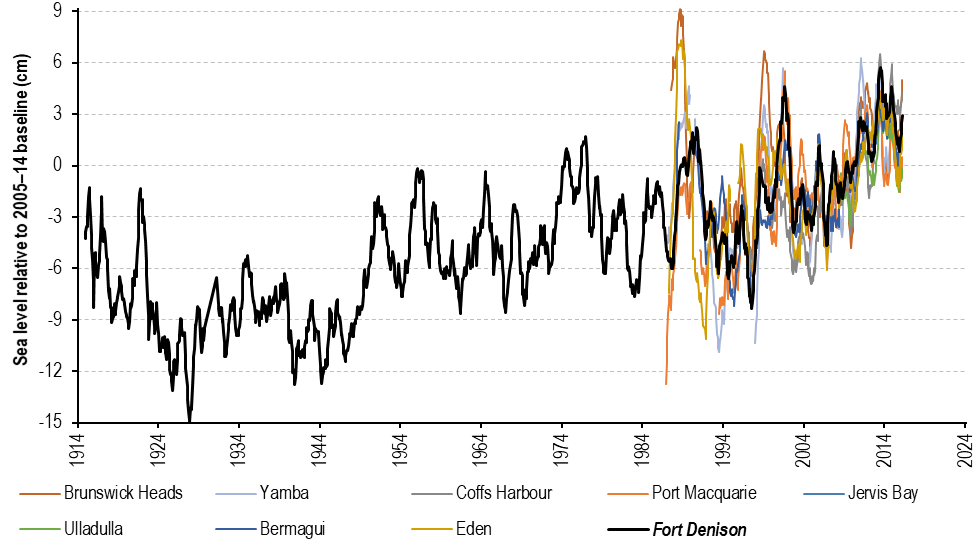
Over the 20th Century, globally averaged sea levels rose at a rate of approximately 1.7mm per year. More recently this has increased to around 3.2mm per year (Rhein et al. 2013). Rates of sea level rise in south-east Australia are generally consistent with the global average (White et al. 2014).
The magnitude of future sea level rise will largely be dependent on the extent of ocean warming and the loss of land-based ice from Greenland and Antarctica. Due to the long response times of the ocean, sea levels will rise for centuries, even if greenhouse gas emissions are curbed and their atmospheric concentrations stabilised.
For NSW, model predictions suggest sea level rise of up to 10% above the global average by the end of the 21st Century (0.54 to 1.06m for the business-as-usual, high emissions future climate pathway; Church et al. 2016). However, much higher sea level rise is possible. A recent review by the US National Oceanic and Atmospheric Administration (NOAA) indicates a physically plausible global mean sea level rise in the range of 2.0 to 2.7m by 2100 (Sweet et al. 2017).
Figure 21.4: Sea level (cm) for Fort Denison (black) and other NSW stations (see legend), relative to the 2005–2014 average
Environmental impacts of climate change
The observed changes to climate and the projected future changes that are described above are already having widespread impacts on the NSW community and the urban and natural environments of NSW. In many areas the environmental effects of climate change are already apparent, and impacts will become more extensive and pronounced over time.
Extreme weather and climate events
Heatwaves
Heatwaves are a significant hazard for the people and environment of NSW. The risk of premature death has been shown to escalate quickly as temperatures increase(Gasparrini et al. 2015).
Over the period 1911–2013, heatwaves in parts of NSW have become longer, hotter and more frequent. Since the late 1950s, these changes have accelerated in most regions (OEH 2015a).
Climate change is expected to increase the frequency and duration of heatwaves in the future with the extent of these changes varying by location. Projections indicate that by 2030 there could be an additional heatwave per year on average and an additional three or four heatwaves per year on average by 2070, across most of NSW (Argueso et al. 2015). By 2030, the length of the longest heatwave in a year is projected to be two or three days longer, on average, and by 2070, three to nine days longer.
Cities create their own microclimates by influencing the surrounding atmosphere and interacting with climate processes. The most striking characteristic of an urban microclimate is the urban heat island effect. As a result, air temperatures in Sydney are expected to increase due to climate change and increasing urbanisation. By 2030, climate change is projected to increase maximum temperatures in Sydney by 0.7°C, while a change in land-use from grasslands to medium-density housing will contribute a further increase of between 0.5°C–0.9°C (OEH 2015b).
Storms
Climate change is expected to affect the behaviour of storms and associated phenomena (e.g. high winds, hail and lightning) in NSW. Some research indicates that in some parts of eastern Australia climate change may be associated with future increases in the frequency of thunderstorms (Allen & Karoly 2014). The storms that have the greatest impact on NSW are East Coast Lows, which are low-pressure systems that develop off the east coast of Australia. Current climate modelling for NSW suggests a decrease in the number of small East Coast Lows during winter, but an increase in the frequency of extreme East Coast Lows during summer. Further research is needed to refine projections of changes in thunderstorms and East Coast Lows and their impacts.
Floods
Floods and extreme storms damage property and infrastructure and affect the health and wellbeing of NSW communities. Flooding in urban and rural NSW costs the economy an average of about $250 million each year and causes loss of life and emotional distress. It is likely that the frequency and intensity of floods and storms will be affected by climate change. Modelling projections, combined with our understanding of the physical processes involved, indicate that an increase in the intensity of extreme rainfall events and associated flooding is likely in the future, although the magnitude of the increases cannot be confidently projected.
Sea level influences flooding in the lower parts of coastal waterways. Any increase in sea level would alter the frequency and severity of flooding in coastal waterways caused by storm events of a given frequency.
Bushfires
Bushfires can cause loss of life and large economic costs. The risk of bushfire depends on several factors (Bradstock 2010):
- an ignition source
- enough sufficiently dry vegetation to burn (fuel)
- favourable weather conditions for fire to spread.
Most studies of the impact of climate change on bushfire risk focus on weather conditions conducive to fire. Weather can influence the intensity and frequency of fire and the risk it poses to life and property (Blanchi et al. 2010, 2014). Over recent decades, fire weather conditions have become more severe and the fire season has lengthened in some parts of NSW. This is at least partly due to a warmer climate and large-scale drying (Clarke et al. 2013; Dowdy 2017). However, the effect that warming has had on fire activity itself is uncertain as it is difficult to isolate from the influence of other factors, such as changes in ignition sources, vegetation management and prescribed burning.
The Rural Fire Service issues fire weather warnings when the Forest Fire Danger Index (FFDI) is forecast to be over 50, indicating severe fire weather. Climate projections for NSW suggest future increases in the frequency of severe fire weather, especially in the state’s west (OEH 2014). Map 21.2 shows the projected change in the average number of severe fire weather days per year between 1990–2009 and 2060–2079. More recent research suggests that fuel loads available to bushfires will also increase in the future (Clarke et al. 2016). The bushfire season will extend earlier into spring but severe fire weather in autumn is projected to decrease in eastern NSW due to a projected increase in rainfall.
Map 21.2: Projected change in average annual number of severe fire days between 1990–2009 and 2060–2079
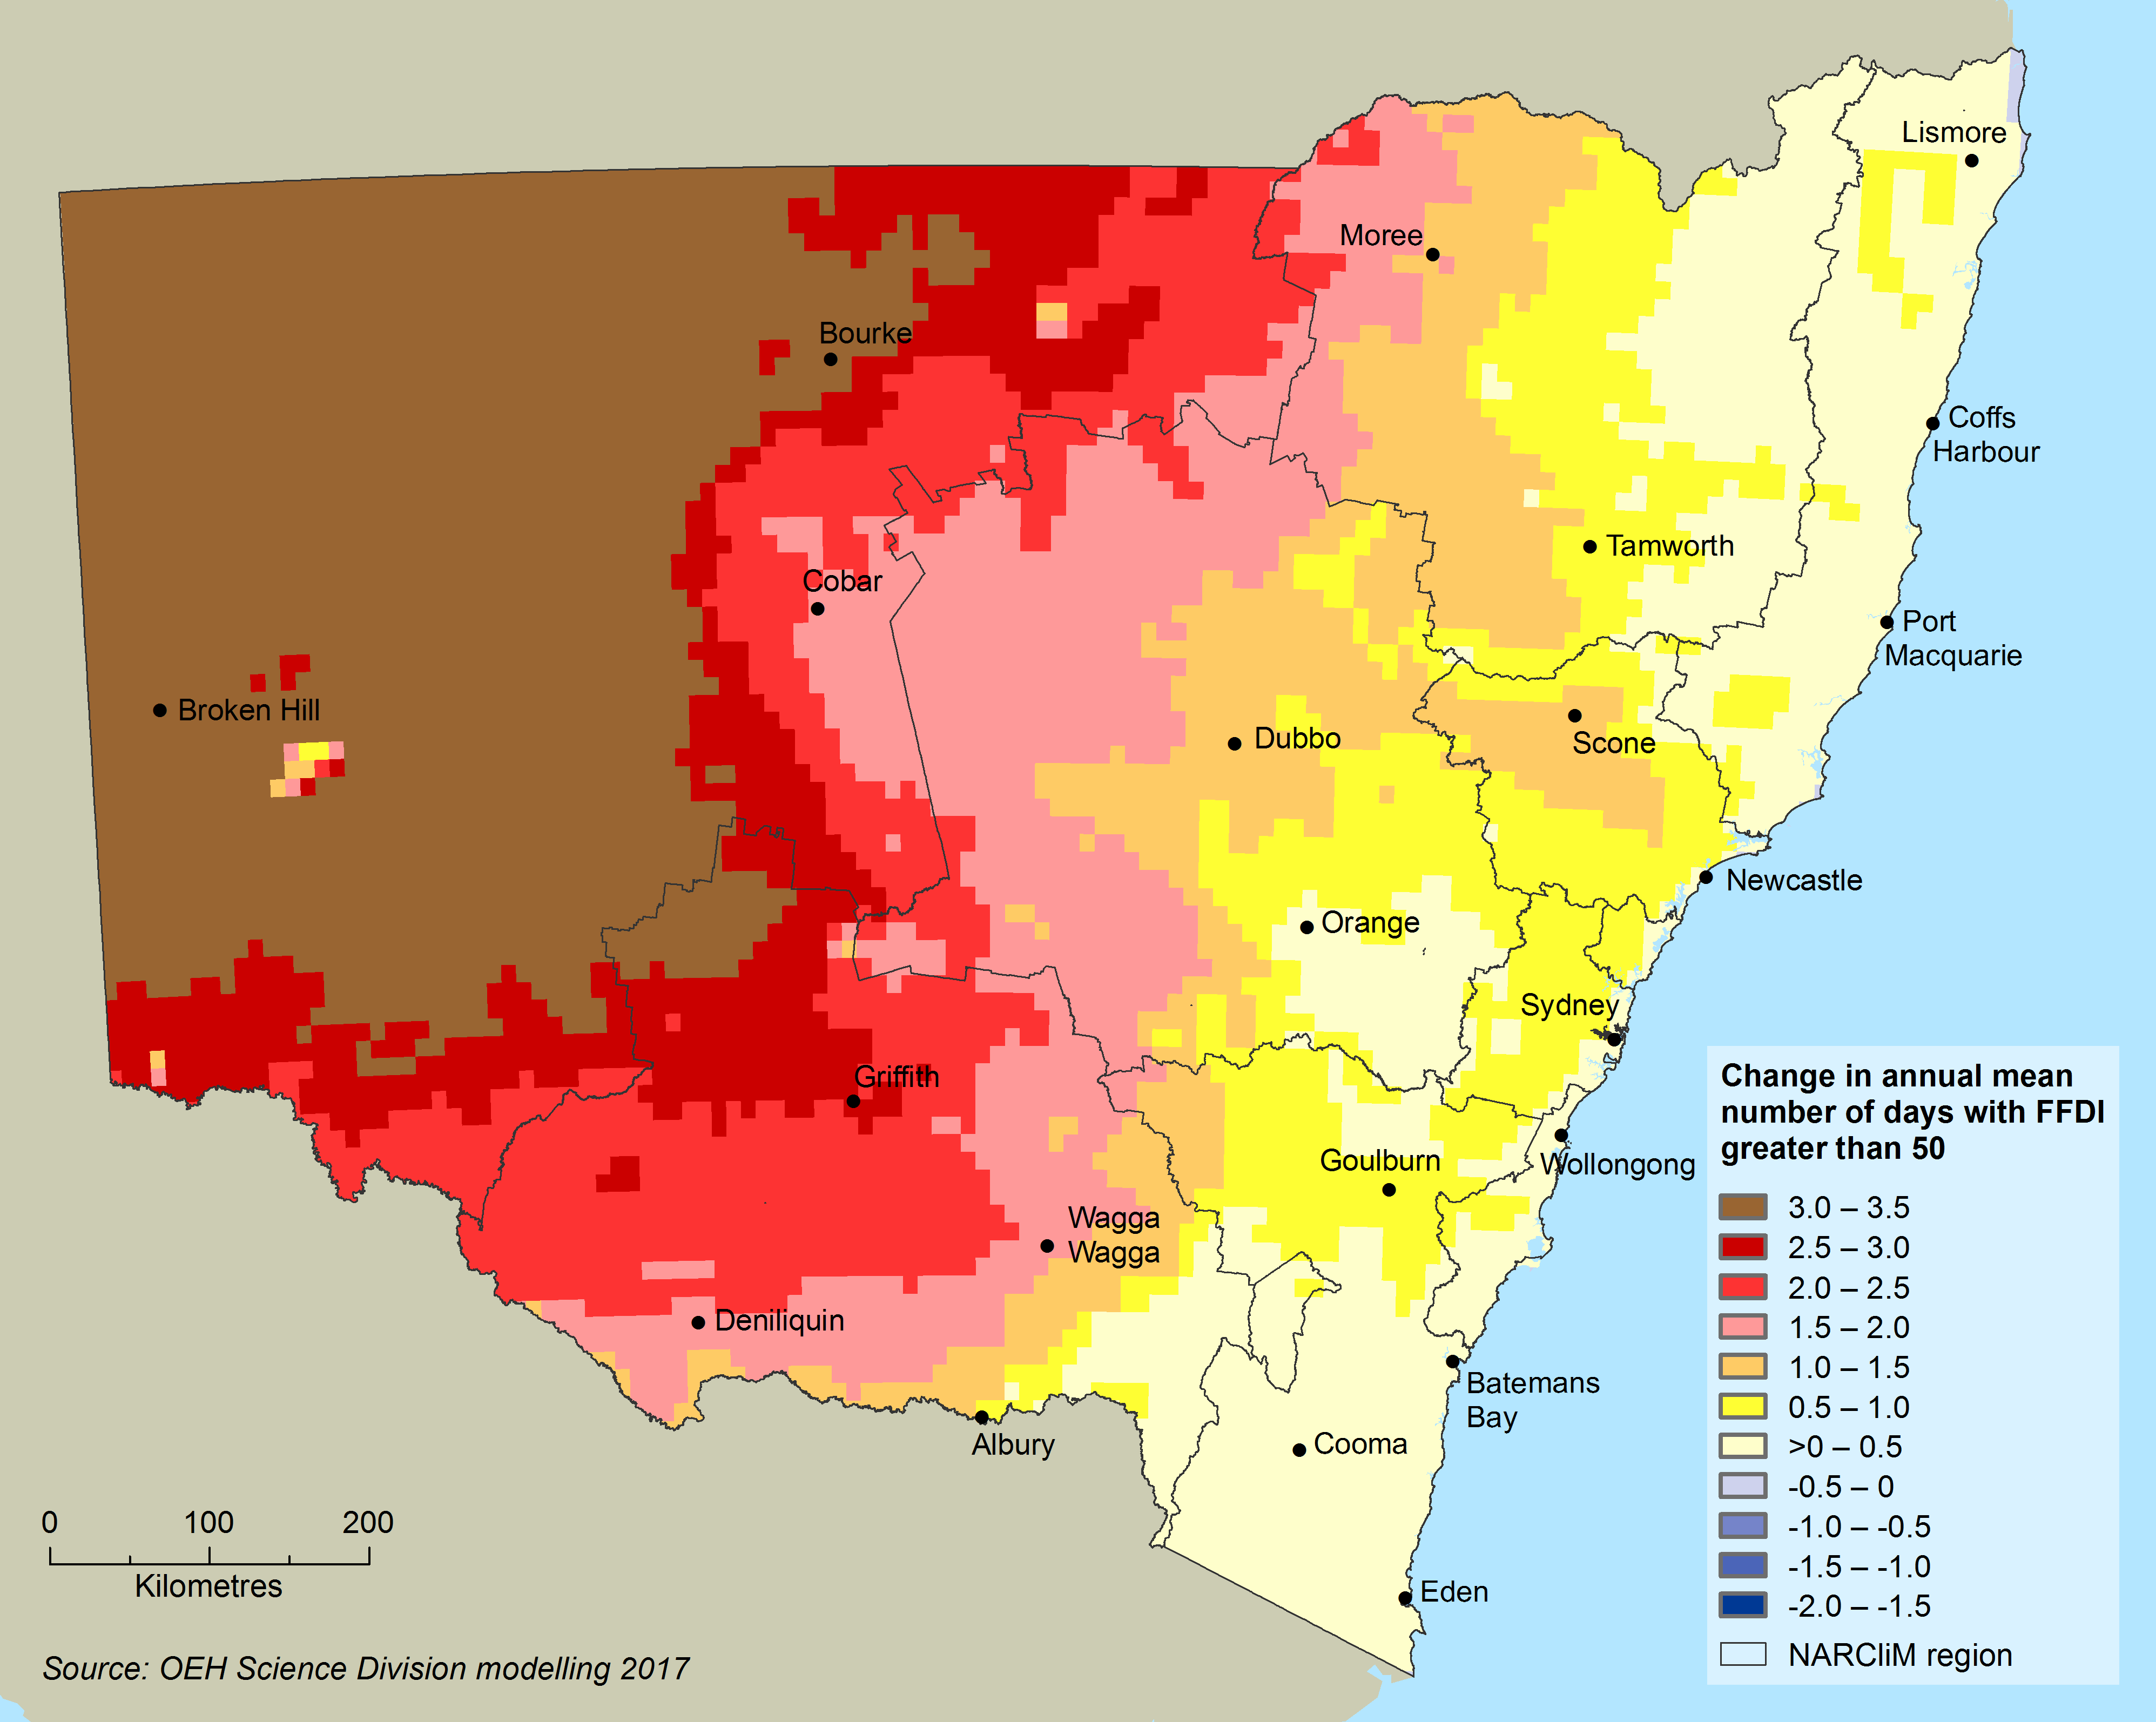
Notes:
The projection is based on regional climate model estimates (also used in Figure 21.2 and Figure 21.3)
Some of the most intense and damaging bushfires in Australia (e.g. the 2003 Canberra fires and the 2009 Black Saturday fires) have involved an atmospheric phenomenon called pyroconvection. This occurs when a fire releases heat and moisture into the lower atmosphere, causing conditions similar to those that drive thunderstorms. This can contribute to the spread and unpredictability of fires.
The effect of climate change on the incidence of pyroconvection is uncertain. Some recent research has suggested that the risk of pyroconvection in NSW has been increasing in spring and summer (Dowdy & Pepler 2018) and that the climate could become more conducive to intense bushfires in the future (Sharples et al. 2016).
Land and marine ecosystems and processes
Soil health
Soils support the growth of most plant life and are a crucial element of all terrestrial ecosystems. By 2070, substantial changes are predicted to the condition and make-up of soils, due to the impacts of changes in climate. These will need to be considered in the future management of soils and associated agriculture and native ecosystems across NSW.
Soil erosion has impacts on soil condition, agricultural productivity and water quality. Over the next 20–50 years the erosion rate of soil is predicted to be 7–19% higher due to the effects of climate change. The areas most affected will be mountainous regions of the Great Dividing Range especially along the Central Coast, North Coast and Hunter Valley (Yang et al. 2016).
Soil organic carbon is a widely used indicator of soil health. This is expected to decline throughout the state due to climate change, resulting in losses up to 10t/ha. In the southern alpine region, losses greater than 20 t/ha are likely.
The pH of a soil represents its degree of acidity or alkalinity. Higher pH or more alkaline soils are projected over most the state due to climate change, generally increasing from east to west. The largest increases of up to 0.5 pH units are expected in the southern alpine areas.
Terrestrial species and ecosystems
As many Australian species are adapted to highly variable climates, they are likely to have some capacity to cope with changes in climate. However, the resilience of many species may have been eroded by existing pressures on biodiversity which have resulted in documented declines (see the Native Fauna and Threatened Species topics).
Climate change is expected to exacerbate the effects of existing threats and introduce additional pressures (Steffen et al. 2009; Hughes 2011). Scientific studies suggest that over the next few decades climate change could surpass habitat destruction as the greatest threat to biodiversity (Leadley et al. 2010). This impact could be comparable to the historical losses of biodiversity that have occurred in NSW, and Australia.
As the climate changes, the capacity of landscapes to support ecosystems in their current state will decline. Many of the most vulnerable ecosystems in Australia are found in NSW and are sensitive to changes in climate. These include:
- ecosystems that only exist at certain elevations, such as alpine systems
- coastal floodplains and wetlands
- the wetlands and floodplains of the Murray–Darling Basin
- temperate eucalypt forests
- saltmarshes and mangroves.
The main threats to these ecosystems are extreme weather events and changes to fire regimes or water balance and hydrology (Laurence et al. 2011).
By 2070, many areas of NSW are projected to become 30–60% less suitable for their present ecosystems, requiring species to either migrate or adapt to survive. Some of the greatest changes are expected to occur across the highly modified landscapes of the wheat/sheep belt, where the capacity to support change has been diminished.
Many plant and animal species are sensitive to changes in climatic variables, such as temperature, rainfall and humidity. Species identified as the most at risk from climate change include those with:
- a narrow range of physiological tolerances
- low genetic variability and long generation times
- specialised requirements for other species or narrow geographic ranges
- limited capacity to disperse or move to new habitats (Steffen et al. 2009).
There is evidence that recent climatic and atmospheric changes are already having wide-ranging effects on some species (OEH 2011). Observations of range shifts for species and changes in the timing of life cycles, are among the best-documented impacts that have been linked to changes in climate (Bellard et al. 2012; Hughes 2000; Hughes 2003a; Hughes 2003b; Parmesan 2006; Parmesan & Yohe 2003; Walther et al. 2002).
Some examples of observed changes in species in Australia consistent with the effects of climate change include:
- Native and feral animals from lower elevations are colonising alpine ecosystems (Green 2003; Pickering et al. 2004).
- Snow gums (Eucalyptus pauciflora) are encroaching into subalpine grasslands at higher elevations (Wearne & Morgan 2001).
- Sleepy lizards (Tiliqua rugosa) are changing their mating behaviour, with warmer and drier winters leading to earlier mating and longer pairings (Bull & Burzacott 2002).
- Long-term studies of 24 bird species migrating to south-east Australia each year indicate that 12 species are arriving 3.5 days earlier each decade, and leaving 5.1 days earlier (Beaumont et al. 2006).
- Birds of the same species tend to have smaller body sizes in warmer parts of their range and for eight NSW species, smaller individuals are now being found further south, consistent with the effects of a warming climate (Gardner et al. 2009).
- Bold-striped cool-skinks in south-east Australia are changing the depth of their nests and the time at which they lay their eggs, and more females are now being born, as nest temperature affects the sex of offspring (Telemeco et al. 2009).
A recent study also found that the main factor affecting the distribution of the platypus had switched from the availability of aquatic habitat to heat tolerance (estimated by annual maximum temperature). This switch is directly attributable to temperature changes in south-east Australia and raises concerns for the future of the species (Klamt et al. 2011).
Species and ecosystems may adapt to the effects of climatic change through a range of strategies, such as:
- evolving or changing their behaviour in their current location
- taking refuge in local areas that are buffered from the changes
- migrating or dispersing to areas where the climate is more suitable.
However, these natural adaptive responses of native species and ecosystems may be constrained by both the increasing speed of the changes in climate and pre-existing threats to biodiversity.
Ocean acidification
The rise in atmospheric carbon dioxide concentrations is increasing ocean acidity. Elevated carbon dioxide may affect marine organisms through changes to their metabolic physiology and the calcification rates of hard structures (e.g. shells and external skeletons). Acidification will cause losses to species diversity and abundance, with shifts to unusual communities of non-calcifying organisms.
Evidence for the impacts of acidification comes mostly from experimental work on calcifying, stationary animals, which are most vulnerable to ocean acidification (Parker et al. 2013, Ross et al. 2011). A particularly vulnerable group is marine molluscs (e.g. oysters, abalone and whelks), especially in their juvenile reproductive stages (Parker et al. 2010, Scanes et al. 2014). Acidification acts in concert with temperature to reduce fertilisation in Sydney rock oysters, resulting in smaller size, longer development times and increased abnormality of larval stages (Parker et al. 2010), and with other stressors to limit their survival (Scanes et al. 2017).
Coastal erosion and inundation
Of all the impacts from climate change, sea level rise is likely to be among the most difficult to handle. Over time, the rate of sea level rise is expected to increase (e.g. see Figure 21.4 above), resulting in greater exposure of coastal lakes and estuaries to inundation and erosion. The potential implications include:
- higher and more frequent inundation by tides and storm surge events, eventually leading to permanent inundation of low-lying areas
- the landward recession of sandy shorelines
- salt water intrusion into groundwater aquifers
- the landward advance of tidal limits within estuaries
- changes to the frequency of entrance opening and flooding behaviour of intermittently closed and open lakes and lagoons
- the failure of stormwater infrastructure and sewerage systems.
Image 21.1: Inundation from high tides, Woy Woy, January 2018
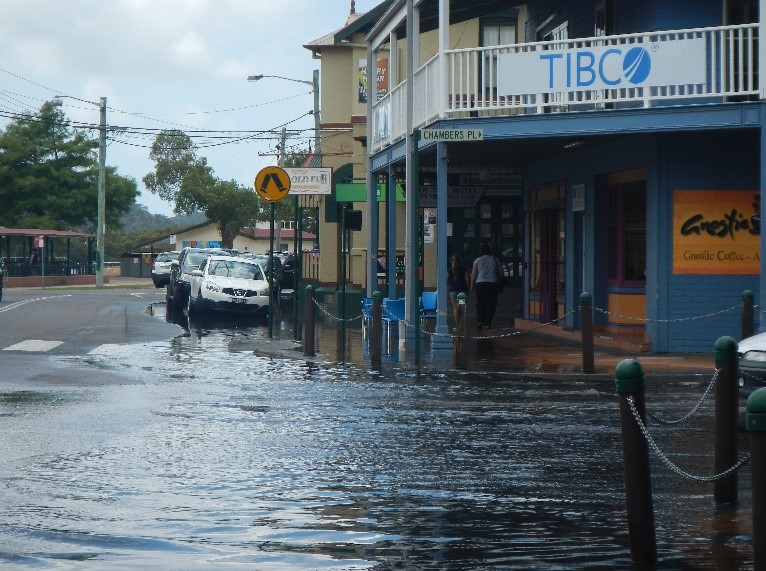
Considerable development along the NSW coast is currently exposed to inundation and erosion hazards and this is expected to grow significantly with climate change. A recent erosion assessment for NSW found approximately 250 property lots where more than half the allotment is currently exposed to coastal erosion. The number of property lots affected by coastal erosion is expected to increase to around 1,860 by 2050, and to around 3,300 by 2100 (Kinsela et al. 2017).
Exposure to tidal inundation during king tides currently affects around 600 properties located near estuaries in NSW. This increases to 4,300 with 0.5m of sea level rise to 22,100 for 1m of sea level rise, and to 43,300 with 1.5m of sea level rise (Hanslow et al. 2018).
Marine species and ecosystems
The long-term impacts of climate change are expected to have significant effects on marine species and ecosystems across south-east Australia (Hobday et al. 2006; Wernberg et al. 2011; Verges et al. 2014). This includes changes to:
- the distribution and abundance of marine species
- the timing of life cycle events
- the physiology, morphology and behaviour of individual species (e.g. rates of metabolism, reproduction or development)
- the composition of biological communities
- connectivity among populations, species and habitats (Coleman et al. 2013; Coleman et al. 2017).
Specific studies have identified that increases in temperature are likely to result in:
- the establishment, spread and virulence of pathogens and exotic species (Wernberg et al. 2011, Campbell et al. 2011; Harvell et al. 2002)
- changes in the range and distribution of harvested species (Pecl et al. 2011; Cetina Heredia et al. 2015)
- changes in the composition, structure and dynamics of communities (Verges et al. 2014; Provost et al. 2017)
- induced disease in seaweeds (Campbell et al. 2011; Qui et al. in review)
- the poleward contraction of kelp and other macroalgal habitats (Smale & Wernberg 2013)
- a reduction in kelp habitat and associated changes in community composition and ecosystem function, particularly in northern NSW (Verges et al. 2016).
Socio-economic effects
Agriculture, fisheries and forestry
The $15.4 billion (2016–17) NSW primary industries sector operates in one of the most variable climates in the world. Primary industries are already experiencing the effects of climate change. The impact is mainly due to rising temperatures, but also some change to rainfall patterns, resulting in lower than average winter and spring rainfall in some areas (see Part 1. Changes in climate).
Despite operating in an environment of substantial climate variability the agricultural sector has maintained relatively high rates of productivity. There is still considerable uncertainty about future regional rainfall patterns and the impacts of increasing carbon dioxide concentrations on plant growth, so climate change will provide both challenges and opportunities for existing and emerging industries. Climate impacts on agricultural industries are complex and reflect the specific sensitivities of each production system to climate at key times of the year.
The trend towards lower winter and spring rainfall will generally place downward pressure on dryland broadacre crop yields. However, higher carbon dioxide concentrations under climate change may be beneficial to crop growth and could offset some level of rainfall decline. The interaction between higher carbon dioxide and lower rainfall levels and increased evapotranspiration needs to be better understood. Due to lower rainfall and inflows into major storages irrigated crops are likely to face reduced water supplies. However, a reduction in the number of cooler days under climate change may benefit major irrigated crops (such as rice and cotton), which are sensitive to low temperatures at key times in their production cycle.
Rising temperatures are likely to pose challenges for the horticulture and viticulture sectors. Higher minimum temperatures, for example, are likely to reduce essential winter chill and reduce yields for some fruit and nut crops, such as cherries. Some wineries are reporting that harvesting is now occurring several weeks earlier than past records and that the climate is becoming too warm to produce good quality crops of some premium grape varieties.
Climate change is likely to have mixed effects on the livestock sector. While higher carbon dioxide levels may promote pasture growth, higher temperatures and less rainfall at key times could negatively affect production. Higher minimum temperatures in winter may reduce stock losses from cold snaps. Conversely, increases in maximum temperatures will increase heat stress and result in reductions in animal productivity.
In the forestry sector, higher concentrations of carbon dioxide are likely to result in increased woody growth rates, but these effects may be counteracted by reduced soil nutrient and moisture levels. The forestry sector also faces a higher risk of bushfires and increased damage from pests. Climate change may result in the development of new bioclimatic niches for weeds, pests and diseases, which may lead to increased biosecurity issues for some regions or primary industry sectors.
Increasing temperatures and changes in rainfall patterns will also affect the migration and breeding patterns of freshwater fish, as well as altering their habitat and food sources (DPI 2018).
Human health
Climate change is expected to have detrimental impacts on the health and wellbeing of the people of NSW. The intensity and frequency of extreme climatic events, particularly heatwaves, is anticipated to increase over coming decades. Periods of successive extreme heat and cold have been shown to have major effects on human health and increase rates of health service utilisation (Jegasothy et al. 2017).
Pressures
The NSW State of the Environment (SoE) framework, is based on the Pressure-State-Response model of reporting. Within this report, the issues of economic activity (the economy) and population growth are treated as drivers of environmental change. Unlike pressures, which have a direct impact on environmental outcomes, the effects of growth in population and the economy are more diffuse and are mediated through a complex network of pathways for resource use and consumption, the production of goods and services, and the generation of waste.
More specific issues, such as energy use and transport, are described as pressures. These account for the bulk of greenhouse gas emissions in NSW and Australia. The build-up of greenhouse gases in the atmosphere is the main cause of human-induced climate change. The changes that are happening to the Earth's climate are leading to a range of disturbances to physical and biological systems and processes, human society and infrastructure, reported as outcomes to environmental resources and assets.
Economic activity
It is generally accepted that a level of growth in the economy is desirable to improve living standards, but economic growth does not necessarily need to be achieved at a significant cost to the environment. The decoupling of economic growth (gross state product or GSP) from carbon emissions in the NSW economy over the past 30 years is demonstrated in the topic Economic activity and the environment. Since 1990 there has been a 60% reduction in carbon emissions per dollar of GSP in the NSW economy. The decoupling is clearer for carbon emissions than for most other benchmarks of environmental performance.
A report for the Australian Business Roundtable for Disaster Relief and Safer Communities (Deloitte Access Economics 2017) estimates the total economic cost of natural disasters in Australia. For NSW this figure is $3.6 billion per year, on average, at the current time. By 2050, this is estimated to rise to $10.6 billion. However, this estimate is conservative and explicitly excludes climate change from the analysis, so these costs are likely to be substantially higher. The costing of climate change impacts and responses is discussed further in the topic Economic activity and the environment.
Population
Over the past five years the NSW population has grown at a rate of 1.5% annually. Higher population leads to an increased demand for food, resources, energy and transport, all of which have associated greenhouse gas emissions. Over the past 10 years, total energy consumption has remained stable, but there has been an overall decline in the per capita consumption of electricity in NSW.
Energy use and transport
The production and use of energy from non-renewable sources is the main cause of greenhouse gas emissions in NSW. Total energy use has fallen slightly over the past 10 years. Fossil fuels currently account for about 93.5% of the final energy use.
Transport is the largest (and fastest growing) sector for total energy use, at 45%. Electricity use has fallen slightly and accounts for around one-fifth of total energy use. For more information see the topics Energy Consumption and Greenhouse Gas Emissions.
Greenhouse gas emissions
The main cause of global warming and climate change is the build-up in the atmosphere of greenhouse gas emissions from human activities, including power generation and use, transport, industry and agriculture.
In NSW, greenhouse gas emissions peaked in 2007 and are now about 22% lower than their 1990 levels. Stationary energy from electricity generation is the most carbon intensive form of energy use and is responsible for the largest proportion of emissions in NSW (51%), while the transport sector accounts for about 21%.
NSW (and Australia’s) contribution to total global greenhouse gas emissions is small, but on a per capita basis it is relatively high. In isolation, efforts to reduce emissions will have little impact, so global cooperation is needed to achieve effective reduction and change.
Climate tipping points
The more greenhouse gas build-up in the atmosphere, the greater the risk that a climate tipping point will be triggered (Drijfhout et al. 2015). Climate tipping points can occur when gradual changes to the climate system produce feedbacks, which can result in abrupt climate shifts.
Our ability to predict when and at what temperature these climate tipping points will be reached is currently limited. Three climate tipping points associated with greenhouse gases are (OECD report 2017, Box 2.1):
- the release of organic carbon (methane) from melted permafrost in the Arctic region, which would drastically increase atmospheric greenhouse gas concentrations and sea levels (Saunois et al. 2016)
- a collapse of the Atlantic meridional overturning ocean circulation, which influences the global distribution of heat, nutrients and gases, associated with increased freshwater and warming near the ocean surface (Boulton et al. 2014)
- deforestation that would permanently damage the rainfall cycle and reduce the ability of forests to absorb greenhouse gases and to sustain local ecosystems (Galford et al. 2010; Lovejoy and Nobre 2018).
Responses
There are two main strategies available to address the effects of climate change – mitigation and adaptation.
Mitigation of climate change describes the actions taken to limit or reduce the extent of global warming by reducing the levels of greenhouse gas emissions produced by human activity, and the actions taken to remove emissions from the atmosphere or from sources of emissions. Adaptation describes the actions taken to reduce, moderate or adjust to the expected or actual effects of climate change, or to take advantage of new opportunities.
This section outlines the key adaptation responses to the impacts of climate change that global efforts to reduce greenhouse gas emissions (mitigation) are unable to avoid. Responses to mitigate emissions are described in the Responses section of the Greenhouse Gas Emissions and
topics.
Because global action is needed for mitigation of climate change to be effective, a pragmatic response to climate change, with a balance between mitigation and adaptation strategies, is appropriate.
Legislation and policies
NSW Climate Change Policy Framework
In November 2016, the government released its NSW Climate Change Policy Framework with the aspirational objectives to achieve net zero emissions by 2050 and make NSW more resilient to a changing climate. The framework articulates the state’s endorsement of the Paris Agreement, and sets key policy directions for mitigation and adaptation. For adaptation these include:
- taking advantage of opportunities to grow new industries in NSW
- reducing risks and damage to public and private assets in NSW arising from climate change
- reducing climate change impacts on health and wellbeing
- managing impacts on natural resources, ecosystems and communities.
In line with the objectives of the policy framework, several long-term planning strategies set goals for the government to build the state's resilience to climate impacts and to prepare for changes in the climate.
State Infrastructure Strategy
The State Infrastructure Strategy prioritises making the state’s $300 billion asset base resilient to shocks and stresses such as floods, bushfires and storms. This includes:
- improving the collection and sharing of data on natural hazards
- undertaking regular assessments of the vulnerability of assets
- consideration of natural hazards in land-use planning
- undertaking investment assessments for new and upgraded infrastructure.
Future Transport Strategy
The Future Transport Strategy commits to making the transport network more resilient to greater extremes of weather and more frequent extreme weather events.
Greater Sydney Region Plan and Regional Plans
The Greater Sydney Region Plan and Regional Plans for 10 state planning regions across NSW include strategies for minimising the impacts of climate change on local communities. The Greater Sydney Region Plan proposes to strengthen Sydney’s resilience to climate change by increasing the urban tree canopy to reduce the impact of extreme heat and to use energy and water resources more efficiently.
Coastal Management Framework
The NSW Government’s new Coastal Management Framework, which started in 2018, establishes a new strategic land-use planning framework for coastal management. This requires local councils to prepare management programs that consider the effects of climate change on coastal processes. It also includes a Coastal Management State Environmental Planning Policy and local planning direction, which requires councils and other planning authorities to consider current and future hazards in strategic planning when assessing coastal development proposals.
State Level Emergency Risk Assessment
The government’s 2017 State Level Emergency Risk Assessment made recommendations to integrate climate change impacts and adaptation mechanisms into emergency management arrangements.
Critical Infrastructure Resilience Strategy
The NSW Critical Infrastructure Resilience Strategy, released in 2018, highlights the benefits of improved adaptation of critical infrastructure to address long-term stresses, such as climate change. The strategy notes the responsibility of the state government to integrate climate change adaptation into government assets and services.
Programs
There are three integrated work areas within the NSW Climate Change Adaptation program:
- Climate Change Information and Knowledge Delivery – programs and products that provide NSW communities with access to locally specific climate change data, tools and resources to help them make informed and effective decisions
- Cultural and Ecosystem-based Adaptation – programs to minimise the impact of climate change on urban and natural environments by protecting and enhancing ecosystem services and cultural values, including through the NSW National Parks Adaptation Strategy
- Regional Preparedness – programs to help regional decision makers to address local climate change vulnerabilities, safeguard government assets and services by tracking their exposure to climate risks, provide training to build skills, and direct technical and financial support to implement adaptation projects and build the capacity for effective response.
NSW and ACT Regional Climate Model
The NSW and ACT Regional Climate Modelling (NARCliM) project is a world-leading climate modelling system developed in partnership with the ACT Government and the Climate Change Research Centre at the University of NSW. It provides detailed regional projections for use by decision makers across NSW. NARCliM provides short-term (2020–39) and long-term (2060–79) projections of likely changes in climate, including:
- temperature and rainfall
- fire weather
- hot days (maximums >35⁰C)
- cold nights (minimums <2⁰C).
These projections are assisting in planning and adapting to likely changes in future climate.
AdaptNSW website
The AdaptNSW website provides comprehensive climate change information, analysis and data to support action to address climate change risks and capture opportunities. It includes information on the causes of climate change and likely impacts on biodiversity, bushfires, east coast lows, heat, human health, sea level and coasts, soil and water resources. The website also identifies regional climate change vulnerabilities and provides guidance on implementing adaptive responses to climate change.
Integrated Regional Vulnerability Assessments
Integrated Regional Vulnerability Assessments have been completed for 11 regions across NSW, involving over 1,500 state and local government representatives. These assessments identify how climate change can create vulnerabilities in key regional systems through socio-economic and demographic change, and opportunities to respond through the planning and delivery of government services.
Building Resilience to Climate Change
The NSW Government is helping local councils and communities adapt to climate change by investing in programs that help reduce exposure to natural hazards and other climate risks. The Building Resilience to Climate Change grants program has provided nearly $1.3 million dollars for 62 councils to implement 21 climate change adaptation projects across the state.
NSW Climate Change Adaptation Research Hub
The government established the NSW Climate Change Adaptation Research Hub in 2012, as a collaboration between leading NSW universities and the Office of Environment and Heritage. It has delivered over 70 research projects on action for climate change adaptation across four priority areas:
- biodiversity
- adaptive communities
- coastal processes and responses
- human health and social impacts.
Five Million Trees Initiative
The government is promoting the use of urban green cover to alleviate urban heat, including the Five Million Trees Initiative to increase the urban canopy in Sydney from 16% to 40% by 2030. This will provide more shade, cooler suburbs and increased comfort for communities to adapt to increasing temperatures and more frequent heatwaves.
Other programs
Many other natural resource management programs incorporate a consideration of climate change and the development of resilience in their objectives and delivery. These include:
- The Enhanced Bushfire Management Program, which is designed to improve hazard reduction and bushfire response capabilities to protect against increasing fire risks due to the impacts of climate change.
- Private land conservation: the NSW Government has provided $240 million in funding through the Biodiversity Conservation Trust to support willing landholders to manage their land for conservation and increase the resilience of the land sector.
- Protected Area Management, which supports the delivery of on-park infrastructure and works to build resilience to climate change and other pressures and to increase awareness of the importance of adaptation
- The Hawkesbury-Nepean Flood Risk Management Strategy: the Hawkesbury-Nepean Valley has a high risk of flooding and climate change may increase the risk so the NSW Government has committed $58 million for Phase One of the Flood Strategy, including funding to support planning and a final assessment of the upgrade to the Warragamba Dam.
References
References for Climate Change
Allen JT & Allen ER 2016, ‘A review of severe thunderstorms in Australia’, Atmospheric Research, vol. 178, pp. 347–66
Allen JT & Karoly DJ 2014, ‘A climatology of Australian severe thunderstorm environments 1979–2011: inter-annual variability and ENSO influence’, International Journal of Climatology, vol. 34, pp. 81–97
Argüeso D, Di Luca A, Evans JP, Parry M, Gross M, Alexander L, Green D & Perkins S 2015, Heatwaves affecting NSW and the ACT: Recent trends, future projections and associated impacts on human health, NARCliM Technical Note 5, Sydney, Australia: Report to the NSW Office of Environment & Heritage
Bao JS, Sherwood SL, Alexander L & Evans J 2017, ‘Future increases in extreme precipitation exceed observed scaling rates’, Nature Climate Change [doi: 10.1038/nclimate3201]
Beaumont LJ, McAllan IAW & Hughes L 2006, ‘A matter of timing: Changes in the first date of arrival and last date of departure of Australian migratory birds’, Global Change Biology, vol. 12(7), pp. 1339–54 [dx.doi.org/10.1111/j.1365-2486.2006.01171.x]
Bellard C, Bertelsmeier C, Leadley P, Thuiller W & Courchamp F 2012, ‘Impacts of climate change on the future of biodiversity’, Ecology Letters, vol. 15(4), pp. 365–77 [dx.doi.org/10.1111/j.1461-0248.2011.01736.x]
Blanchi R, Leonard J, Haynes K, Opie K, James M & de Oliveira FD 2014, ‘Environmental circumstances surrounding bushfire fatalities in Australia 1901–2011’, Environmental Science & Policy, vol. 37, pp. 192–203 [https://doi.org/10.1016/j.envsci.2013.09.013]
Blanchi R, Lucas C, Leonard F & Finkele K 2010, ‘Meteorological conditions and wildfire-related house loss in Australia’, International Journal of Wildland Fire, vol. 19, pp. 914–26
BoM 2017, Annual Climate Statement 2017, Bureau of Meteorology, Canberra [www.bom.gov.au/climate/current/annual/aus/]
BoM 2018, Special Climate Statement 65: Persistent summer-like heat sets many April records, May 2018, Bureau of Meteorology, Canberra [www.bom.gov.au/climate/current/statements/scs65.pdf (PDF 1.6MB)]
BoM & CSIRO 2016, State of the Climate 2016 report, Oceans and Cryosphere section, Bureau of Meteorology & Commonwealth Scientific and Industrial Research Organisation, Canberra [www.bom.gov.au/state-of-the-climate/oceans-and-cryosphere.shtml]
Boulton CA, Allison LC & Lenton TM 2014, ‘Early warning signals of Atlantic meridional overturning circulation collapse in a fully coupled climate model’, Nature Communications, vol. 5: 5752 [doi:10.1038/ncomms6752]
Bradstock R 2010, ‘A biogeographic model of fire regimes in Australia: Current and future implications’, Global Ecology and Biogeography, vol. 19, pp. 145–58
Bull CM & Burzacott D 2002, ‘Changes in climate and in the time of pairing of the Australian lizard, Tiliqua rugosa: A 15 year study’, Journal of Zoology, vol. 256, pp. 383–7
Campbell AH, Harder T, Nielsen S, Kjelleberg S & Steinberg PD 2011, ‘Climate change and disease: Bleaching of a chemically defended seaweed’, Global Change Biology, vol. 17(9), pp. 2,958–70
Cetina-Heredia P, Roughan M, van Sebille E, Feng M & Coleman MA 2015, ‘Strengthened currents override the effect of warming on lobster larval dispersal and survival’, Global Change Biology, vol. 21, pp. 4,377–86. [doi:10.1111/gcb.13063]
Church JA, McInnes KL, Monselesan D & O’Grady J 2016, Sea level rise and allowances for Coastal Councils around Australia: Guidance material, Commonwealth Scientific and Industrial Research Organisation Report for NCCARF
Clarke H, Lucas C & Smith P 2013, ‘Changes in Australian fire weather between 1973 and 2010’, International Journal of Climatology, vol. 33(4), pp. 931–44
Clarke H, Pitman AJ, Kala J, Carouge C, Haverd V & Evans JP 2016, ‘An investigation of future fuel load and fire weather in Australia’, Climatic Change, vol. 139(3–4), pp. 591–605
Coleman MA, Cetina Heredia P, Roughan M, Feng M, van Sebille E & Kelaher BP 2017, ‘Anticipating changes to future connectivity within a network of marine protected areas’, Global Change Biology, [doi:10.1111/gcb.13634]
Coleman MA, Feng M, Cetina-Heredia P, Roughan M & Connell SD 2014, ‘Temperate shelf water dispersal of Australian boundary currents and implications for population connectivity’, Limnology and Oceanography: Fluids and Environments, vol. 3: pp. 295–309 [doi:10.1215/21573689-2409306]
CSIRO & BoM 2015, Climate change in Australia: Projections for Australia’s NRM regions, Technical Report, Deloitte Access Economics 2017, Building resilience to natural disasters in our states and territories, Report commissioned by the Australian Business Roundtable for Disaster Resilience and Safer Communities, Commonwealth Scientific and Industrial Research Organisation & Bureau of Meteorology, Canberra
Dowdy AJ 2015, ‘Large-scale modelling of environments favourable for dry lightning occurrence’, In Weber T et al. (eds) MODSIM2015, Modelling and Simulation Society of Australia and New Zealand, pp. 1,524–30
Dowdy AJ 2017, ‘Climatological variability of fire weather in Australia, Journal of Applied Meteorology and Climatology [doi:10.1175/JAMC-D-17-0167.1]
Dowdy AJ & Pepler A 2018, ‘Pyroconvection risk in Australia: Climatological changes in atmospheric stability and surface fire weather conditions’, Geophysical Research Letters [doi:10.1002/2017GL076654]
Drijfhout S, Bathiany S, Beaulieu C, Brovkin V, Claussen M, Huntingford C, Scheffer M, Sgubin G & Swingedouw D 2015, ‘Catalogue of abrupt shifts in Intergovernmental Panel on Climate Change climate models’, Proceedings of the National Academy of Sciences, Oct. 2015, vol. 112 (43) E5777-E5786 [doi:10.1073/pnas.1511451112]
Evans JP, Ji F, Lee C, Smith P, Argüeso D & Fita L 2014a, ‘Design of a regional climate modelling projection ensemble experiment – NARCliM’, Geoscience Model Development, vol. 7, pp. 621–9
Evans JP, Argüeso D, Olson R & Di Luca A 2014b, NARCliM extreme precipitation indices report, NARCliM Technical Note 6, Report to the NSW Office of Environment & Heritage [http://climatechange.environment.nsw.gov.au/Impacts-of-climate-change/Floods-and-storms]
Galford GL, Melillo JM, Kicklighter DW, Cronin TW, Cerri CEP, Mustard JF & Cerri CC 2010, ‘Greenhouse gas emissions from alternative futures of deforestation and agricultural management in the southern Amazon’, Proceedings of the National Academy of Sciences, Nov. 2010, vol. 107(46) pp. 19,649–54, [doi:10.1073/pnas.1000780107]
Gasparrini A, Guo Y, Sera F, Vicedo-Cabrera AM, Huber V, Tong S, de Sousa Zanotti Stagliorio Coelho M, Nascimento Saldiva PH, Lavigne E, Matus Correa P, Valdes Ortega N, Kan H, Osorio S, Kyselý J, Urban A, Jaakkola JJK, Ryti NRI, Pascal M, Goodman PG, Zeka A, Michelozzi P, Scortichini M, Hashizume M, Honda Y, Hurtado-Diaz M, Cesar Cruz J, Seposo X, Kim H, Tobias A, Iñiguez C, Forsberg B, Åström DO, Ragettli MS, Guo YL, Wu CF, Zanobetti A, Schwartz J, Bell ML, Dang TN, Van DD, Heaviside C, Vardoulakis S, Hajat S, Haines A & Armstrong B 2017, ‘Projections of temperature-related excess mortality under climate change scenario’, Lancet Planet Health, vol. 1(9), pp. e360–7. doi: 10.1016/S2542-5196(17)30156-0 [www.ncbi.nlm.nih.gov/pubmed/29276803]
Green K 2003, ‘Impacts of global warming on the Snowy Mountains’ in Howden, M, Hughes, L, Dunlop, M, Zethoven, I, Hilbert, D & Chilcott, C (eds), Climate Change Impacts on Biodiversity in Australia: Outcomes of a workshop sponsored by the Biological Diversity Advisory Committee, Commonwealth Scientific and Industrial Research Organisation Sustainable Ecosystems, Canberra, 1–2 October 2002 [www.environment.gov.au/resource/climate-change-impacts-biodiversity-australia]
Hanslow DJ, Morris BD, Foulsham E & Kinsela MA 2018, ‘A regional scale approach to assessing current and potential future exposure to tidal inundation in different types of estuaries’, Scientific Reports (accepted)
Herold N, Ekstrom M, Kala J, Goldie J & Evans JP 2018, ‘Australian climate extremes in the 21st century according to a regional climate model ensemble: Implications for health and agriculture’, Weather and Climate Extremes, vol. 20, June, pp. 54–68 [www.sciencedirect.com/science/article/pii/S221209471730169X]
Hobday AJ & Lough JM 2011, ‘Projected climate change in Australian marine and freshwater environments’, Marine and Freshwater Research, vol. 62(9), pp. 1,000–14 [dx.doi.org/10.1071/MF10302]
Hobday AJ, Okey TA, Poloczanska ES, Kunz TJ & Richardson AJ (eds) 2006, ‘Impacts of Climate Change on Australian Marine Life: Part B’ Technical Report, report to the Australian Greenhouse Office, Canberra [eprints.utas.edu.au/2534]
Hughes L 2000, ‘Biological consequences of global warming: Is the signal already apparent?’ Trends in Ecology and Evolution, vol. 15(2), pp. 56–61
Hughes L 2003a, ‘Climate change and Australia: Trends, projections and impacts’, Australian Ecology, vol. 28, pp. 423–43
Hughes L 2003b, ‘Climate change and biodiversity in Australia’ in Climate Impacts on Australia’s Natural Resources: Current and future challenges conference workbook, pp. 28–9, presented at the National Conference on Climate Impacts on Australia’s Natural Resources: Current and Future Challenges, Surfers Paradise, 25–27 November
Hughes L 2011, ‘Climate change and Australia: Key vulnerable regions’, Regional Environmental Change, vol. 11(1) Supplement, pp. S189–S195 [dx.doi.org/10.1007/s10113-010-0158-9]
Insurance Council of Australia 2016, Media releases [www.insurancecouncil.com.au/media-centre]
IPCC 2007b, Climate Change 2007: Synthesis report, Contribution of Working Groups I, II and III to the Fourth Assessment Report of the Intergovernmental Panel on Climate Change, Pachauri RK & Reisinger A (eds), Geneva, Switzerland [www.ipcc.ch/publications_and_data/publications_ipcc_fourth_assessment_report_synthesis_report.htm]
IPCC, 2014, ‘Summary for policymakers’ In Climate Change 2014: Impacts, Adaptation, and Vulnerability. Part A: Global and Sectoral Aspects, Contribution of Working Group II to the Fifth Assessment Report of the Intergovernmental Panel on Climate Change, Field CB, Barros VR, Dokken DJ, Mach KJ, Mastrandrea MD, Bilir TE, Chatterjee M, Ebi KL, Estrada YO, Genova RC, Girma B, Kissel ES, Levy AN, MacCracken S, Mastrandrea PR & White LL (eds), Cambridge University Press, Cambridge, pp. 1–32
Jegasothy E, McGuire R, Nairn J, Fawcett R & Scalley, B 2017, ‘Extreme climatic conditions and health service utilisation across rural and metropolitan New South Wales, International Journal of Biometeorology, vol. 61, pp. 1,359–70
Kendon EJ, Ban N, Roberts NM, Fowler HJ, Roberts MJ, Chan SC, Evans JP, Fosser G & Wilkinson JM 2017, ‘Do Convection-Permitting Regional Climate Models Improve Projections of Future Precipitation Change?’ Bulletin of the American Meteorological Society, Boston, vol. 98, pp. 79–93 [https://doi.org/10.1175/BAMS-D-15-0004.1]
Keywood MD, Hibberd MF & Emmerson KM 2017, Australia State of the Environment 2016: Atmosphere, independent report to the Australian Government Minister for the Environment and Energy, Australian Government Department of the Environment and Energy, Canberra, doi: 10.4226/94/58b65c70bc372 [https://soe.environment.gov.au/theme/atmosphere]
Kinsela MA, Morris BD, Linklater M & Hanslow, DJ 2017, ‘Second-pass assessment of potential exposure to shoreline change in New South Wales, Australia, using a sediment compartments framework, Journal of Marine Science and Engineering, vol. 5, p. 61
Klamt M, Thompson R & Davis J 2011, ‘Early response of the platypus to climate warming’, Global Change Biology, vol. 17(10), pp. 3,011–8 [dx.doi.org/10.1111/j.1365-2486.2011.02472.x]
Lafleur DT, Forcey T, Saddler H & Sandiford M 2016, A review of current and future methane emissions, Melbourne Energy Institute, Reports and working papers [https://energy.unimelb.edu.au/__data/assets/pdf_file/0019/2136223/MEI-Review-of-Methane-Emissions-26-October-2016.pdf (PDF 2.5MB)]
Laurence WF, Dell B, Turton SM, Lawes MJ, Hutley LB, McCallum H, Dale P, Bird M, Hardy G, Prideaux G, Gawne B, McMahon CR, Yu R, Hero J-M, Schwarzkopf L, Krockenberger A, Douglas M, Silvester E, Mahony M, Vella K, Saikia U, Wahren C, Xu Z, Smith B & Cocklin C 2011, ‘The 10 Australian ecosystems most vulnerable to tipping points’, Biological Conservation, vol. 144(5), pp. 1,472–80 [dx.doi.org/10.1016/j.biocon.2011.01.016]
Leadley P, Pereira HM, Alkemade R, Fernandez-Manjarrés JF, Proença V, Scharlemann JPW & Walpole MJ 2010, Biodiversity Scenarios: Projections of 21st century change in biodiversity and associated ecosystem services, Technical Series no. 50, Secretariat of the Convention on Biological Diversity, Montreal, Canada [www.cbd.int/ts]
Lovejoy T and Nobre C 2018, ‘Amazon Tipping Points’, Science Advances, [http://advances.sciencemag.org/content/4/2/eaat2340]
Lucas C 2010, ‘On developing a historical fire weather data-set for Australia’, Australian Meteorological and Oceanographic Journal, vol. 60, pp. 1–14
Lüthi D, le Floch M, Bereiter B, Blunier T, Barnola J-M, Siegenthaler U, Raynaud D, Jouzel J, Fischer H, Kawamura K & Stocker T 2008, ‘High-resolution carbon dioxide concentration record 650,000–800,000 years before present’, Nature, vol. 453(7193), pp. 379–82
OECD 2017, Investing in Climate, Investing in Growth, The Organisation for Economic Co-operation and Development, Paris, [http://dx.doi.org/10.1787/9789264273528-en]
OEH 2011, Observed Changes in New South Wales Climate 2010, Office of Environment & Heritage, Sydney [www.climatechange.environment.nsw.gov.au/~/media/NARClim/Files/PDF%20resources/20110203obsnswclim2010.pdf (PDF 1.1MB)]
OEH 2014, NSW Climate Change Snapshot, Office of Environment & Heritage, Sydney [http://climatechange.environment.nsw.gov.au/~/media/8C0EFD5C6C584BA488DE0AF7DF67635C.ashx (PDF 7.5MB)]
OEH 2015a, Heatwaves Climate Change Impact Snapshot, Office of Environment & Heritage, Sydney [http://climatechange.environment.nsw.gov.au/Impacts-of-climate-change/Heat/Heatwaves]
OEH 2015b, Urban Heat Climate Change Impact Snapshot, Office of Environment & Heritage, Sydney [https://climatechange.environment.nsw.gov.au/Impacts-of-climate-change/Heat/Urban-heat]
OEH 2016, Eastern Seaboard Climate Change Initiative, East Coast Lows Research Program Synthesis for NRM Stakeholders, Office of Environment & Heritage, Sydney [http://climatechange.environment.nsw.gov.au/Impacts-of-climate-change/East-Coast-Lows]
Oliver EJ, Benthuysen JA, Bindoff NK, Hobday AJ, Holbrook NJ, Mundy CN & Perkins-Kirkpatrick SE 2017, ‘The unprecedented 2015/16 Tasman Sea marine heatwave’, Nature Communications vol. 8, 16101, [doi: 10.1038/ncomms16101]
Oliver EJ, Donat MG, Burrows MT, Moore PJ, Smale DA, Alexander LV, Benthuysen JA, Feng M, Sen Gupta A, Hobday AJ, Holbrook NJ, Perkins-Kirkpatrick SE, Scannell HA, Straub SC & Wernberg T 2018, ‘Longer and more frequent heatwaves over the past century’, Nature Communications vol. 9, 1324 [https://doi.org/10.1038/s41467-018-
Parker LM, Ross PM & O’Connor WA 2010, ‘Comparing the effect of elevated pCO2 and temperature on the fertilization and early development of two species of oysters’, Marine Biology, vol. 157, pp. 2,435–52
Parker LM, Ross PM, Connor WA, Pörtner HO, Scanes E & Wright JM 2013, ‘Predicting the response of molluscs to the impact of ocean acidification’, Biology, vol. 2, pp. 651
Parmesan C 2006, ‘Ecological and evolutionary responses to recent climate change’, Annual Review of Ecology, Evolution and Systematics, vol. 37, pp. 637–9
Parmesan C & Yohe G 2003, ‘A globally coherent fingerprint of climate change impacts across natural systems’, Nature, vol. 421(6918), pp. 37–42
Pecl GT, Doubleday Z, Ward T, Clarke S, Day J, Dixon C, Frusher S, Gibbs P, Hobday A, Hutchinson N, Jennings S, Jones K, Li X, Spooner D & Stoklosa R 2011, Risk assessment of impacts of climate change for key marine species in south eastern Australia. Part 2: Species profiles, Fisheries and Aquaculture Risk Assessment, Fisheries Research and Development Corporation, Canberra, Project 2009/070
Pfeil B, Pierrot D, Poulter B, Rehder G, Reimer J, Rödenbeck C, Schwinger J, Séférian R, Skjelvan I, Stocker BD, Tian H, Tilbrook B, Tubiello FN, van der Laan-Luijkx IT, van der Werf GR, van Heuven S, Viovy N, Vuichard N, Walker AP, Watson AJ, Wiltshire AJ, Zaehle S & Zhu D 2017, ‘Global Carbon Budget 2017’, Earth System Science Data, vol. 10, pp. 405–48 [https://doi.org/10.5194/essd-10-405-2018]
Pickering CM, Good RA & Green K 2004, The Ecological Impacts of Global Warming: Potential effects of global warming on the biota of the Australian Alps, Australian Greenhouse Office, Canberra
Poloczanska ES, Brown CJ, Sydeman WJ, Kiessling W, Schoeman DS, Moore PJ, Brander K, Bruno JF, Buckley LB, Burrows MT, Duarte CM, Halpern BS, Holding J, Kappel CV, O’Connor MI, Pandolfi JM, Parmesan C, Schwing F, Thompson SA & Richardson AJ 2013, ‘Global imprint of climate change on marine life’, Nature Climate Change, vol. 3, pp. 919–25 [doi:10.1038/nclimate1958]
Provost EJ, Coleman MA, Dworjanyn SA, Russell BD, Connell SD, Ghedini G, Gillanders BM, Figuiera W & Kelaher BP 2017, ‘Climate-driven disparities among ecological interactions threaten kelp forest persistence’, Global Change Biology, vol. 23(1), pp. 353–61
Qui Z, Coleman MA, Provost E, Campbell A, Kelaher BP, Dalton S, Thomas T, Steinberg PD & Marzinelli E (in review), ‘Future climate change affects the microbiome and condition of habitat-forming kelp’
Raupach MR, Gloor M, Sarmiento JL, Canadell JG, Frölicher TL, Gasser T, Houghton RA, Le Quéré C & Trudinger CM 2014, ‘The declining uptake rate of atmospheric CO2 by land and ocean sinks’, Biogeosciences, vol. 11, pp. 3,453–75
Rhein M, Rintoul SR, Aoki S, Campos E, Chambers D, Feely RA, Gulev S, Johnson GC, SJosey SA, Kostianoy A, Mauritzen C, Roemmich D, Talley LD & Wang F 2013, ‘Observations: Ocean’, In Climate Change 2013: The Physical Science Basis, Contribution of Working Group I to the Fifth Assessment Report of the Intergovernmental Panel on Climate Change [Stocker TF, Qin D, Plattner GK, Tignor M, Allen SK, Boschung J, Nauels A, Xia Y, Bex V & Midgley (eds)]. Cambridge University Press, Cambridge, pp. 255–316 [doi:10.1017/CBO9781107415324.010]
Ridgway KR 2007, ‘Long-term trend and decadal variability of the southward penetration of the East Australian Current’, Geophysical Research Letters, vol. 34, L13613 [dx.doi.org/ 10.1029/2007GL030393]
Ross PM, Parker L, O’Connor WA & Bailey EA 2011, ‘The impact of ocean acidification on reproduction, early development and settlement of marine organisms’, Water, vol. 3, 1005
Saunois M, Jackson RB, Bousquet P, Poulter B & Canadell JG 2016, ‘The growing role of methane in anthropogenic climate change’, Environmental Research Letters, vol. 11(12), [ https://iopscience.iop.org/article/10.1088/1748-9326/11/12/120207]
Scanes E, Parker LM, O’Connor WA & Ross PM, 2014, ‘Mixed effects of elevated pCO2 on fertilisation, larval and juvenile development and adult responses in the mobile subtidal scallop Mimichlamys asperrima (Lamarck, 1819)’, Plos One, e93649.
Scanes E, Parker LM, O’Connor WA, Stapp LS & Ross PM, 2017, ‘Intertidal oysters reach their physiological limit in a future high-CO2 world’, Journal of Experimental Biology, vol. 220(5), pp. 765–74
Sharples JJ, Cary GJ, Fox-Hughes P, Mooney S, Evans JP, Fletcher MS, Fromm M, Grierson PF, McRae R & Baker P 2016, ‘Natural hazards in Australia: extreme bushfire’, Climatic Change, vol. 139(1), pp. 85–99
Smale DA & Wernberg T 2013, ‘Extreme climatic event drives range contraction of a habitat-forming species’, Proceedings of the Royal Society of London B: Biological Sciences, vol. 280(1754), [ https://royalsocietypublishing.org/doi/full/10.1098/rspb.2012.2829?url_ver=Z39.88-2003&rfr_id=ori%3Arid%3Acrossref.org&rfr_dat=cr_pub%3Dpubmed&]
Steffen W 2009, Climate Change 2009: Faster change and more serious risks, Department of Climate Change, Canberra
Sweet WV, Koop RE, Weaver CP, Obeysekera J, Horton RM, Theiler ER & Zervas C 2017, Global and regional sea level rise scenarios for the United States, NOAA Technical Report, NOS CO-OPS 083 Silver Spring, MD
Telemeco RS, Elphick MJ & Shine R 2009, ‘Nesting lizards (Bassiana duperreyi) compensate partly, but not completely, for climate change’, Ecology, vol. 90, pp.17–22 [dx.doi.org/10.1890/08-1452.1]
Vergés A, Doropoulos C, Malcolm HA, Skye M, Garcia-Pizá M, Marzinelli EM, Campbell AH, Ballesteros E, Hoey AS, Vila-Concejo A & Bozec YM, 2016, ‘Long-term empirical evidence of ocean warming leading to tropicalization of fish communities, increased herbivory, and loss of kelp’, Proceedings of the National Academy of Sciences, vol. 113(48), pp.13,791–6
Walther GR, Post E, Convey P, Menzel A, Parmesan C, Beebee TJC, Fromentin JM, Hoegh-Guldberg O & Bairlein F 2002, ‘Ecological responses to recent climate change’, Nature, vol. 416(6879), pp. 389–95
Wearne LJ & Morgan JW 2001, ‘Recent forest encroachment into subalpine grasslands near Mount Hotham, Victoria, Australia’, Arctic, Antarctic, and Alpine Research, vol. 33(3), pp. 369–77
Wernberg T, Bennett S, Babcock RC, de Bettignies T, Cure K, Depczynski M, Dufois F, Fromont J, Fulton CJ, Hovey RK, Harvey ES, Holmes TH, Kendrick GA, Radford B, Santana-Garcon J, Saunders BJ, Smale DA, Thomsen MS, Tuckett CA, Tuya F, Vanderklift MA & Wilson SK 2016, ‘Climate driven regime shift of a temperate marine ecosystem’, Science, vol. 353(6295), pp. 169–72
Wernberg T, Russell BD, Moore PJ, Ling SD, Smale D, Campbell A, Coleman MA, Steinberg PD, Kendrick GA & Connell SD 2011 ‘Impacts of climate change in a global hotspot for temperate coastal biodiversity and ocean warming’, Journal of Experimental Marine Biology and Ecology, vol. 400, pp. 7–16
White NJ, Haigh ID, Church JA, Koen T, Watson CS, Pritchard TR, Watson PJ, Burgette RJ, McInnes KL, You ZJ & Zhang X 2014, ‘Australian sea levels: Trends, regional variability and influencing factors’, Earth-Science Reviews, vol. 136, pp. 155–74
Yang X, Yu B, Zhu Q & Liu DL 2016, ‘Predicting Changes of Rainfall Erosivity and Hillslope Erosion across New South Wales, Australia’, Journal of Earth Science & Climate Change, vol. 7, pp. 340 [https://doi.org/10.4172/2157-7617.1000340]