 Image source and description
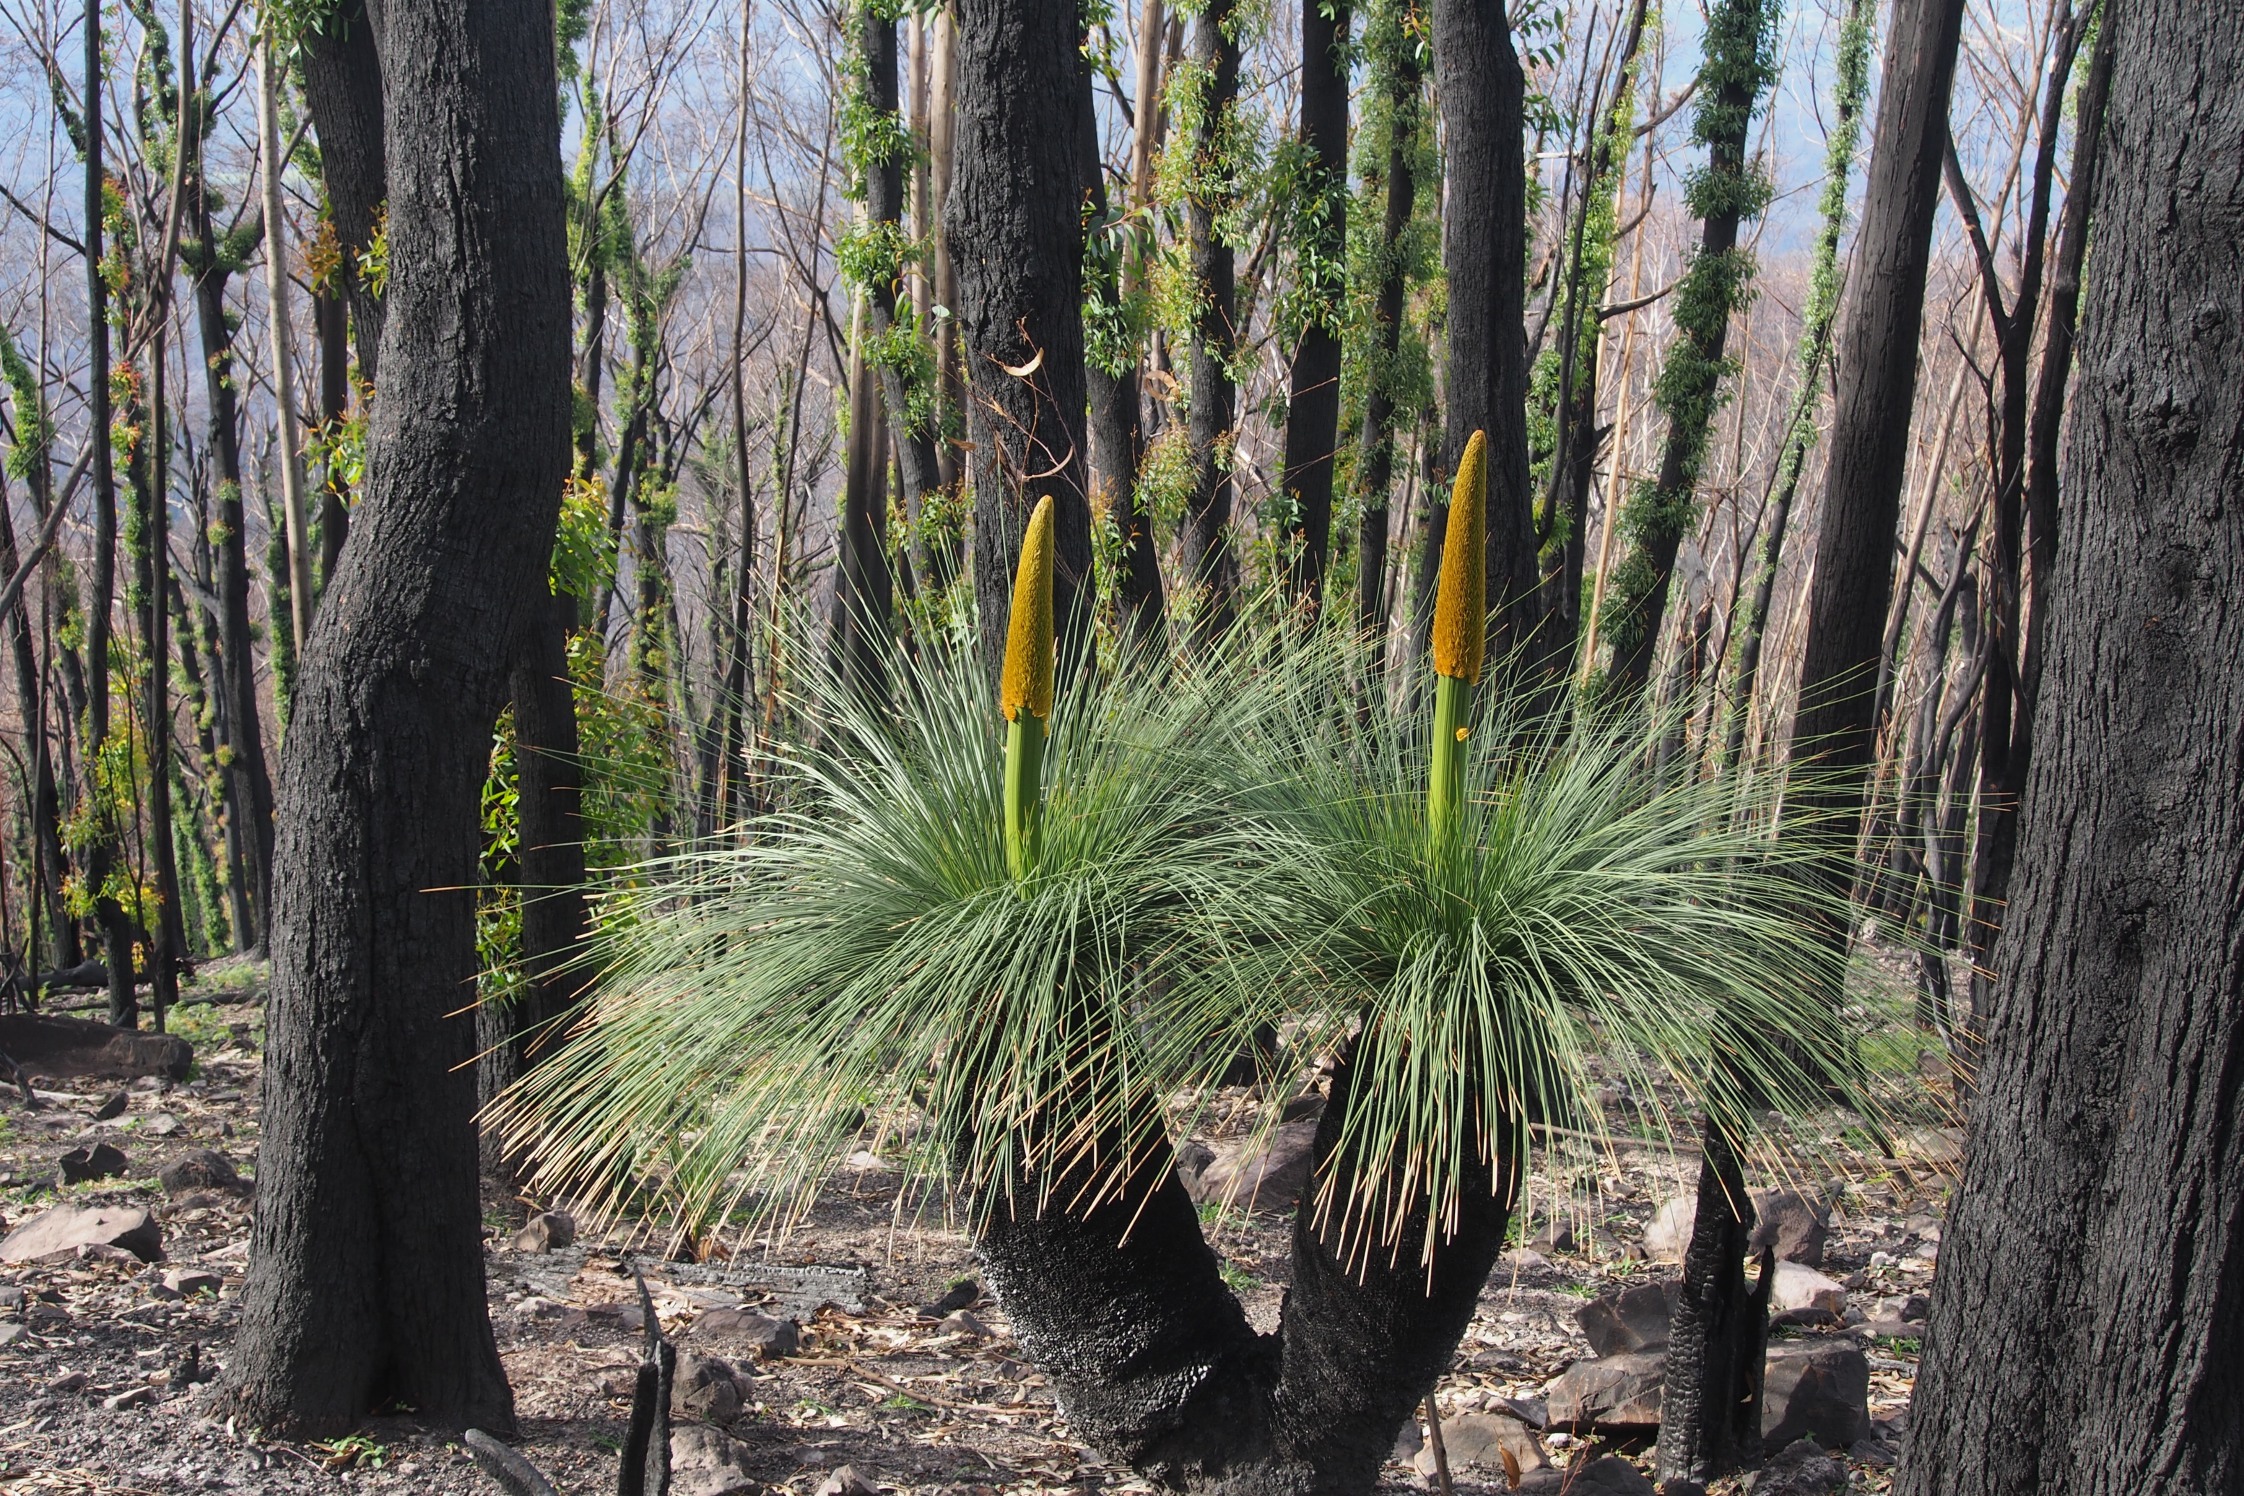
Topic image:Bidwell Country–Muswellbrook. Grass trees and Eucalypts re-sprout following the 2020 bushfires in Mt Imlay. Photo credit: Genevieve Wright/DCCEEW (2020)Banner image:Topic image sits above Butjin Wanggal Dilly Bag Dance by Worimi artist Gerard Black. It uses symbolism to display an interconnected web and represents the interconnectedness between people and the environment.
Image source and description
Topic image:Bidwell Country–Muswellbrook. Grass trees and Eucalypts re-sprout following the 2020 bushfires in Mt Imlay. Photo credit: Genevieve Wright/DCCEEW (2020)Banner image:Topic image sits above Butjin Wanggal Dilly Bag Dance by Worimi artist Gerard Black. It uses symbolism to display an interconnected web and represents the interconnectedness between people and the environment.
Plants
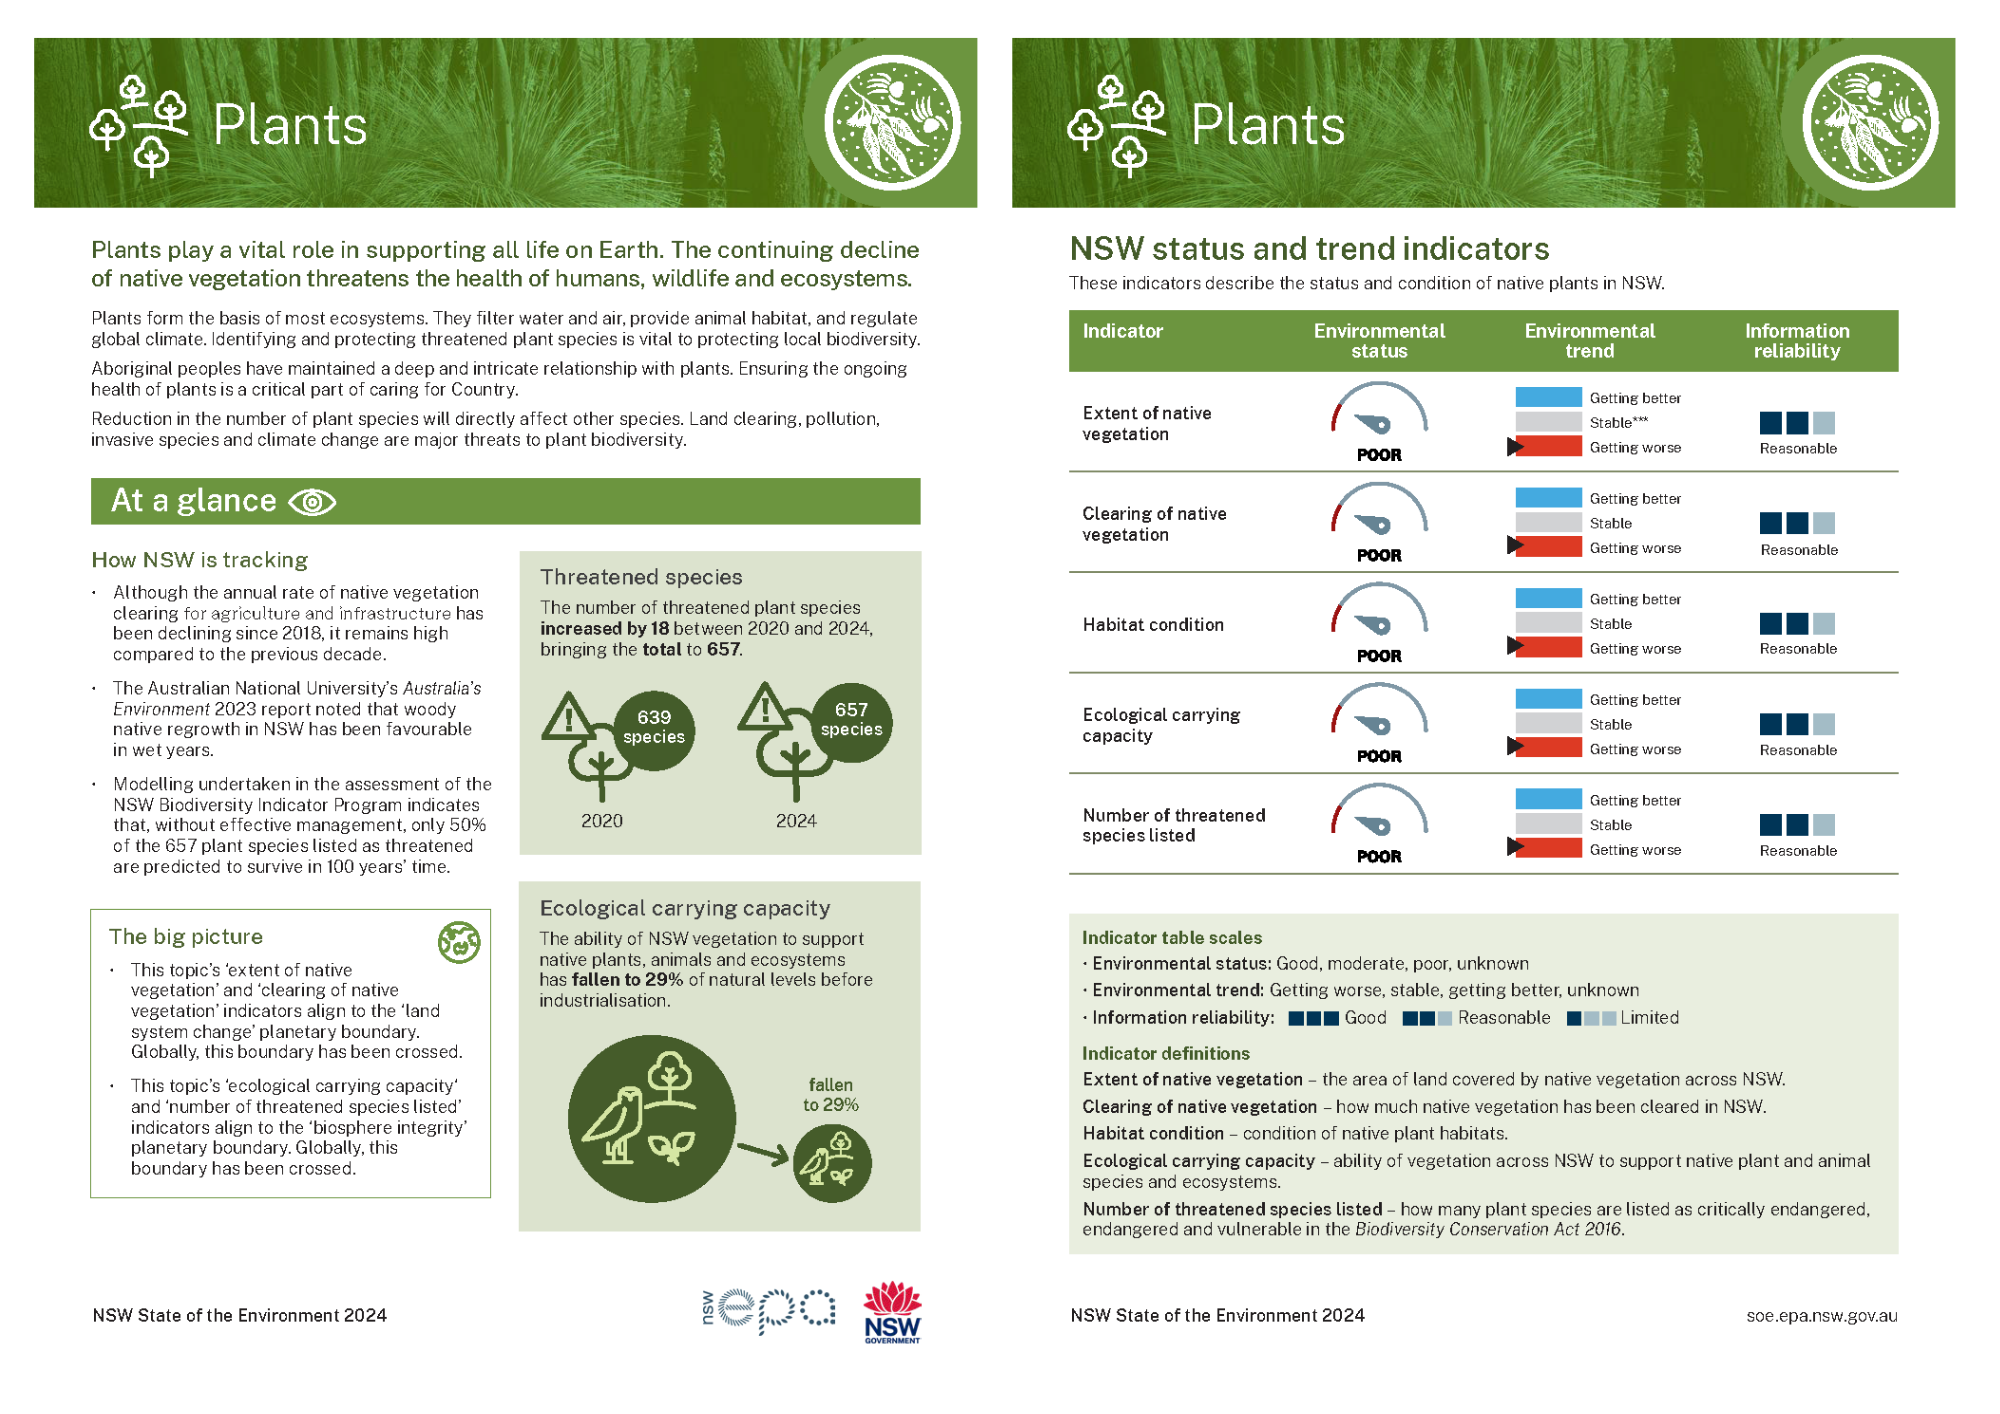
Plants play a vital role in supporting all life on Earth. The continuing decline of native vegetation threatens the health of humans, wildlife and ecosystems.
Topic report card
Read a two-page summary of the Plants topic (PDF 433KB).
Overview
Plants are essential for maintaining life on earth. Plants filter water, stabilise soils and provide vital animal habitat. They give other living beings food, fuel, medicine, fibre for clothes and material for shelter (). As living organisms, they also have their own intrinsic value ().
For millennia, Aboriginal peoples have maintained a deep and intricate relationship with plants, having developed scientific understandings of the often complex cultivation of plants for food, medicine and technology ().
Plants contribute to the comfort and wellbeing of other living beings. They provide shade in cities when there are few other features to protect against the sun. They also make human beings feel good. There are physical and mental benefits to spending time among trees and nature, and working in gardens ().
Plants take in energy from the sun, carbon dioxide from the air and water from the soil. They convert these into oxygen, which is released back into the air, and sugars, which contain carbon. They store these sugars in their stalks, tubers and leaves to use as food.
Forests are often referred to as ‘carbon sinks’, because the plants and trees in them remove and store more carbon than they produce (). This is how plants and trees help reduce overall greenhouse gas emissions.
See the topic for more information about carbon sinks.
This topic focuses on land-based plants.
Freshwater aquatic plants are discussed in the topic, and coastal and marine plants are considered in the topic.
Native vegetation
The plant species that occur naturally in a place are described as ‘native’. Plants that are native to a specific region and not found anywhere else are called ‘endemic’.
Australia has about 26,000 species of native plants (). This includes more than 6,000 native vascular plants (ferns, cycads, pines and flowering plants) in NSW (), of which about 1,300 are endemic ().
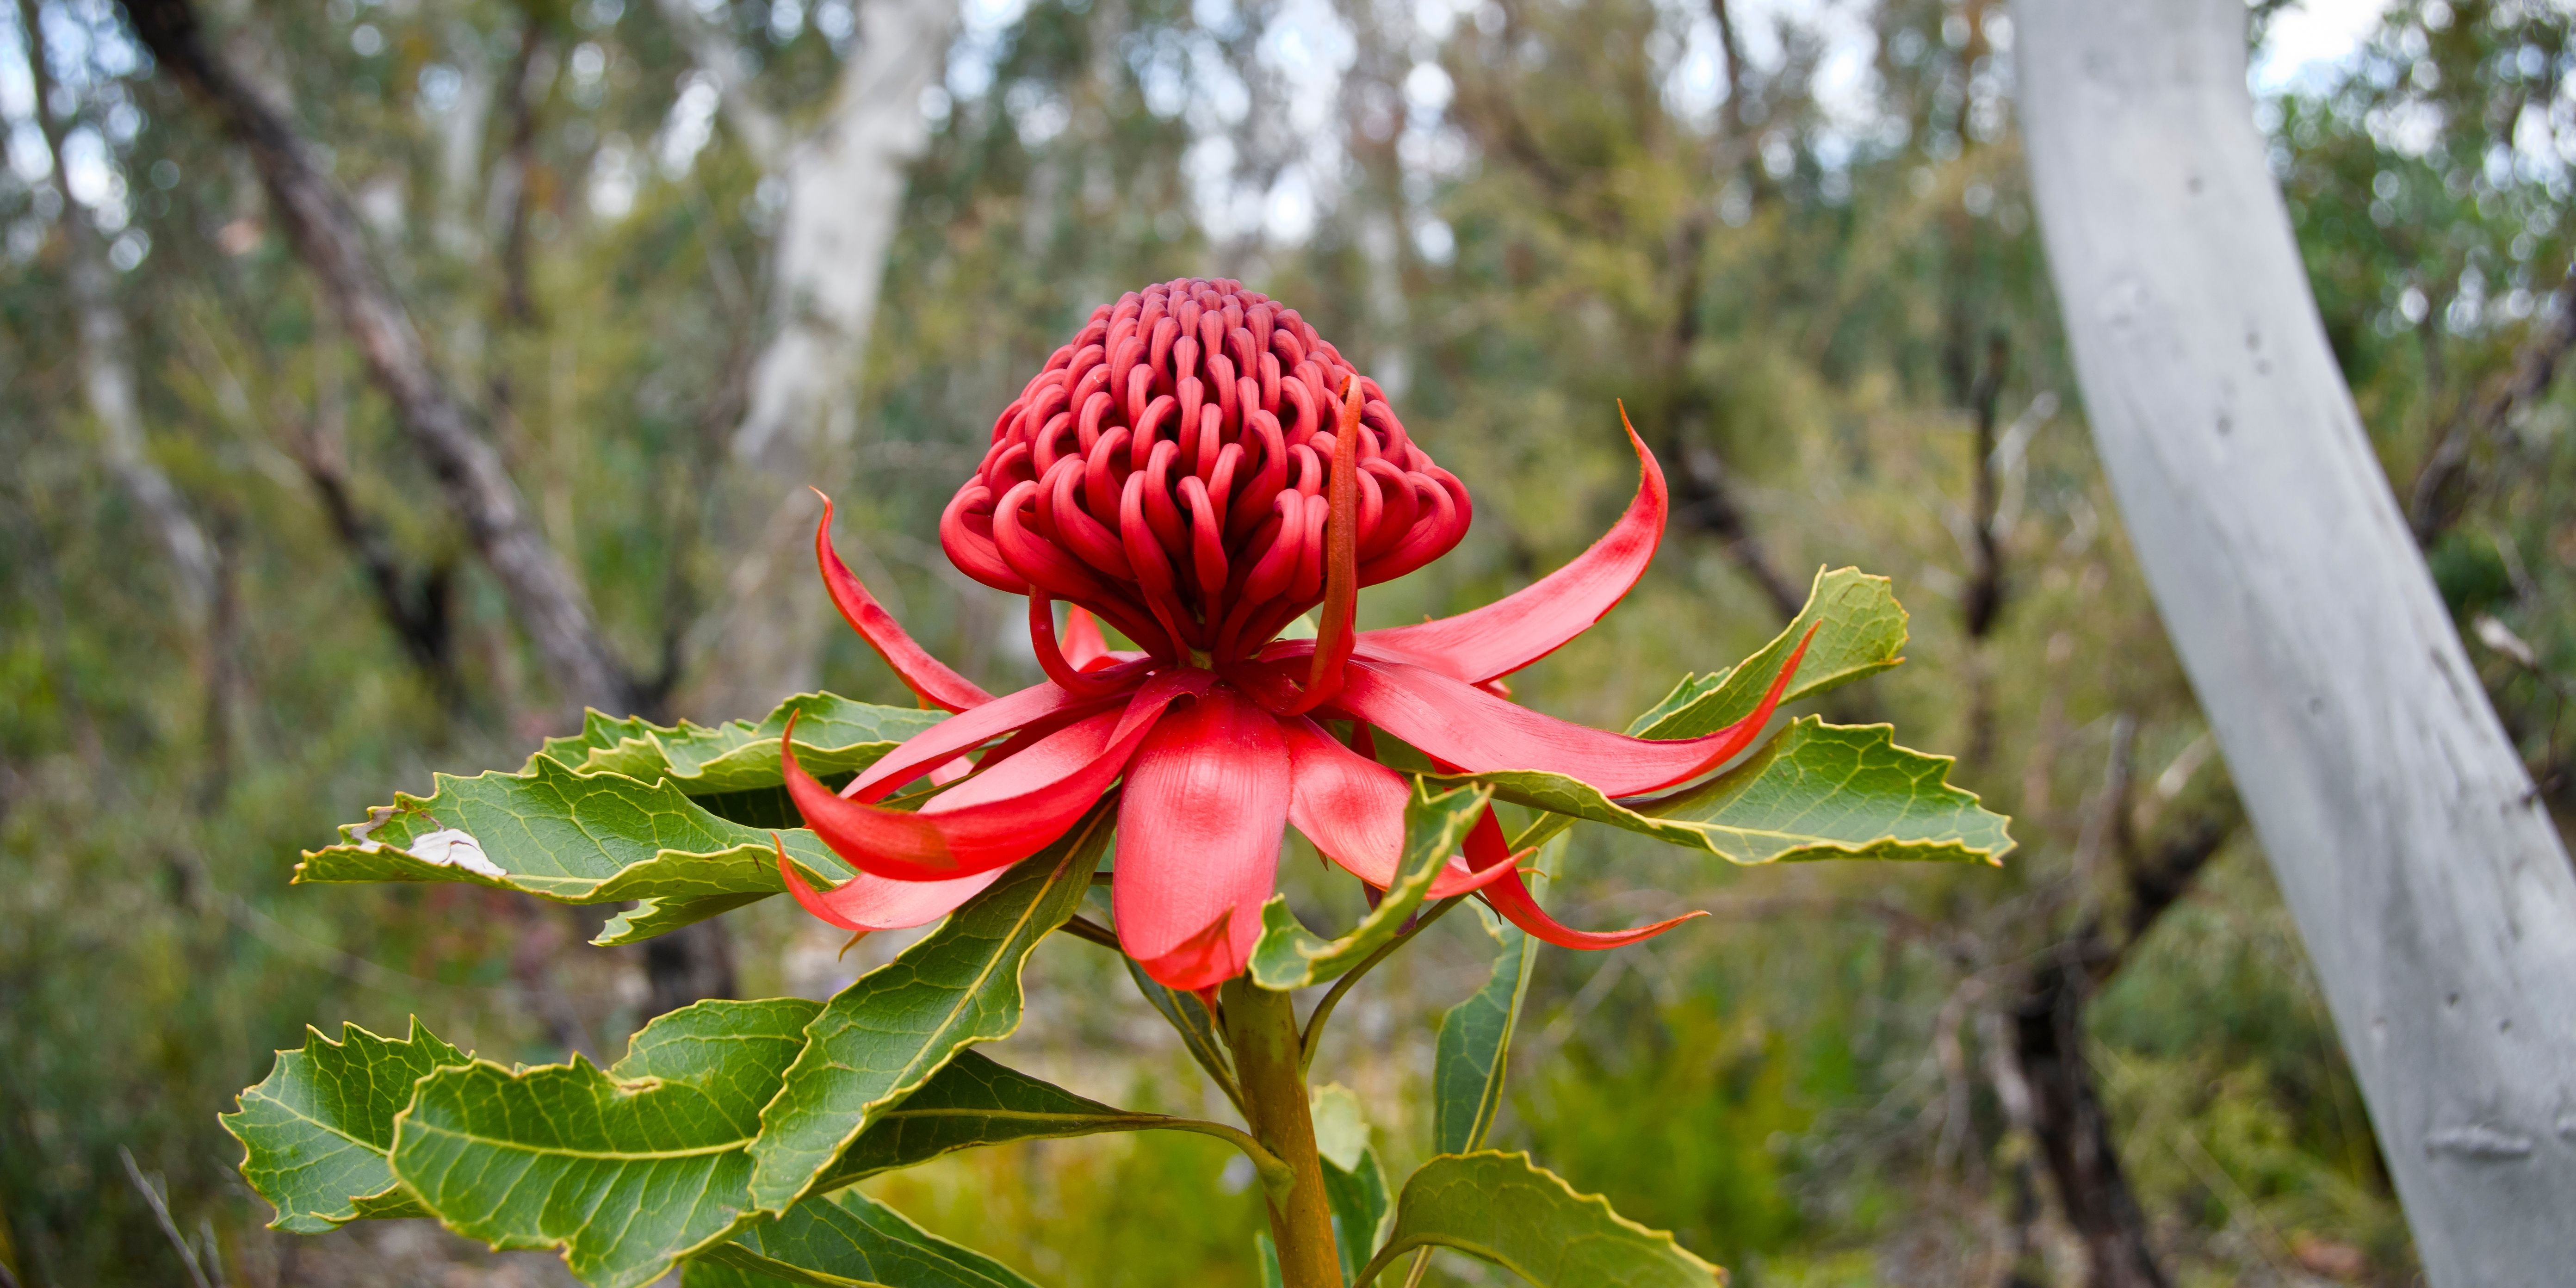
Image B1.1: Waratah in Gibraltar Range National Park
Notes:
Several species of waratah, including Telopea aspera (pictured) are endemic to NSW.
Many native plants have evolved to thrive in a unique and sometimes harsh climate through geological time ().
There is a long history of Aboriginal cultural burning working in harmony with native vegetation.
See ‘Cultural Fire management’ in the topic for more information on Cultural Burning.
Threats to native plants
Land management practices and policies in NSW have put native vegetation under enormous pressure, with clearing for agriculture mostly unregulated in the State before 1990 ().
The impacts of long-term land clearing and development have reduced the quantity and quality of native vegetation, while increasing the distance between remaining fragments.
More fragmented vegetation makes it hard for animals to move and plants to spread between areas to access resources and reproduce ().
Even when native vegetation regrows after disturbance, it can take some time for it to regain its full structure and provide suitable habitat.
Other pressures, including invasive weeds, disease and animal pests are further reducing vegetation quality.
Climate change is increasing these pressures, as well as increasing the risk of heatwaves, bushfires, droughts and floods.
Species may risk dying out if they:
- cannot tolerate or adapt to climate change
- cannot move or spread between areas of suitable habitat.
The result is a loss of biodiversity and declines in ecosystem health.
Ecosystems are communities of plants, animals and invertebrates that rely on each other for food, habitat, breeding and survival.
Within NSW, the ability of remaining habitats to support native plants, animals and ecosystems has dropped to 29% of their original capacity ().
Caring for Country
Plants are of immense importance to Aboriginal peoples. Plants are not only important sources of food, medicine and cultural material but ensuring the ongoing health of plants is a critical part of caring for Country.
For millennia, Aboriginal peoples have maintained a deep and intricate relationship with plants and developed complex botanical knowledge that was essential to the survival of the world’s oldest living culture ().
Ensuring the health of Country depends on a deep knowledge of how to look after plant species. For example, this includes understanding how introducing Cultural Fire to a landscape will impact on different plant species.
Knowledge of bush foods (bush tucker) has long been shared by Aboriginal peoples. More recently, evidence of the practice of native grain cultivation by Aboriginal peoples has been revealed and has inspired revival of these practices.
Aboriginal peoples may also look to life cycles of local plant species as indicators of seasonal changes and animal movements and migrations.
Find out how Wiradjuri people care for Country
See the topic and theme for more information about caring for Country.
Monitoring and classifying native vegetation
To manage and protect native vegetation in NSW, people need to understand its type, quantity (extent) and quality (condition and connectedness).
Native vegetation is monitored for a variety of reasons, including to:
- report annually on the loss of native vegetation due to clearing for agriculture, urban and industrial development, forestry, and infrastructure
- assess if land holders or developers are complying with land clearing regulatory requirements
- detect trends in the condition of native vegetation
- understand whether management actions have been effective in conserving or improving the quality and quantity of native vegetation.
To monitor the conservation status of native vegetation effectively and consistently, the NSW government has surveyed native vegetation on the ground using standardised methods.
Native vegetation is categorised into groups of plant species that grow together in the same place. The extent of these groups before clearing is extrapolated from existing vegetation remnants, geology, geomorphology, topography and other factors.
The resulting map is overlain with a map of the current extent of native vegetation to provide an estimate of the remaining extent for each type.
In NSW, native vegetation is classified into a three-level hierarchy, starting with the broadest classification at the top and working down to the most complex and detailed at the bottom, as follows:
- vegetation formations (broad groups with characteristics in common, such as grassy woodlands)
- vegetation classes (related plant communities)
- types of plant community (most detailed level).
Plant community types are the preferred ways of describing and discussing native vegetation in NSW. They form the basis for State Vegetation Type Maps, and are used to assess plant species’ biodiversity value in the Biodiversity Offsets Scheme.
The NSW Government’s vegetation mapping and landcover data collections and imagery help to measure, monitor and compare the type, extent and condition of vegetation and land use across NSW.
See the landcover science website for more information.
State Vegetation Type Mapping includes analysis of how much native vegetation remains in NSW. Vegetation mapping can also be accessed in the Trees Near Me NSW app.
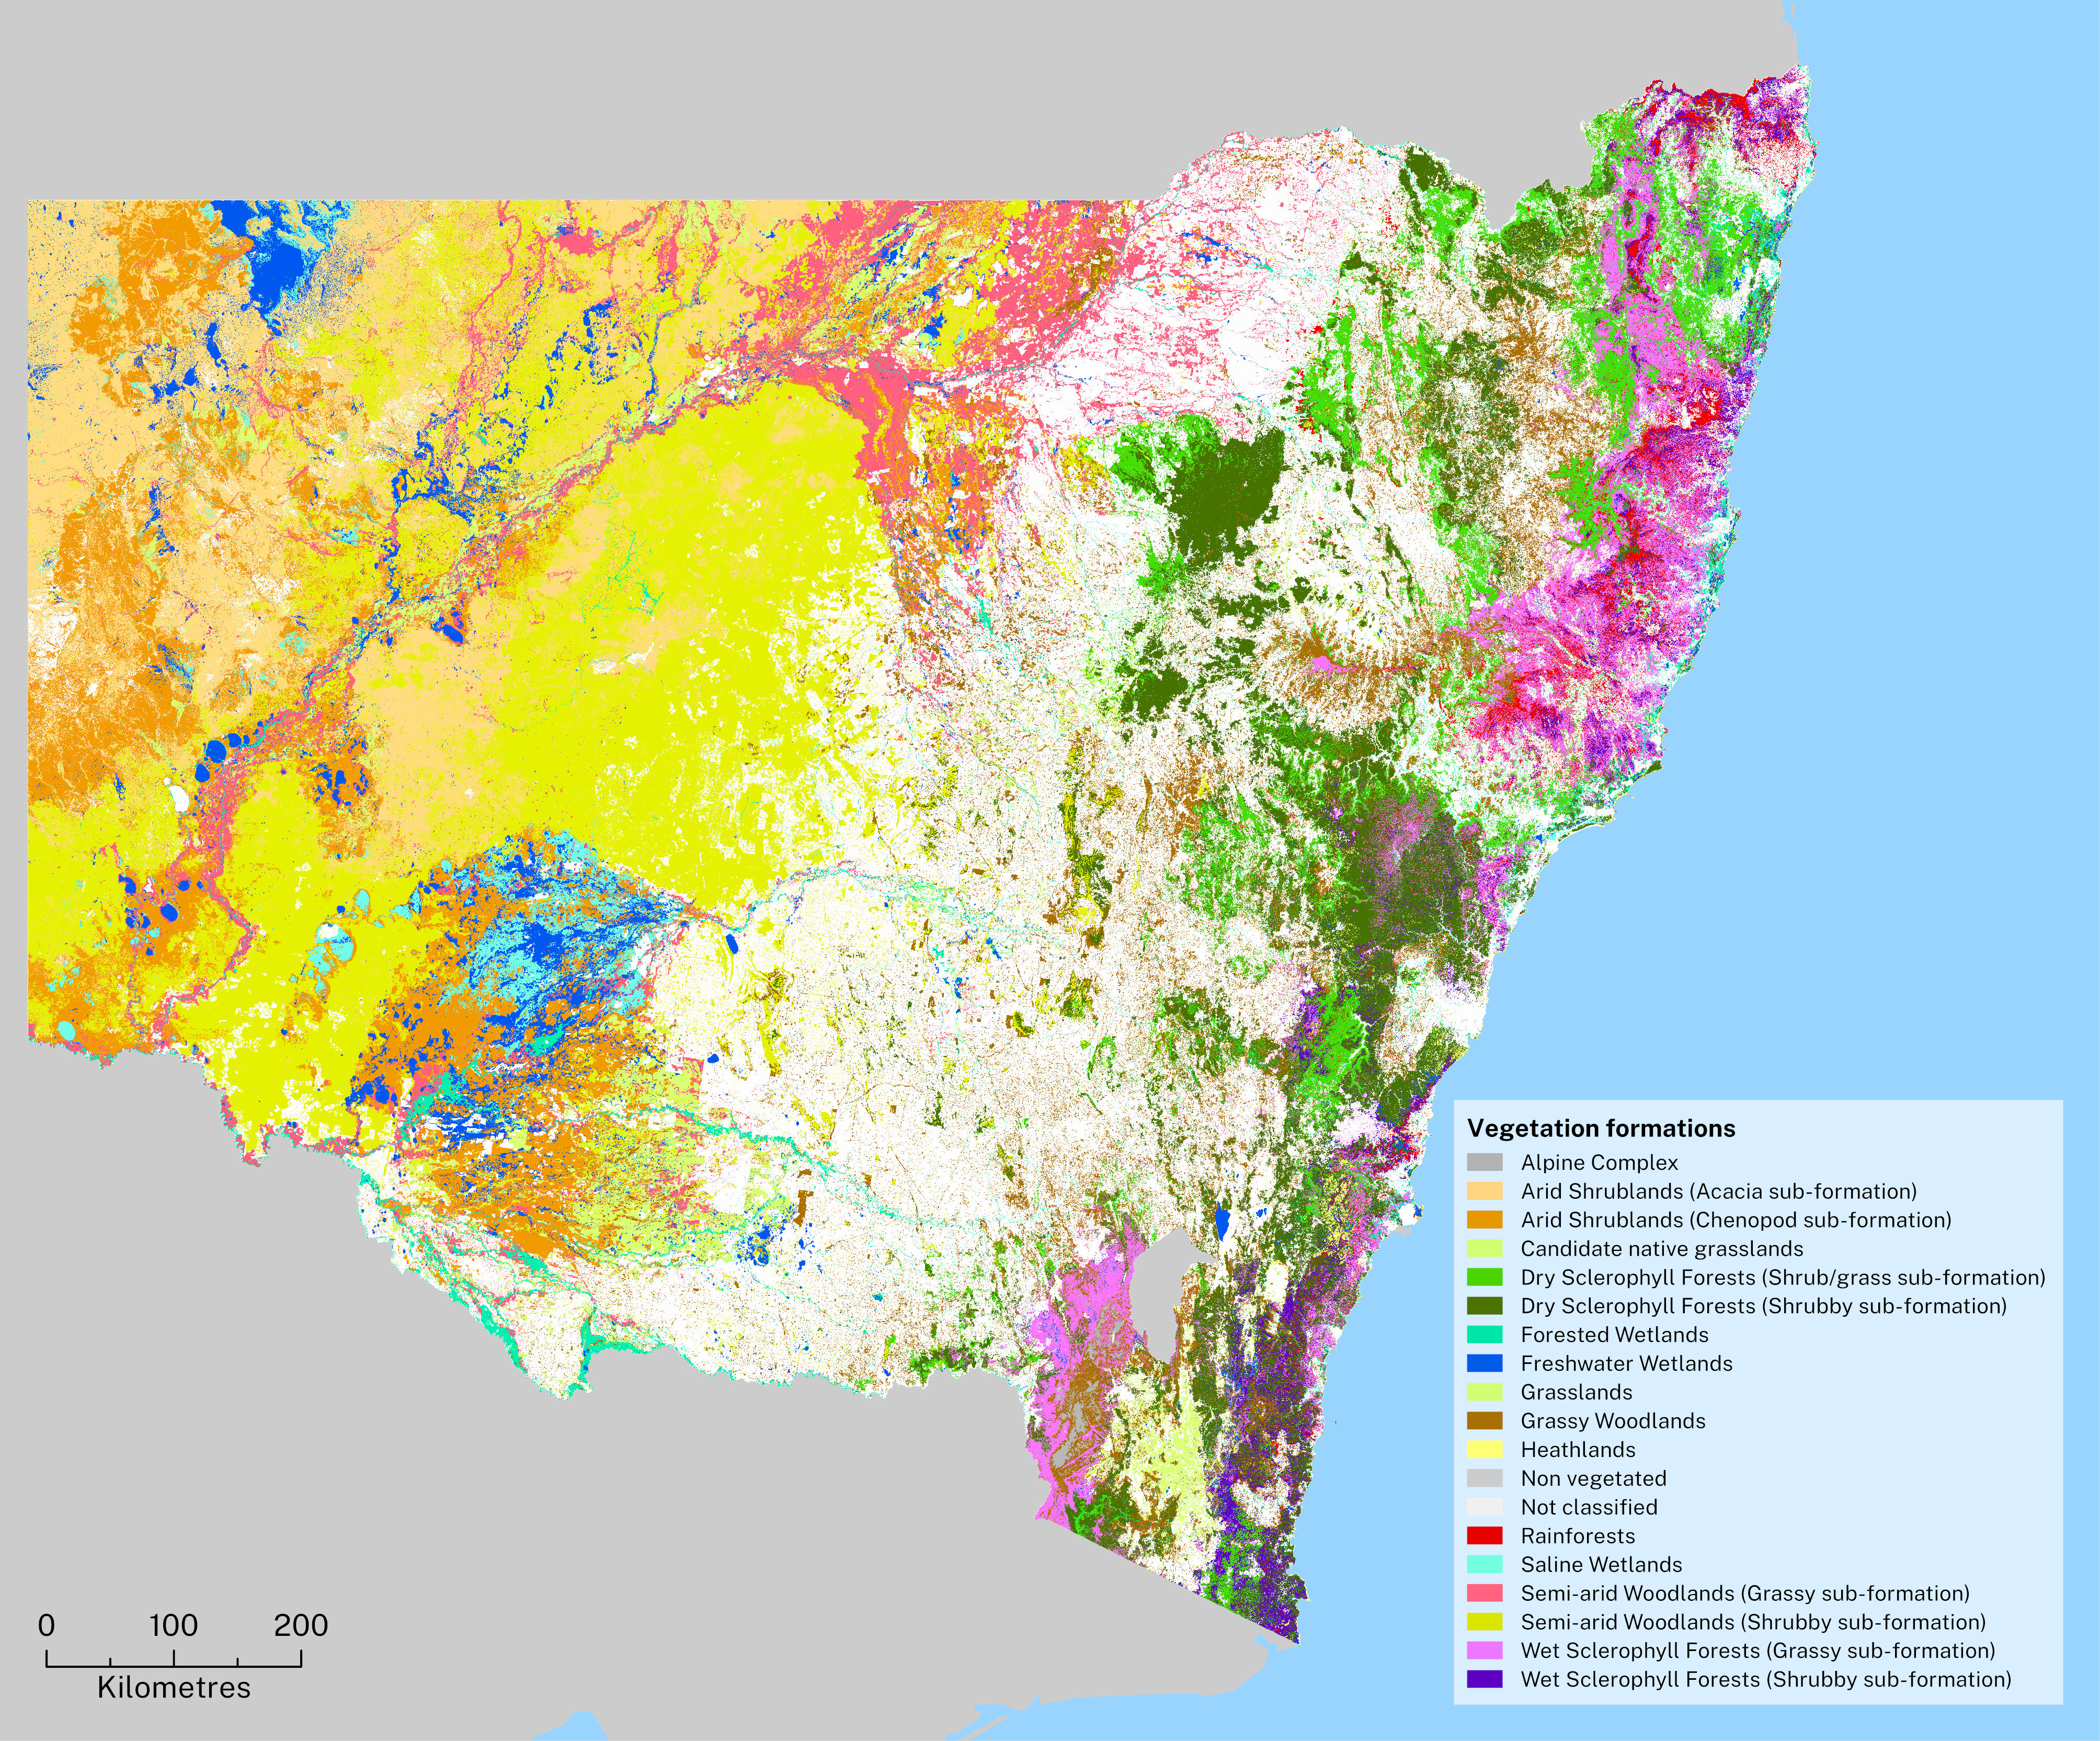
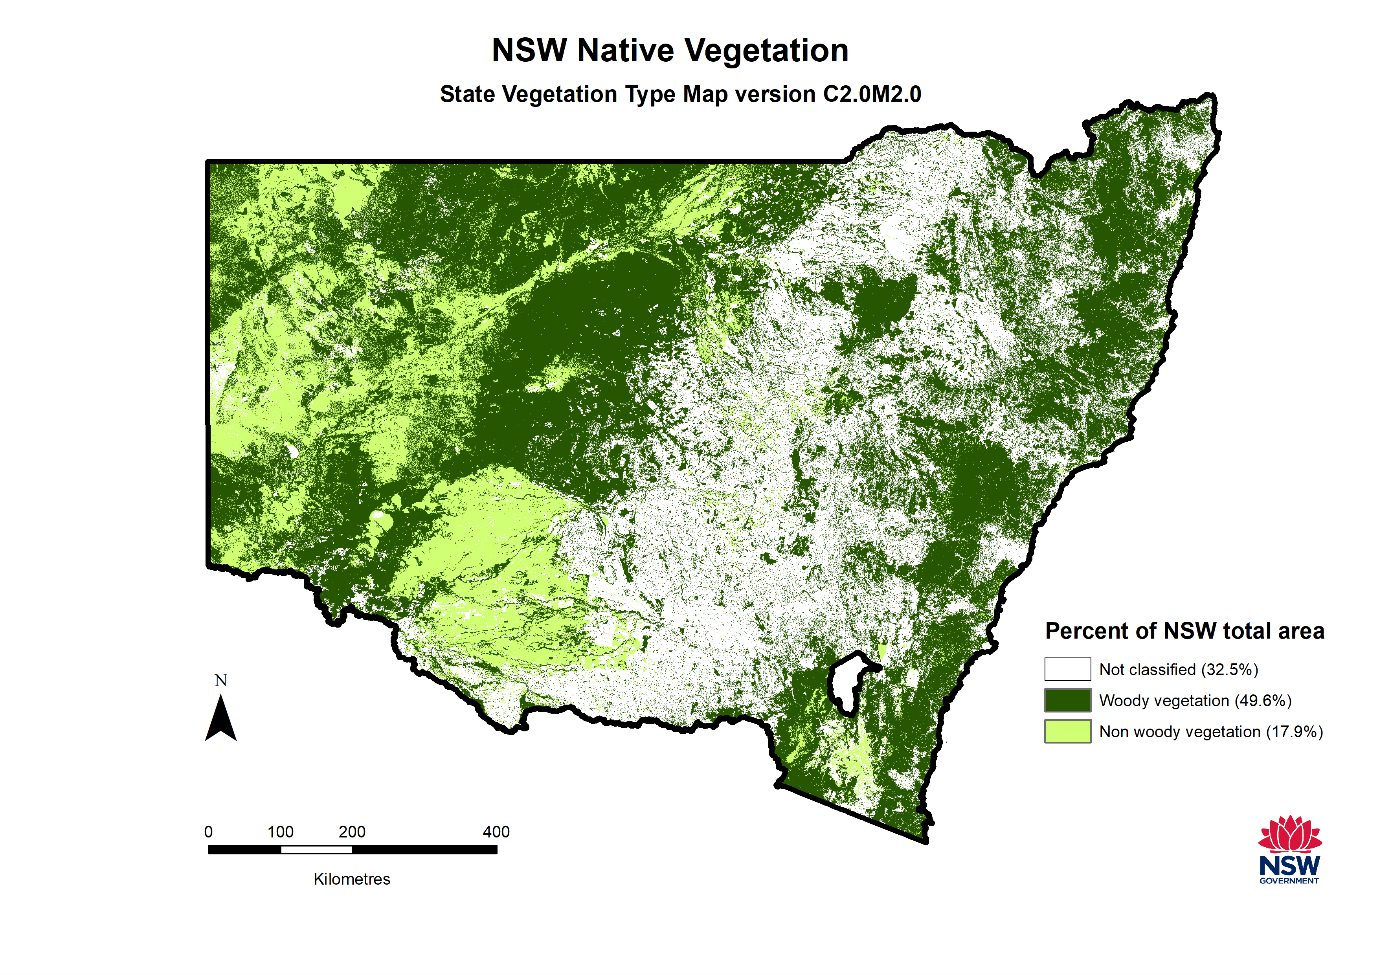
The State Vegetation Type Map is the most complete and consistent representation of the distribution of plant community types across NSW. Map B1.1 shows vegetation formations – broad groups of plants distinguished by major structural and physiognomic features (relating to physical appearance or form).
The areas shown in white are predominately used for infrastructure, housing and agriculture and therefore are not assigned a native vegetation formation (see ‘Extent of Native Vegetation’).
Protecting and repairing native vegetation
Protections for native vegetation under NSW legislation include, but are not limited to:
- public conservation areas reserving native vegetation
- identification and protection of vulnerable native vegetation on public lands
- identification and protection of threatened species and ecological communities on private and public land
- government investment in private land conservation
- regulation of land clearing
- regulation of native forestry on public and private land
- fire, water, disease, pest and weed management requirements
- offsetting impacts of clearing or development through the Biodiversity Offsets Scheme.
See the topic for more information.
Table B1.1 outlines key legislation and policies related to protecting and managing native vegetation in NSW.
Table B1.1: Current key legislation and policies relevant to native vegetation in NSW
| Legislation or policy | Purpose |
|---|---|
| Biodiversity Conservation Act 2016 | Aims to protect biodiversity and fosters a productive, resilient environment while enabling ecologically sustainable development |
| Environmental Planning and Assessment Act 1979 | Governs planning administration and laws, development assessments, building certification, infrastructure finance, appeals and enforcement. It is the primary land use planning statute in NSW. |
| Forestry Act 2012 | Provides for the dedication, management and sustainable use of State forests and other Crown-timber land for forestry and other purposes. Establishes the framework for integrated environmental approvals for native forestry operations on Crown timber lands |
| Local Land Services Act 2013 | Governs management of natural resources, biosecurity and agricultural production on private rural land. Part 5A of the Act sets out rules for managing native vegetation on farms. Part 5B sets out the rules for private native forestry |
| National Parks and Wildlife Act 1974 | Aims to conserve the natural and cultural heritage of the state of New South Wales through the establishment of national parks and reserves |
| Native Title (NSW) Act 1994 | Sets out how native title rights must be recognised and protected |
| National Parks and Wildlife Regulation 2019 | Governs the use of national parks and other land managed under the National Parks and Wildlife Act 1974 |
| Land Management (Native Vegetation) Code 2018 (PDF 1.5MB) | Helps landholders manage land, ensuring more productive farming methods while responding to environmental risks |
| NSW Biodiversity Offsets Scheme | Offsets impacts on biodiversity from development through landholder stewardship agreements (agreements to conserve land) |
| Private Native Forestry Codes of Practice | Guides farm forestry operations in NSW and set minimum operating standards for actively managing farm forests in line with ecologically sustainable forest management |
| State Environmental Planning Policy (Biodiversity and Conservation) 2021 | Chapter 2 regulates clearing of native vegetation in urban areas and land zoned for environment protection. Chapters 3 and 4 regulate development on land that has koala habitat. |
Notes:
See the Responses section of this topic for more information about how protection of native plants is managed in NSW.
In 2023 two key pieces of legislation were reviewed: the native vegetation provisions of the Local Land Services Act 2013, and the Biodiversity Conservation Act 2016.
Related topics: | | | | | |
Status and trends
Plants indicators
This report uses five indicators to assess:
- the extent, condition and clearing of native vegetation in NSW
- the capacity of the land to support biodiversity and habitat
- how many native plant species are considered threatened.
The assessments of status and environmental trend are based on long-term data. All are assessed as poor and getting worse.
These indicators are:
- Extent of native vegetation reports on the area of land covered by native vegetation across NSW. This is assessed as getting worse, because even though the last three years show little change, continued clearing suggests that the extent is still declining (see Extent of native vegetation).
This indicator aligns to the ‘land system change’ planetary boundary. Globally, this boundary has been crossed (see ). - Clearing of native vegetation reports on how much native vegetation has been cleared in NSW for agriculture and infrastructure. Although area cleared annually has been declining since 2018, it remains high compared to the previous decade (see Native vegetation clearing).
This indicator aligns to the ‘land system change’ planetary boundary. Globally, this boundary has been crossed (see ). - Habitat condition reports on the condition of native plant habitats. While recent data suggests short-term improvements in vegetation condition following increased rainfall, this indicator is assessed as getting worse based on long-term averages and poor ecological carrying capacity (see Habitat condition).
- Ecological carrying capacity reports on the ability of vegetation across NSW to support native plant and animal species and ecosystems. This was relatively stable in the decade before the 2019–20 bushfires but has since deteriorated along the east coast (see Ecological carrying capacity).
This indicator aligns to the ‘biosphere integrity’ planetary boundary. Globally, this boundary has been crossed (see ). - Number of threatened species listed indicates how many plant species are listed as critically endangered, endangered and vulnerable in the Biodiversity Conservation Act 2016. This is assessed as getting worse, because the number of listings has increased by 18 since 2020 (see Threatened plant species).
This indicator aligns to the ‘biosphere integrity’ planetary boundary. Globally, this boundary has been crossed (see ).
Table B1.2: Plant indicators
| Indicator | Environmental status | Environmental trend | Information reliability |
|---|---|---|---|
| Extent of native vegetation | Getting worse | Reasonable* | |
| Clearing of native vegetation** | Getting worse | Reasonable* | |
| Habitat condition | Getting worse | Reasonable | |
| Ecological carrying capacity | Getting worse | Reasonable | |
| Number of threatened species listed*** | Getting worse | Reasonable |
Notes:
* A method for measurement of regrowth is being developed – see Responses section
** This indicator is based on clearing of native vegetation for agriculture and infrastructure and the assessment includes consideration of long-term trends.
*** Threatened species encompasses those listed as critically endangered, endangered and vulnerable in the Biodiversity Conservation Act 2016.
Indicator table scales:
- Environmental status: Good, moderate, poor, unknown
- Environmental trend: Getting better, stable, getting worse
- Information reliability: Good, reasonable, limited.
See to learn how terms and symbols are defined.
See the page for more information about how indicators align.
Extent of native vegetation
Vegetation extent means the amount of land covered in native vegetation, measured as a percentage of the total area ().
Native vegetation consists of woody and non woody vegetation.
- Woody vegetation refers to trees and other plants taller than two metres.
- Non woody vegetation includes natural native grasses, small shrubs, herbs and groundcover ().
- Derived native grasslands – cleared areas that were previously forest or woodlands.
The vegetation classes are identified through satellite imagery and are modelled and mapped using Geographic Information System (GIS) tools.
As at December 2023 (see Map B1.2):
- 49.6% of NSW retains woody native vegetation, compared to 49.8% in 2021
- 17.9% of NSW retains non woody native vegetation, compared to 19% in 2021, excluding derived grasslands.
The remaining 32.5% of the State’s land area is categorised as ‘not classified’ and includes:
- areas that grow after the original native vegetation has been cleared, and may have some native vegetation and some weeds
- derived grasslands (primarily non woody vegetation)
- farmed land with crops, plantations and pasture
- areas with no plant cover at all
- developed land.
Map B1.2: Extent of native vegetation coverage in NSW as at December 2023
Notes:
This map does not include derived native grasslands.
Clearing since European colonisation
Recent independent research finds that 46% of the forests and woodlands existing prior to European colonisation remain (). This aligns with the findings of the NSW State Vegetation Type Map (SVTM) reported above (Map B1.2).
The SVTM calculates that 11 vegetation classes (related groups of vegetation) have lost more than 70% of their original extent since before clearing began (; ) (see Table B1.3).
The largest proportion of clearing has occurred in:
- the inland Riverine Plain Woodlands along the plains of the Macquarie, Murrumbidgee, Lachlan and Murray rivers
- the Cumberland Dry Sclerophyll Forests of the west and south-west Sydney basin
- the Southern Tableland Grassy Woodlands and Western Slopes Grassy Woodlands to the west of the Great Dividing Range.
Table B1.3: Vegetation classes with more than 70% of vegetation cleared
| Vegetation class | Percentage cleared |
|---|---|
| Riverine Plain Woodlands | 88 |
| Cumberland Dry Sclerophyll Forests | 86 |
| Southern Tableland Grassy Woodlands | 84 |
| Tableland Clay Grassy Woodlands | 83 |
| Western Slopes Grassy Woodlands | 80 |
| Temperate Montane Grasslands | 77 |
| Floodplain Transition Woodlands | 75 |
| Western Vine Thickets | 75 |
| Riverine Sandhill Woodlands | 73 |
| Coastal Valley Grassy Woodlands | 71 |
| North-west Alluvial Sand Woodlands | 71 |
Notes:
Pre-clearing is the reference point for mapping and modelling this data (Roff et al. 2022).
Click the links in the table to learn more about each vegetation class.
Clearing of native vegetation
‘Clearing’ in relation to native vegetation is defined under the Local Land Services Act 2013 as any one or more of the following:
- cutting down, felling, uprooting, thinning or otherwise removing native vegetation
- killing, destroying, poisoning, ringbarking or burning native vegetation.
The NSW Government has mapped, monitored and reported on landcover loss since 2009 (with data available from 1988). It has used satellite imagery, with human interpretation and validation, to detect and report change in native vegetation cover every year.
This data does not currently include information about rates of regrowth. The NSW plan for nature commits to monitoring net change in future.
Clearing for infrastructure and agriculture
In 2022, 17,791 hectares of native woody vegetation was cleared for agriculture and infrastructure across NSW (see Figure B1.1).
Clearing in this figure includes all detectable woody clearing, which may include the clearing of invasive native species.
Figure B1.1: Clearing of native woody vegetation for agriculture and infrastructure in NSW, from 2009 to 2022
Notes:
Native vegetation was managed under the Native Vegetation Act 2003 until 25 August 2017. After this date, it was managed under the Land Management Framework, except for clearing related to existing approvals under previous legislation.
Land clearing continues to have a significant environmental impact. Since 2009, a total of 201,300 hectares of native vegetation has been cleared for agriculture (see Figure B1.2).
The cumulative rates of clearing for agriculture shown in Figure B1.2 includes clearing of invasive native species and management of woody regrowth on existing agricultural land authorised under the Land Management (Native Vegetation) Code 2018 or previous legislation.
Figure B1.2: Cumulative native woody vegetation clearing for agriculture and infrastructure in NSW, from 2009 to 2022
Notes:
Approximately 0.3% of agricultural clearing is invasive species cleared more than once.
Native forest harvesting
Native forestry operations are subject to a distinct regulatory framework compared to urban, agricultural, or infrastructure-related clearing. Because these operations include a requirement to regenerate harvested areas with native vegetation, they are not classified as permanent clearing.
Harvesting operations on Crown land (public land), mainly in State forests, are regulated in accordance with Ecologically Sustainable Forest Management (ESFM) principles as set out in the NSW Forestry Act 2012 and Regional Forest Agreements. Harvesting limits and conditions protecting key environmental features and threatened species and ecosystems are set out in Integrated Forestry Operations Approvals (IFOAs).
The rules for conducting native forestry on private land are set out in four Private Native Forestry Codes of Practice established under the Local Land Services Act 2013. Rates of native forestry harvesting have declined by 61% since 2017 (see Figure B1.3).
Figure B1.3: Rates of public and private native forest harvesting in NSW, from 2009 to 2022
Notes:
The chart shows native woody vegetation clearing for public and private native forestry only, it excludes plantations. Woody vegetation change related to plantation forestry can be found in the dashboard.
Native forestry on public land, conducted mostly in State forests, is managed by the Forestry Corporation of NSW and regulated by the NSW Environment Protection Authority (EPA). Native forestry on private rural land is regulated by Local Land Services and the EPA.
Landholders and forest managers must regenerate or revegetate harvested areas.
- Regeneration happens when harvesting and other actions create the conditions to support seed germination and forest growth. Actions that support regeneration to occur can include burning, ground disturbance, weeding and removing grazing animals to allow native vegetation to grow back.
- Revegetation happens when the conditions aren’t suitable to support natural regeneration. Actions such as planting seeds or seedlings, weeding and removing grazing animals support revegetation.
See this fact sheet on regeneration and revegetation (PDF 699KB) for more information.
Impacts of clearing on native vegetation types
Native vegetation clearing in NSW since European colonisation has had a varying impact on the extent and condition of native vegetation in different regions across the State.
Clearing for agriculture continues in already heavily cleared areas of central NSW and extending west and north. The impact of clearing for urban purposes is most intense across northern forested wetlands, the Hunter Valley and the Sydney Basin.
Grassy woodlands are the most threatened vegetation formation in NSW. Only 22% of grassy woodlands and 34% of arid grassy woodlands remain in the State ().
Examples of grassy woodland communities that have been listed under the Biodiversity Conservation Act 2016 as Endangered Ecological Communities (due to extensive clearing for agriculture) include grassy box and coolabah woodlands.
Gum-Coolabah and Poplar Box woodlands across central western NSW continue to be heavily impacted by land clearing (see Map B1.3).
Clearing, fragmentation, and loss of understorey is widespread and substantial across most central-western NSW plant communities. Together with weeds and intensive grazing by feral animals, such as goats and rabbits, these pressures are likely to lead to further biodiversity declines without intervention.
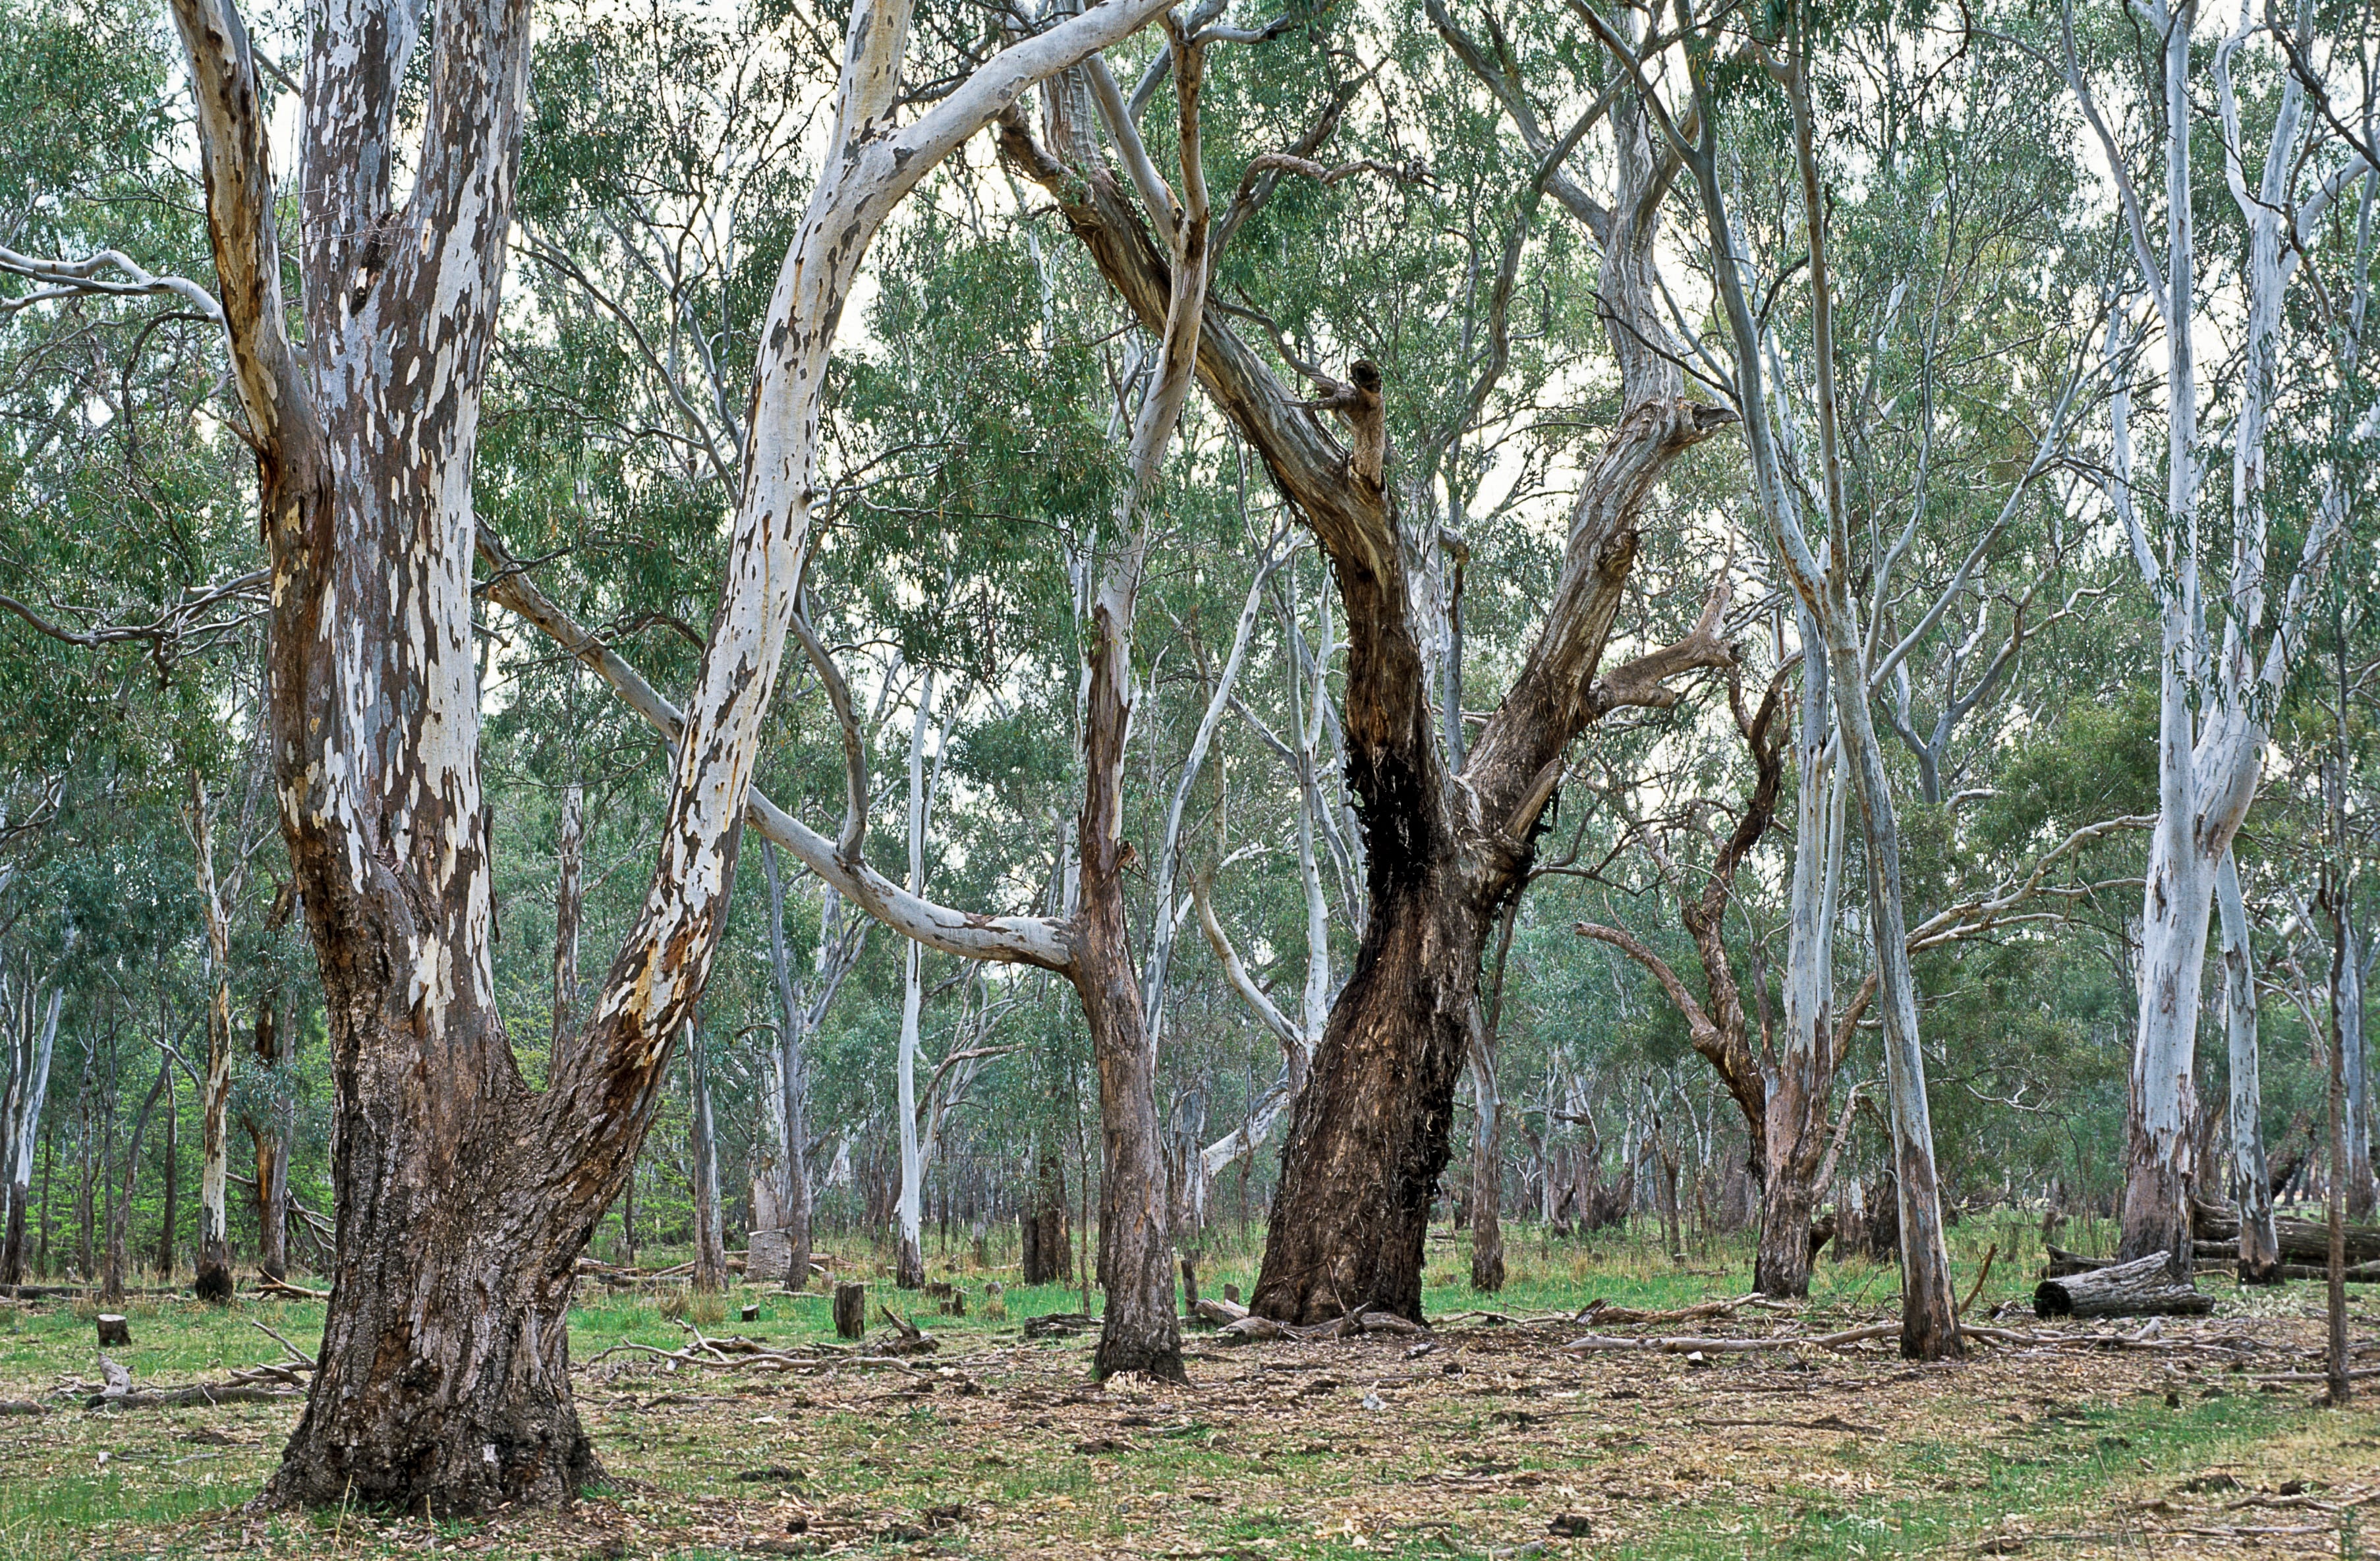
Image B1.2: Yellow Box and Blakely’s Red Gum Grassy Woodlands
Notes:
Yellow Box and Blakely’s Red Gum Grassy Woodlands have been listed as a critically endangered ecological community.
Natural native grasslands have been extensively cleared or modified, with only 35% of their original extent left across the north-west slopes, Hunter Valley, Northern Tablelands, Southern Tablelands and Riverina.
Natural native grasslands of the Gwydir, Liverpool Plains and Monaro have less than 10% of their original extent left and are highly altered and fragmented.
Rainforests in low-lying areas (coastal floodplains) have historically been extensively cleared, with 17% of plant community types in these areas considered currently of high conservation concern ().
Rainforests in more rugged terrain are largely intact, although changes in structure and species composition have occurred in areas where trees have been harvested or burnt.
The 2019–20 bushfires significantly impacted the eastern seaboard rainforests margins where little fire had been previously recorded. Many burnt margins resulted in a loss of rainforest.
Coastal floodplain forest is under pressure from coastal development, particularly the northern paperback floodplain forests and forest in the Sydney hinterland and Upper Hunter regions.
Semi-arid tall shrublands are under pressure from dryland cropping and grazing from farming and feral animals. About 70% remain.
Heathlands are still largely intact, although most of those in the Sydney region have been impacted by housing development ().
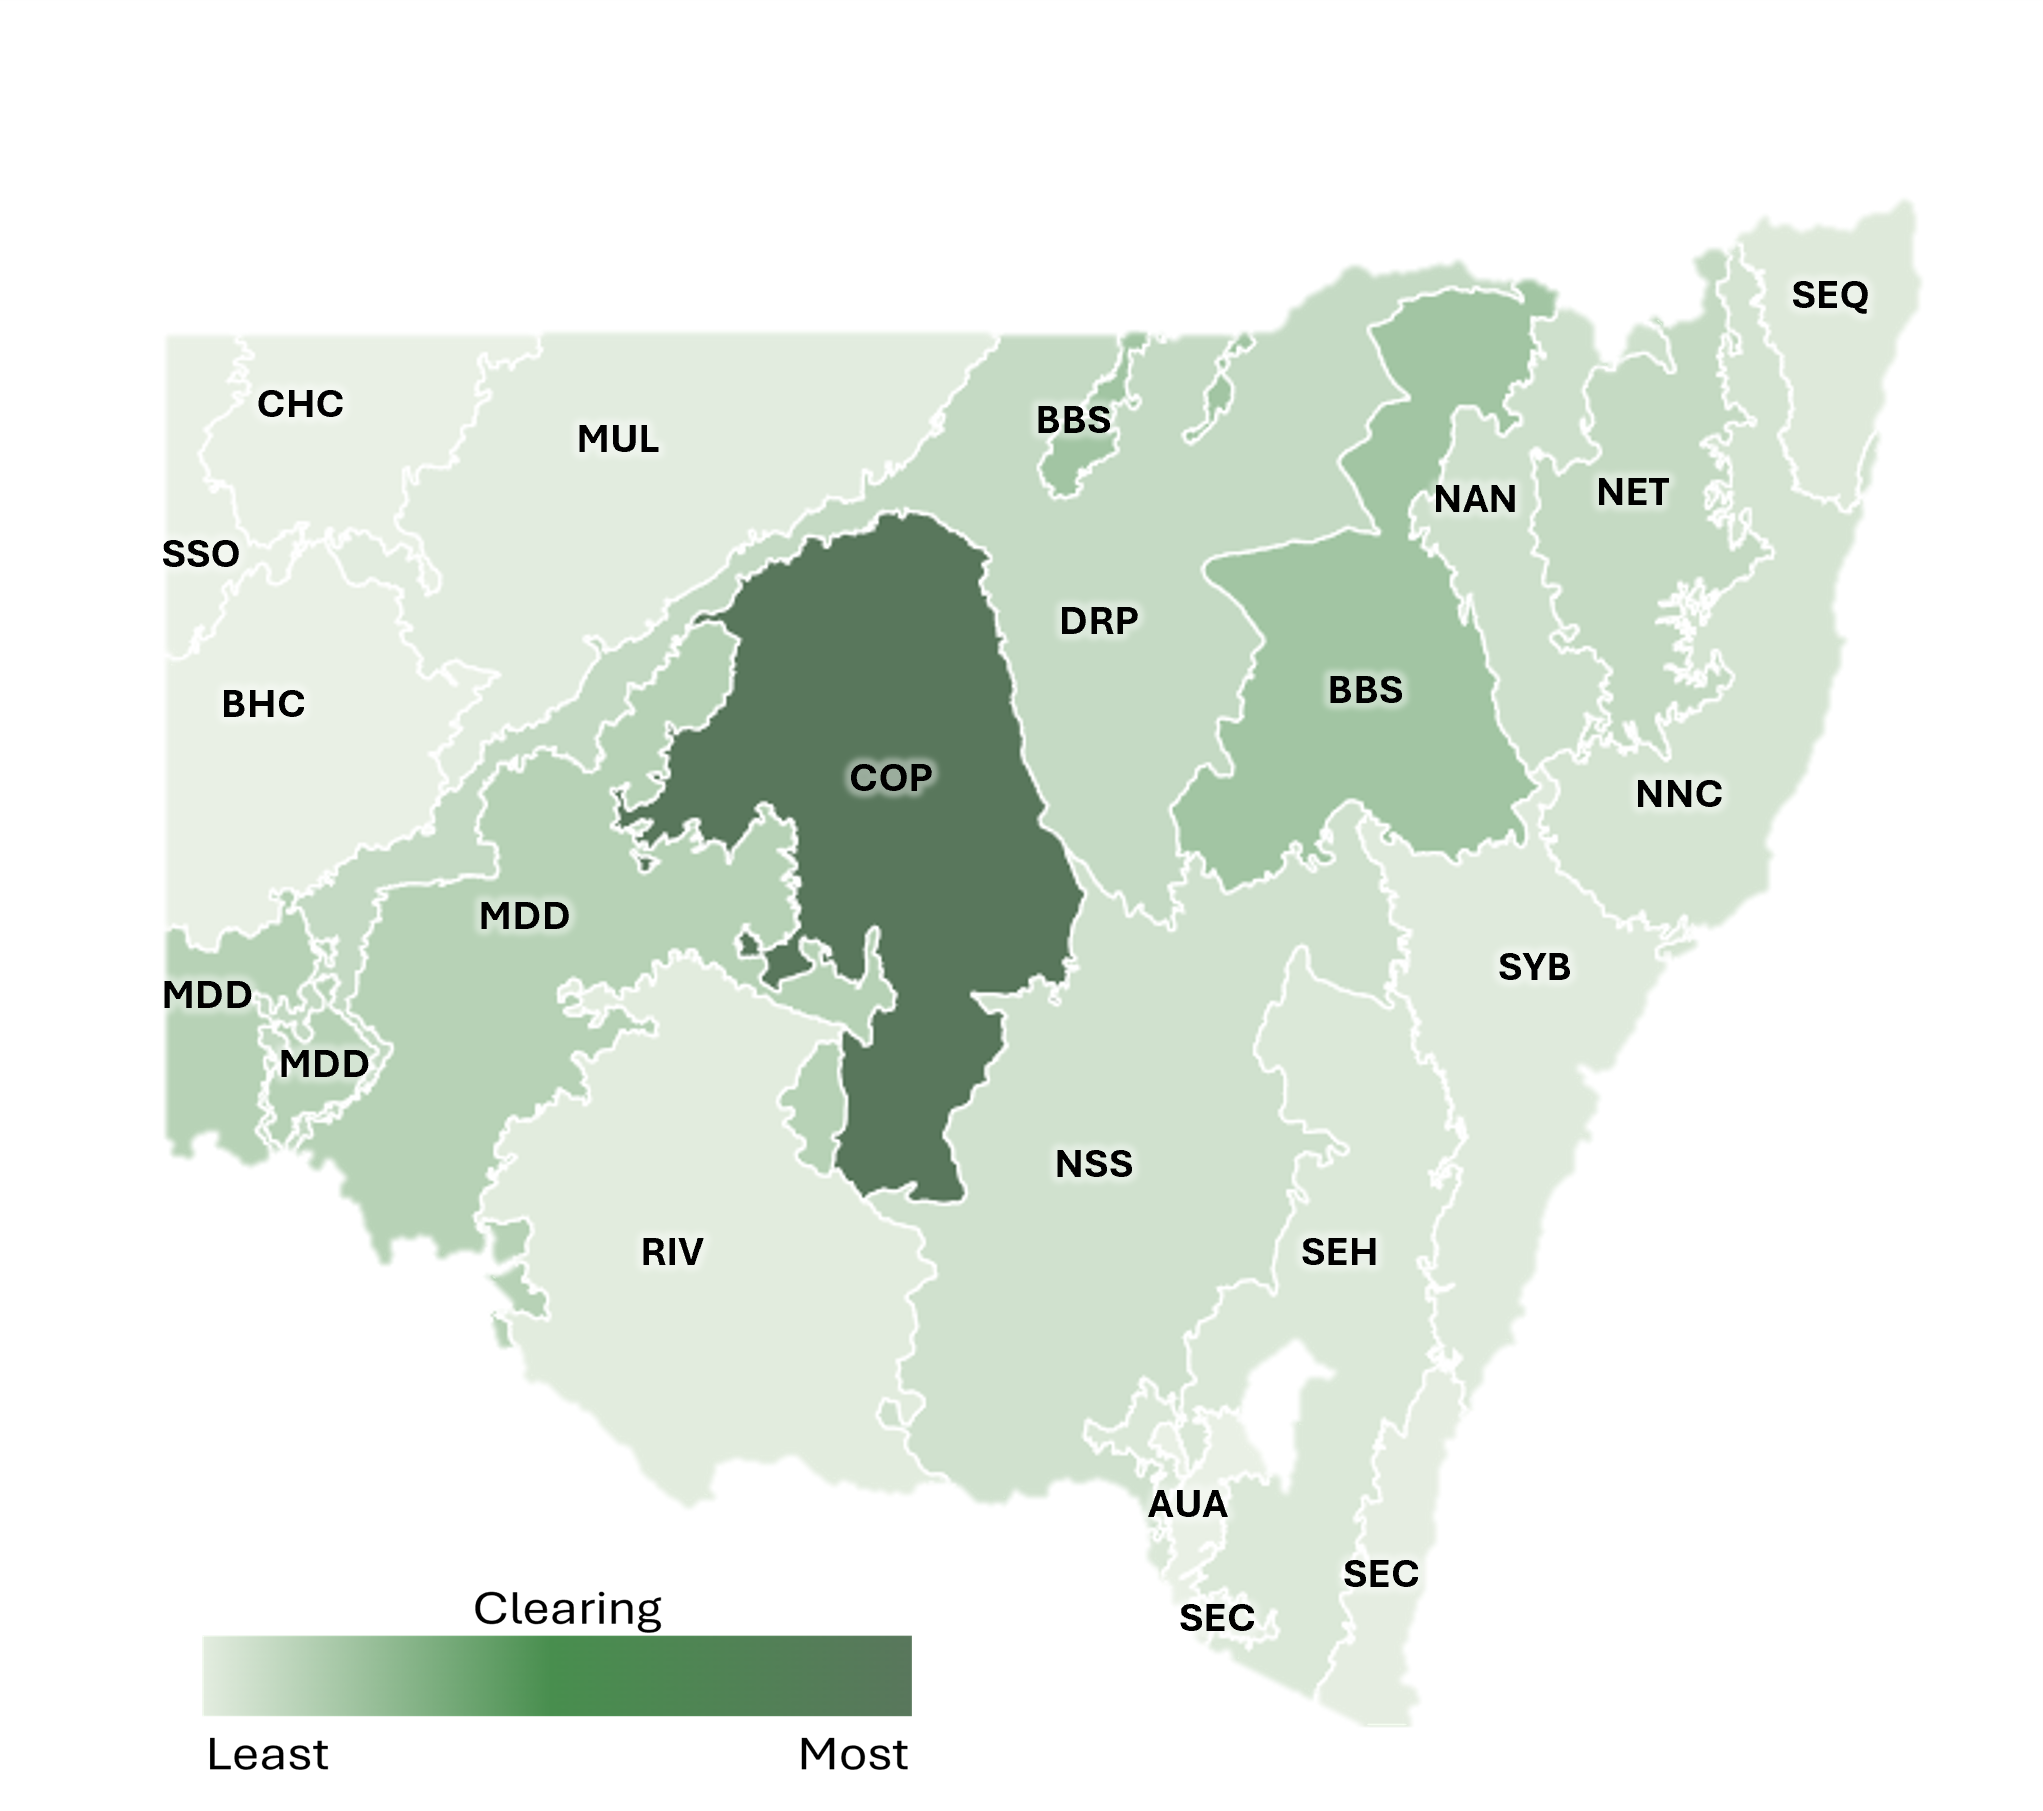
Clearing per bioregion
Bioregions (an abbreviation of ‘biogeographic regions’) are large regions of relatively similar climate, geology and landforms.
The Interim Biogeographic Regionalisation (IBRA) framework divides Australia into 89 bioregions. Eighteen of them are in mainland NSW. See for more information.
Bioregions that are experiencing higher rates of land clearing have been heavily cleared since the pre-industrial period.
Map B1.3 shows that clearing of woody vegetation between 2018 and 2022 was highest in the Cobar Peneplain (COP) and Brigalow Belt South (BBS) bioregions.
Map B1.3: Cumulative area of woody clearing in NSW by Interim Biogeographic Regionalisation for Australia (IBRA), 2018–22
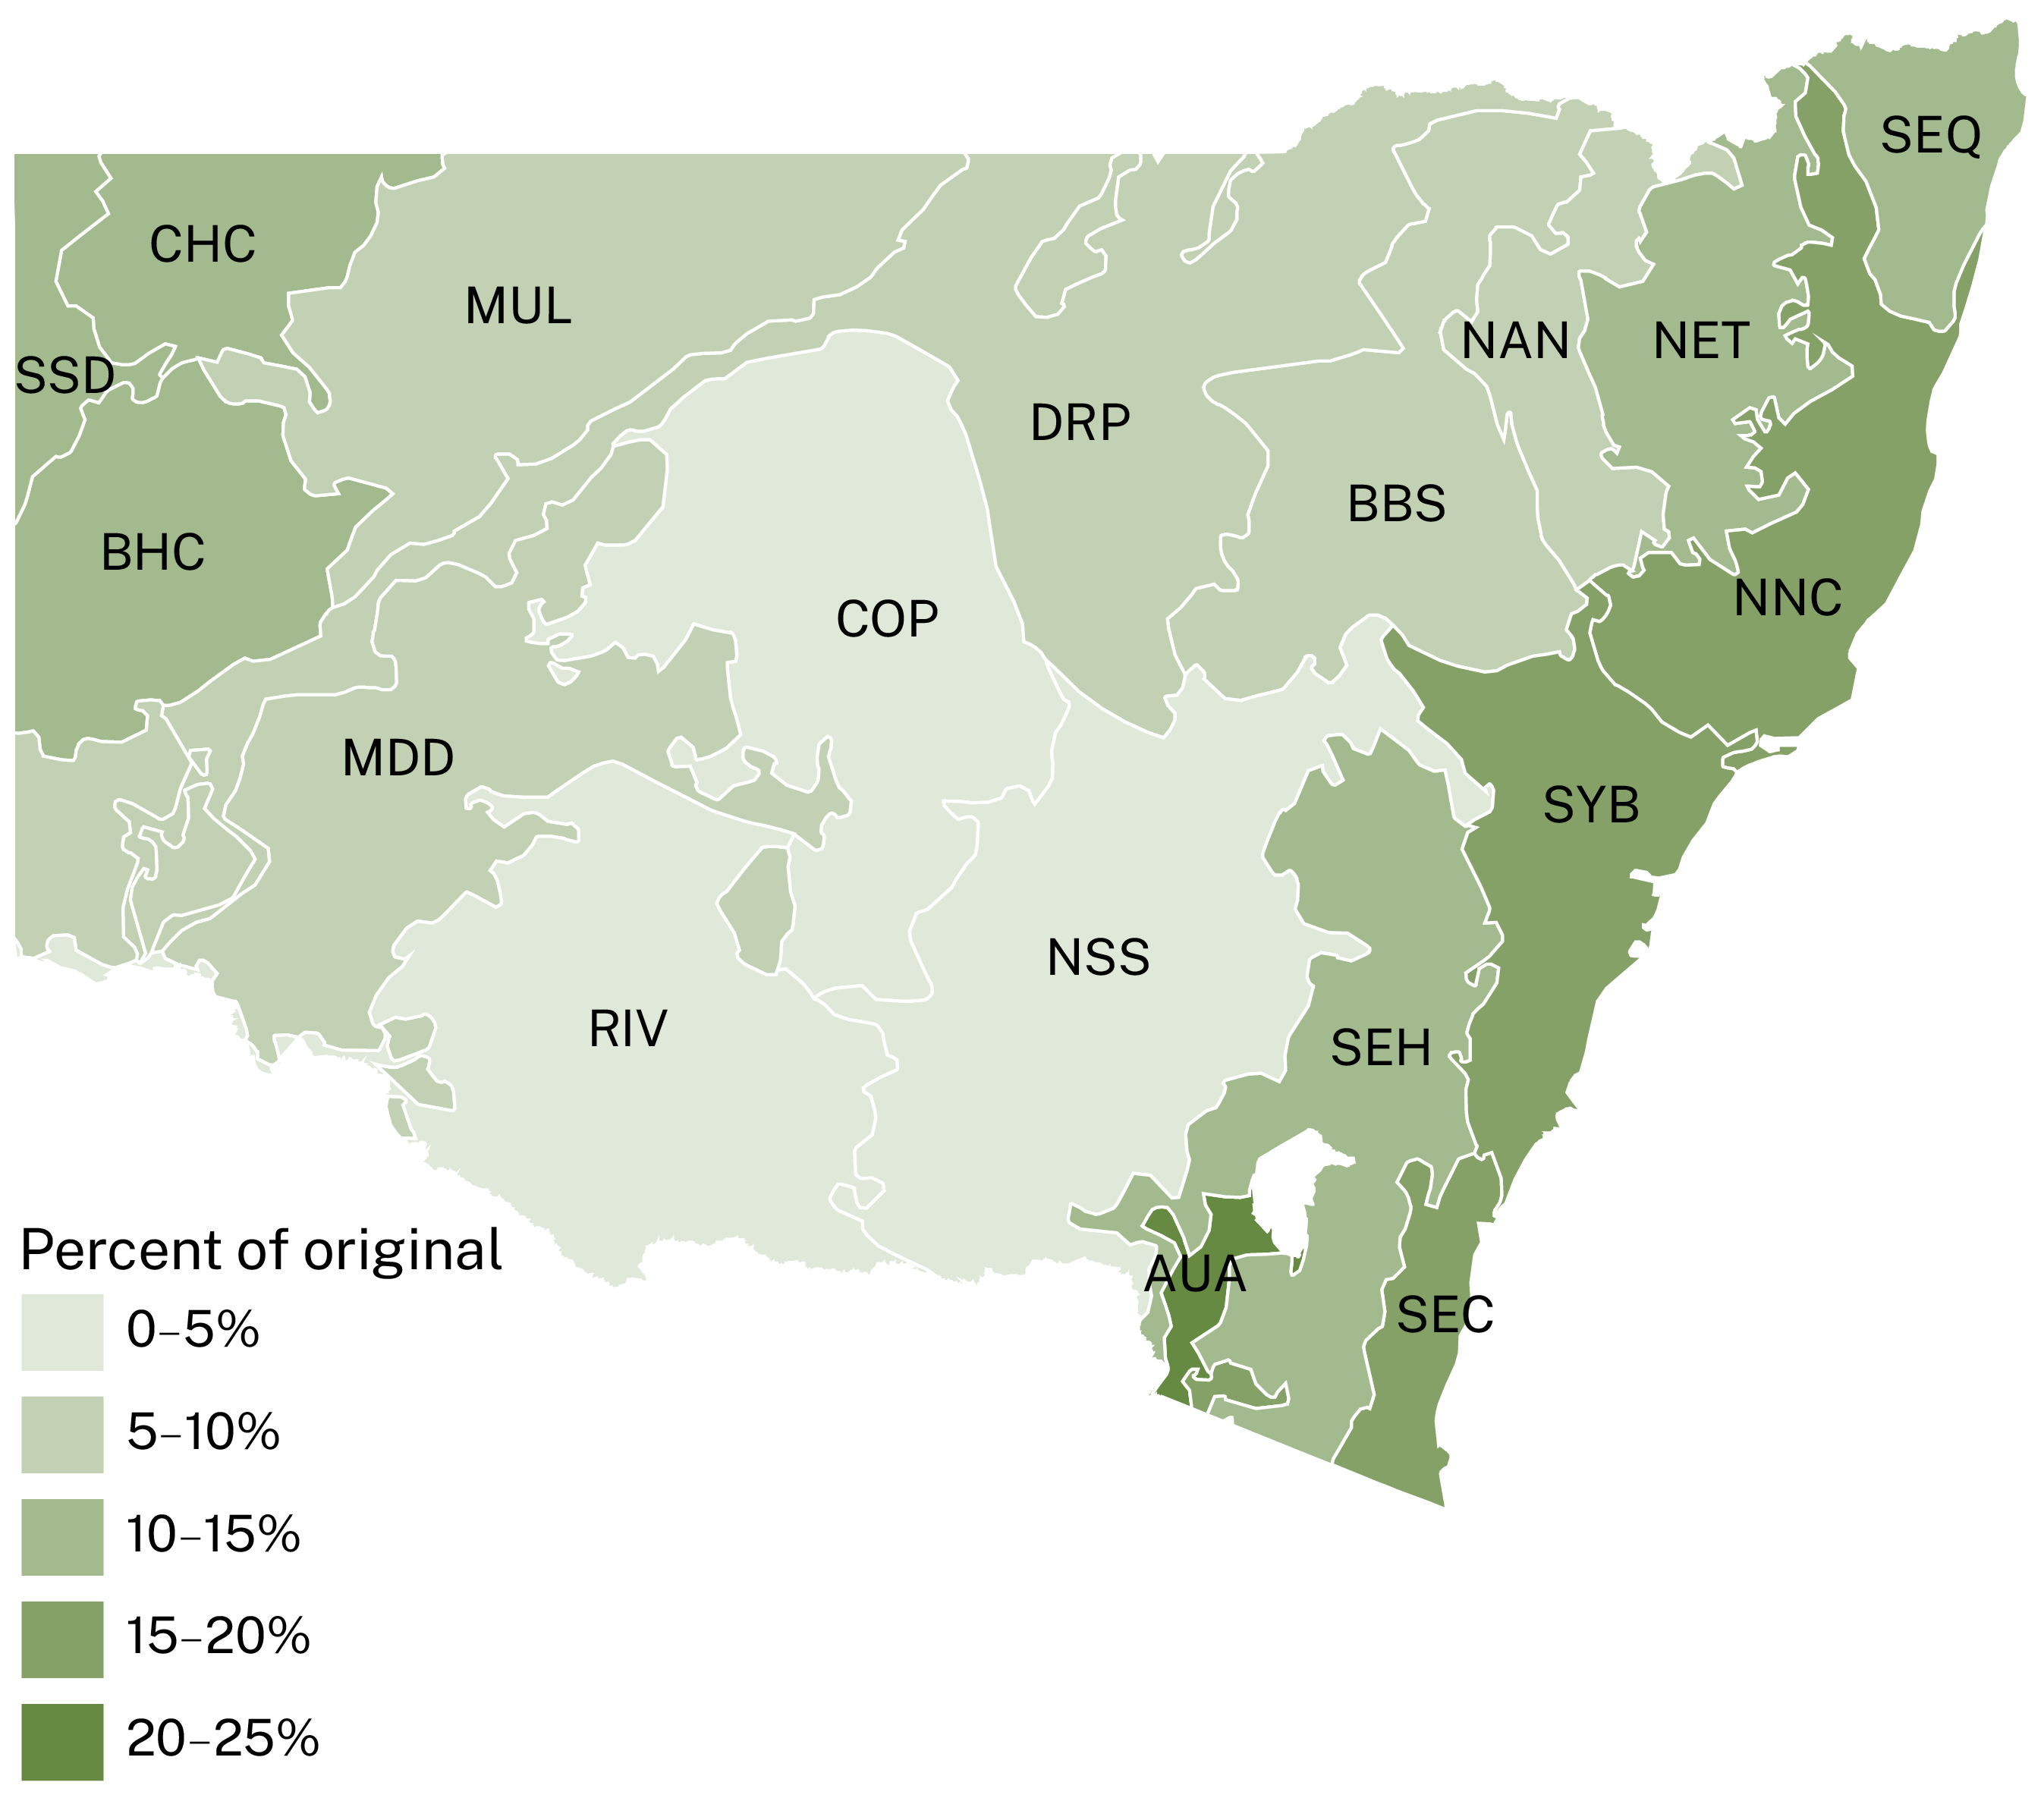
Map B1.4 shows that original plant ecosystem diversity has declined the most in bioregions most affected by cumulative clearing since European colonisation, including the Darling Riverine (DRP), Riverina (RIV) and New South Wales South Western Slopes (NSS) bioregions.
Map B1.4: Percentage of original plant ecosystem diversity remaining in NSW bioregions and change since 2017 in east coast bioregions
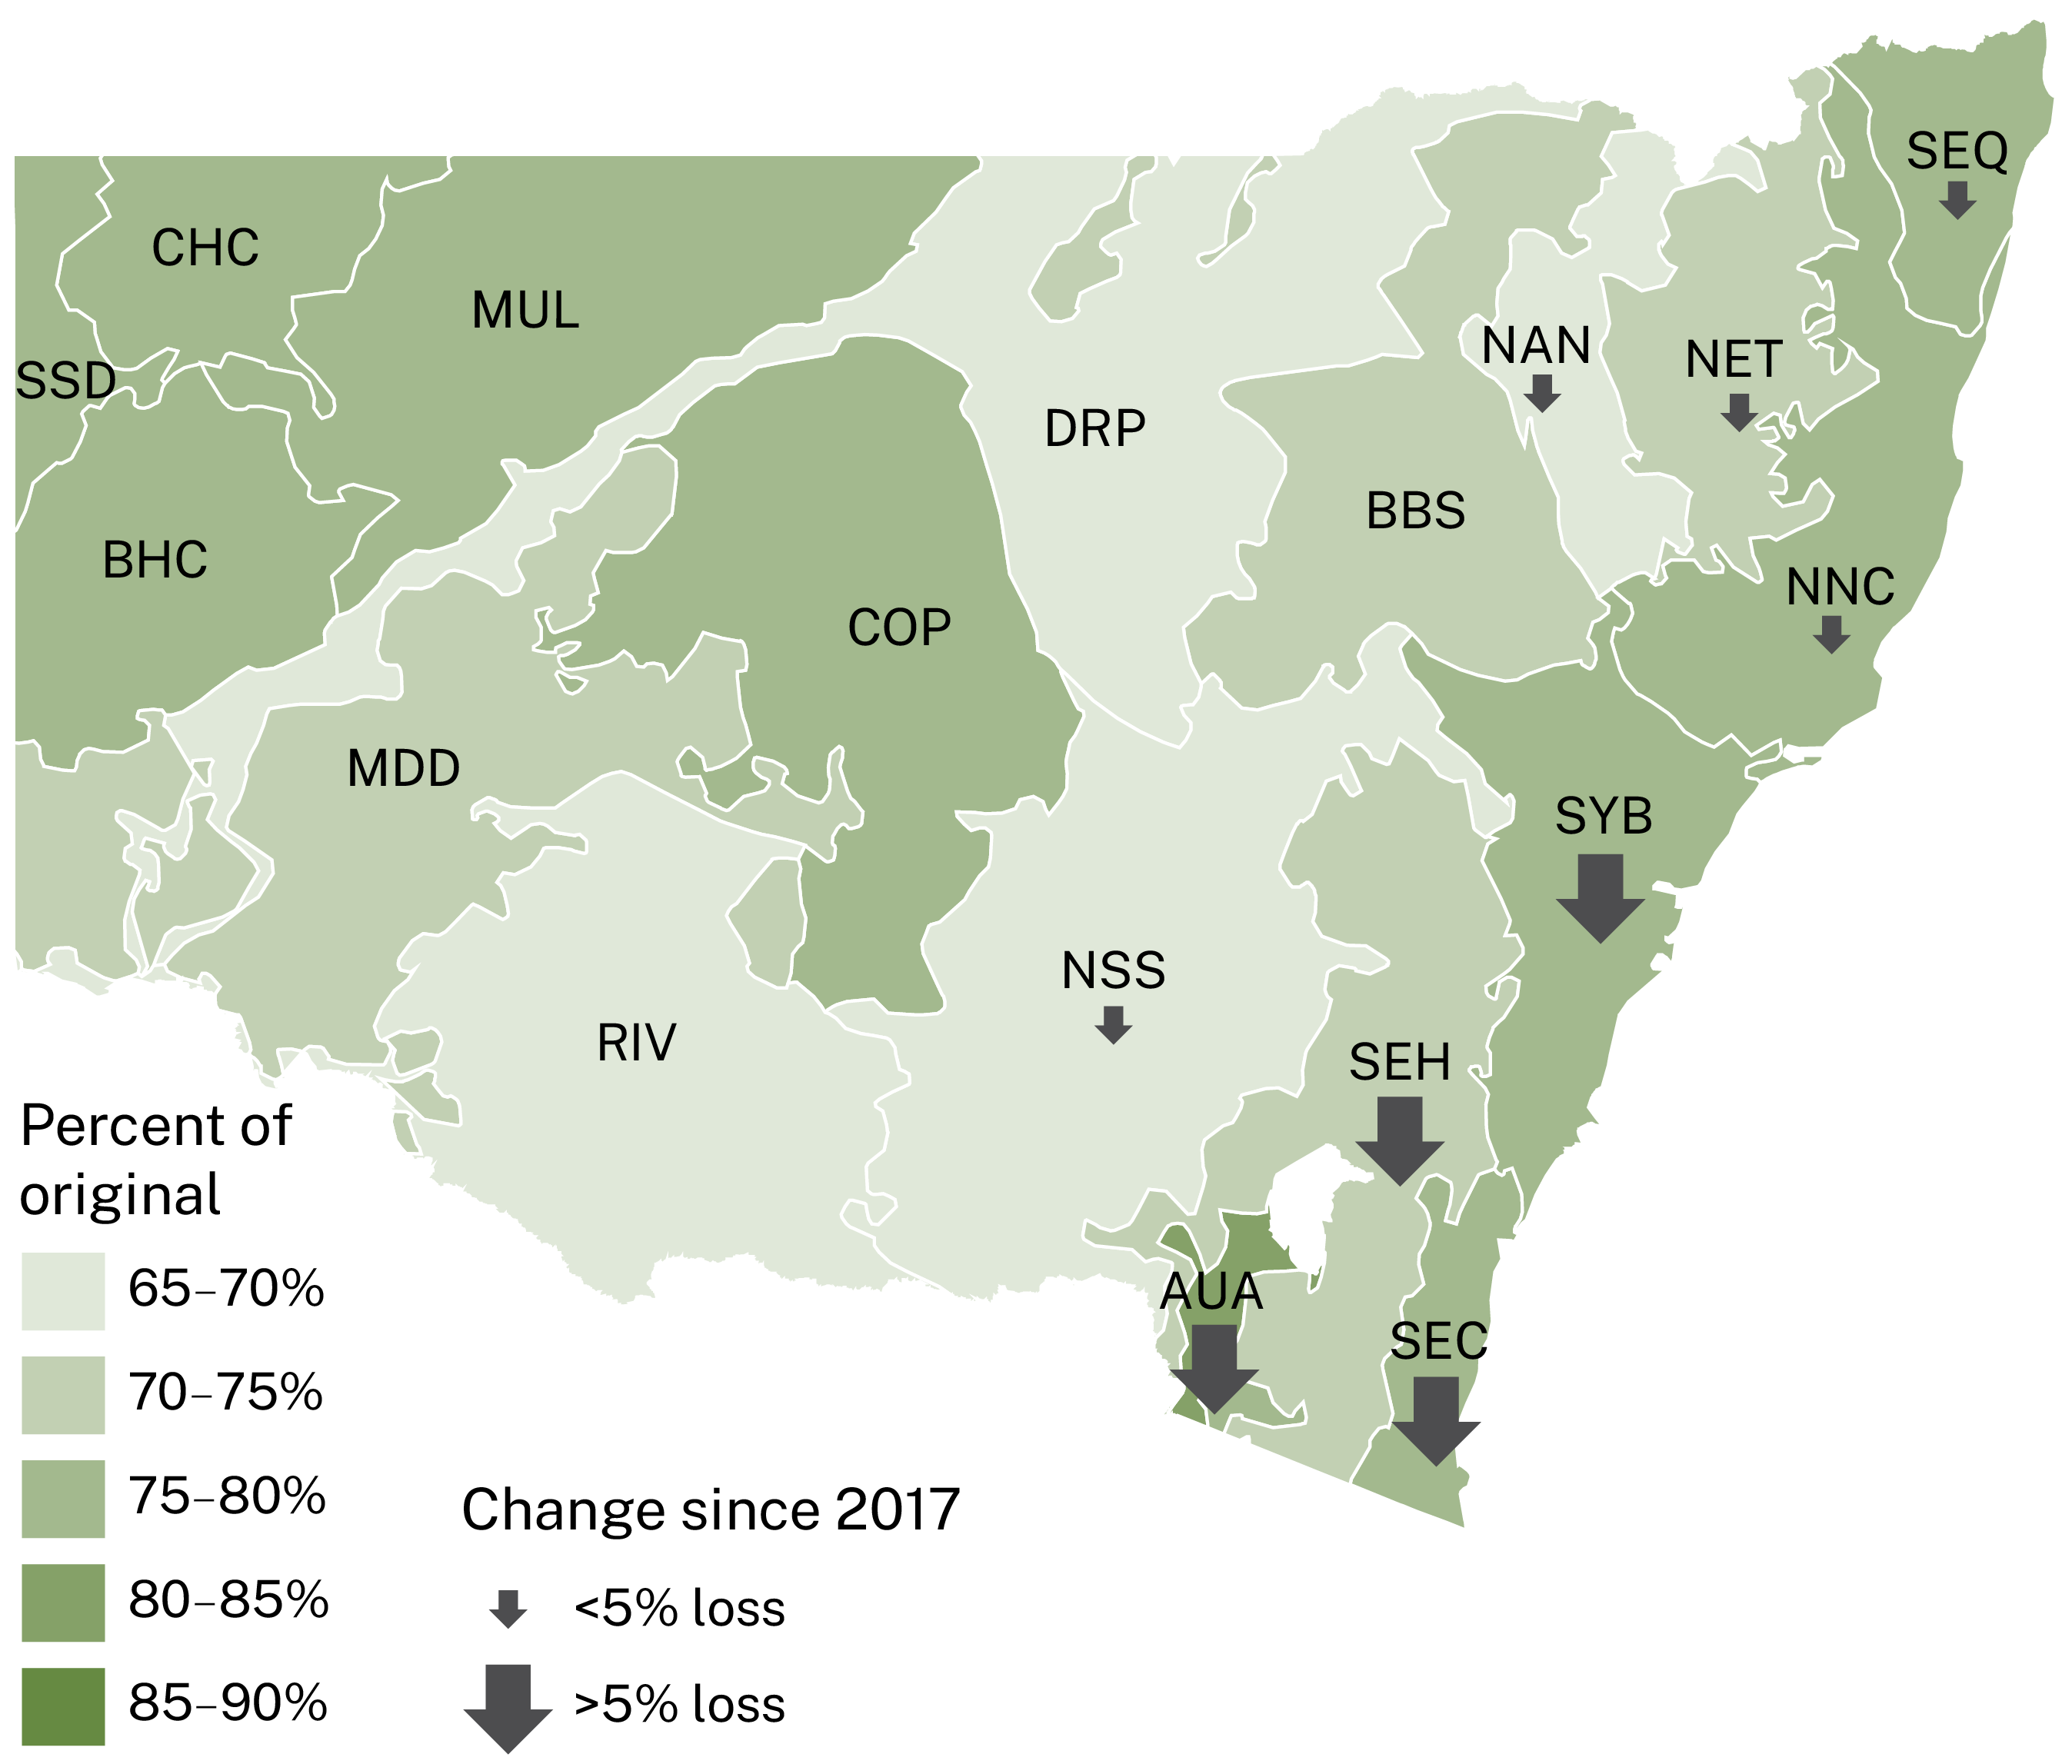
Notes:
Values shown are for 2017, or 2020 for bioregions impacted by the 2019–20 bushfires (indicated by arrows). The degree of change is indicated by the size and direction of the arrows.
IBRA bioregions are listed in .
Bioregions in central NSW are also the least resilient to climate change (see Map B1.5).
Habitat loss and fragmentation have reduced the resilience of ecosystems to climate change (; ).
Ecosystem resilience to climate change is the capacity of the landscape to:
- resist, recover from and adapt to disturbances while maintaining its functions, structures and processes
- provide habitat for, and support the migration of, plant and animal species to suitable alternative habitat as climatic conditions change.
Measuring resilience indicates how well species in their current locations will cope with future climatic conditions. In more resilient bioregions, habitats are more intact and connected, making it easier for species to migrate in response to climate change if they need to.
Bioregions with low resilience have high rates of past habitat loss and fragmentation, and higher projected climate change impacts (see Map B1.5). This will make it harder for species to migrate. These areas will require the most active management to ensure their biodiversity is retained.
Map B1.5: Resilience of NSW bioregions to projected climate up to 2070
Notes:
Lower percentages indicate lower resilience.
IBRA Bioregions are listed in .
Habitat condition
Habitat and ecological condition
Vascular plants are often used as an indicator of habitat condition and overall health of biodiversity.
Ecological condition, an estimate of the quality of terrestrial habitats based on intactness and naturalness, is used to measure habitat quality and condition in NSW ().
‘Intact’ vegetation has all its important structural components and generally has a higher biodiversity value than more modified vegetation. Native vegetation is classified as ‘intact’ when its quality has not been substantially degraded.
Ecological condition is measured and reported for different bioregions in NSW through the NSW Biodiversity Indicator Program.
The loss and alteration of habitat that occurred from the pre-industrial period up to 2017 reduced the overall ecological condition of habitat in NSW from its original level (100%) to 43% of that level, with variation between bioregions (see Map B1.6).
The 2019–20 bushfires significantly reduced ecological condition in burnt areas. In NSW, including both burnt and unburnt areas, ecological condition fell from 43% in 2017 to 40% in 2020 ().
For example, Forrester's bottlebrush and betka bottlebrush were considered threatened before the fires and are now at risk of extinction ().
While this poor condition increases the risk of extinction of plants and animals that have most of their range in burnt areas, helping these areas to recover will reduce this risk.
For example, native species can begin recolonising burnt sites if humans:
- store seeds or tissue until areas have regenerated enough for them to be replanted
- control weeds and feral animals on burnt areas to give native plants and animals time to recolonise them.
After the 2019–2020 bushfires in NSW, 486 plant species needed action to support their long-term recovery and limit their further decline ().
Map B1.6: Percentage of original ecological condition in each NSW bioregion and change since 2017 in east coast bioregions
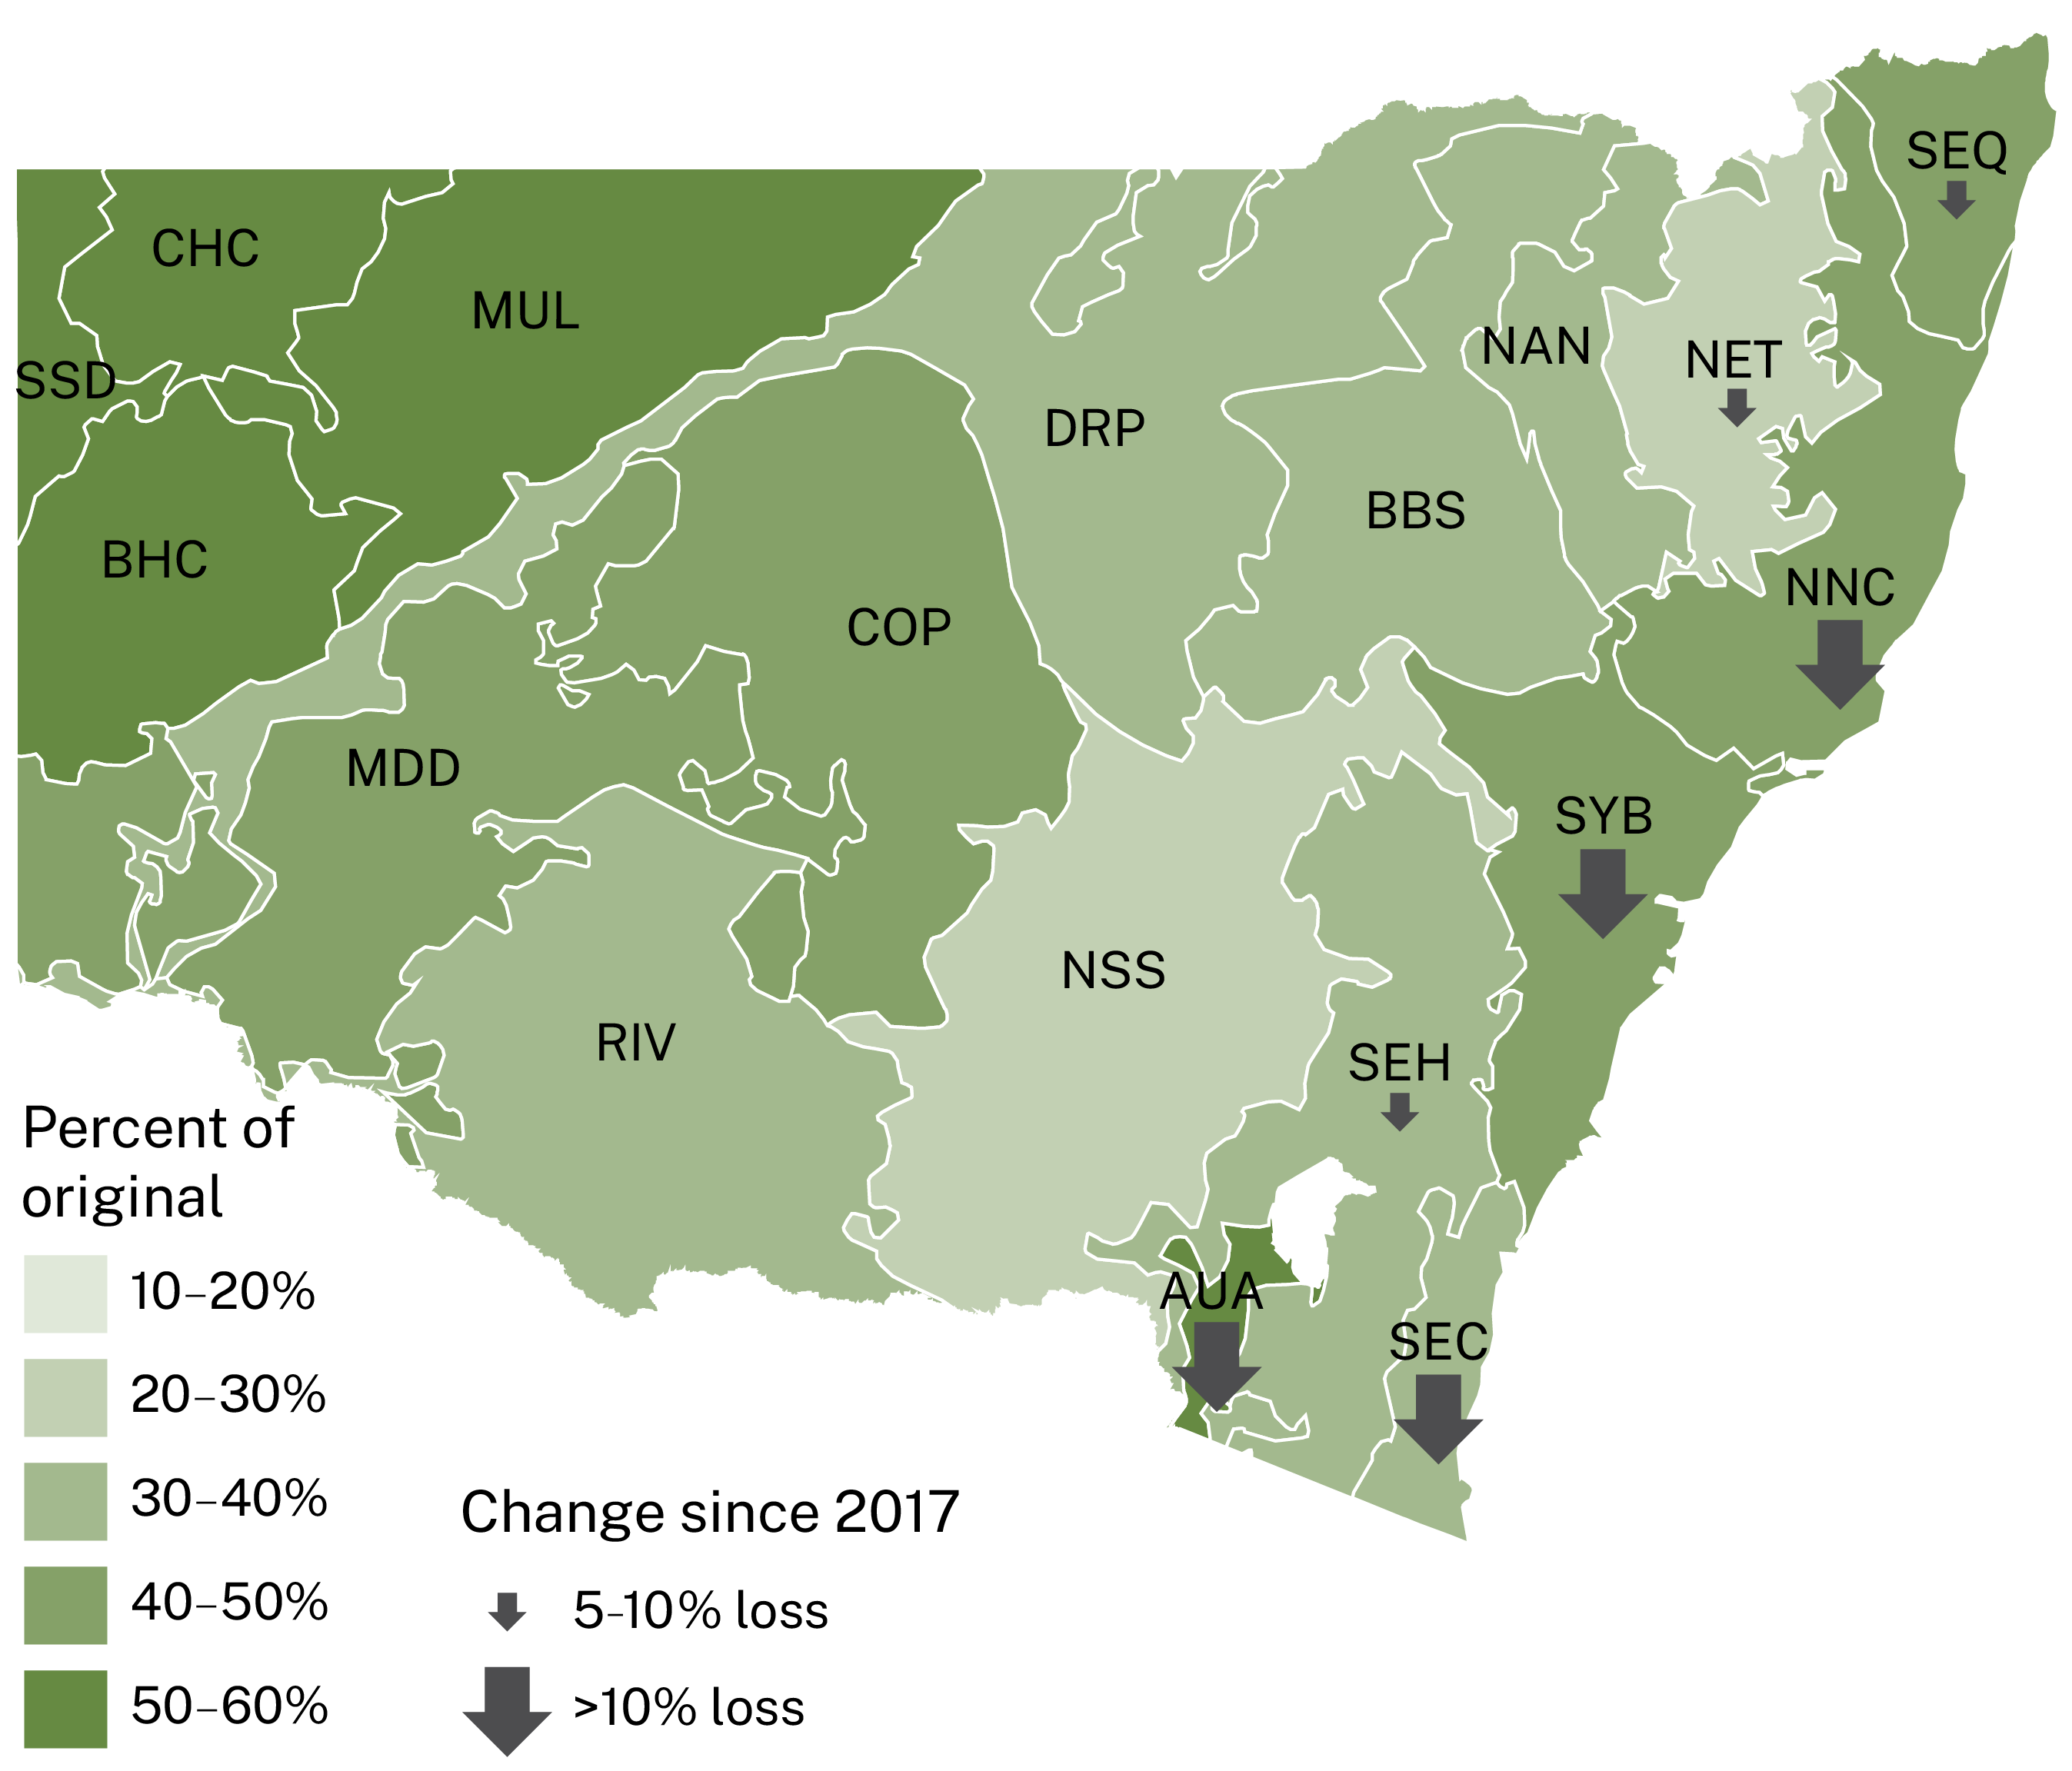
Notes:
Values shown are for 2017, or 2020 for bioregions impacted by the 2019–20 bushfires (indicated by arrows). The degree of change is indicated by the size and direction of the arrows.
IBRA bioregions are listed in .
Ecological carrying capacity
Across NSW, ecological carrying capacity is declining.
Ecological carrying capacity is a measure of ecological condition plus the additional impacts of the loss and fragmentation of surrounding habitats on the ability of species to move through the landscape ().
Understanding changes in carrying capacity is important, as native species rely on habitat that is well-connected and in good condition.
Habitat that is in better condition and connected to other good habitat can better support healthy ecosystems and more native species because:
- native animals can forage easily for food and shelter, reproduce and migrate
- native plants and animals can spread and move around the area.
Habitat can be in good condition but have low connectivity and low ecological carrying capacity. Conversely, it might have low ecological condition but be a valued corridor or stepping stone to other habitats ().
Ecological carrying capacity is measured and reported on through the NSW Biodiversity Indicator Program.
Key impacts on ecological carrying capacity include vegetation loss, degradation and fragmentation of native habitats.
The most recent results for ecological carrying capacity show changes between 2017 and 2020 (). In 2017, ecological carrying capacity in NSW was measured as 32% of natural levels relative to pre-industrialisation (see Map B1.7). This was close to the baseline assessment of 31% in 2007. After the 2019–20 bushfires, ecological carrying capacity dropped to 29%.
As at 2020, rainforests and alpine areas have the highest ecological carrying capacity of all vegetation formations in NSW.
Map B1.7: Percentage of original ecological carrying capacity in each NSW bioregion compared to pre-industrial period, since 2017 in east coast bioregions
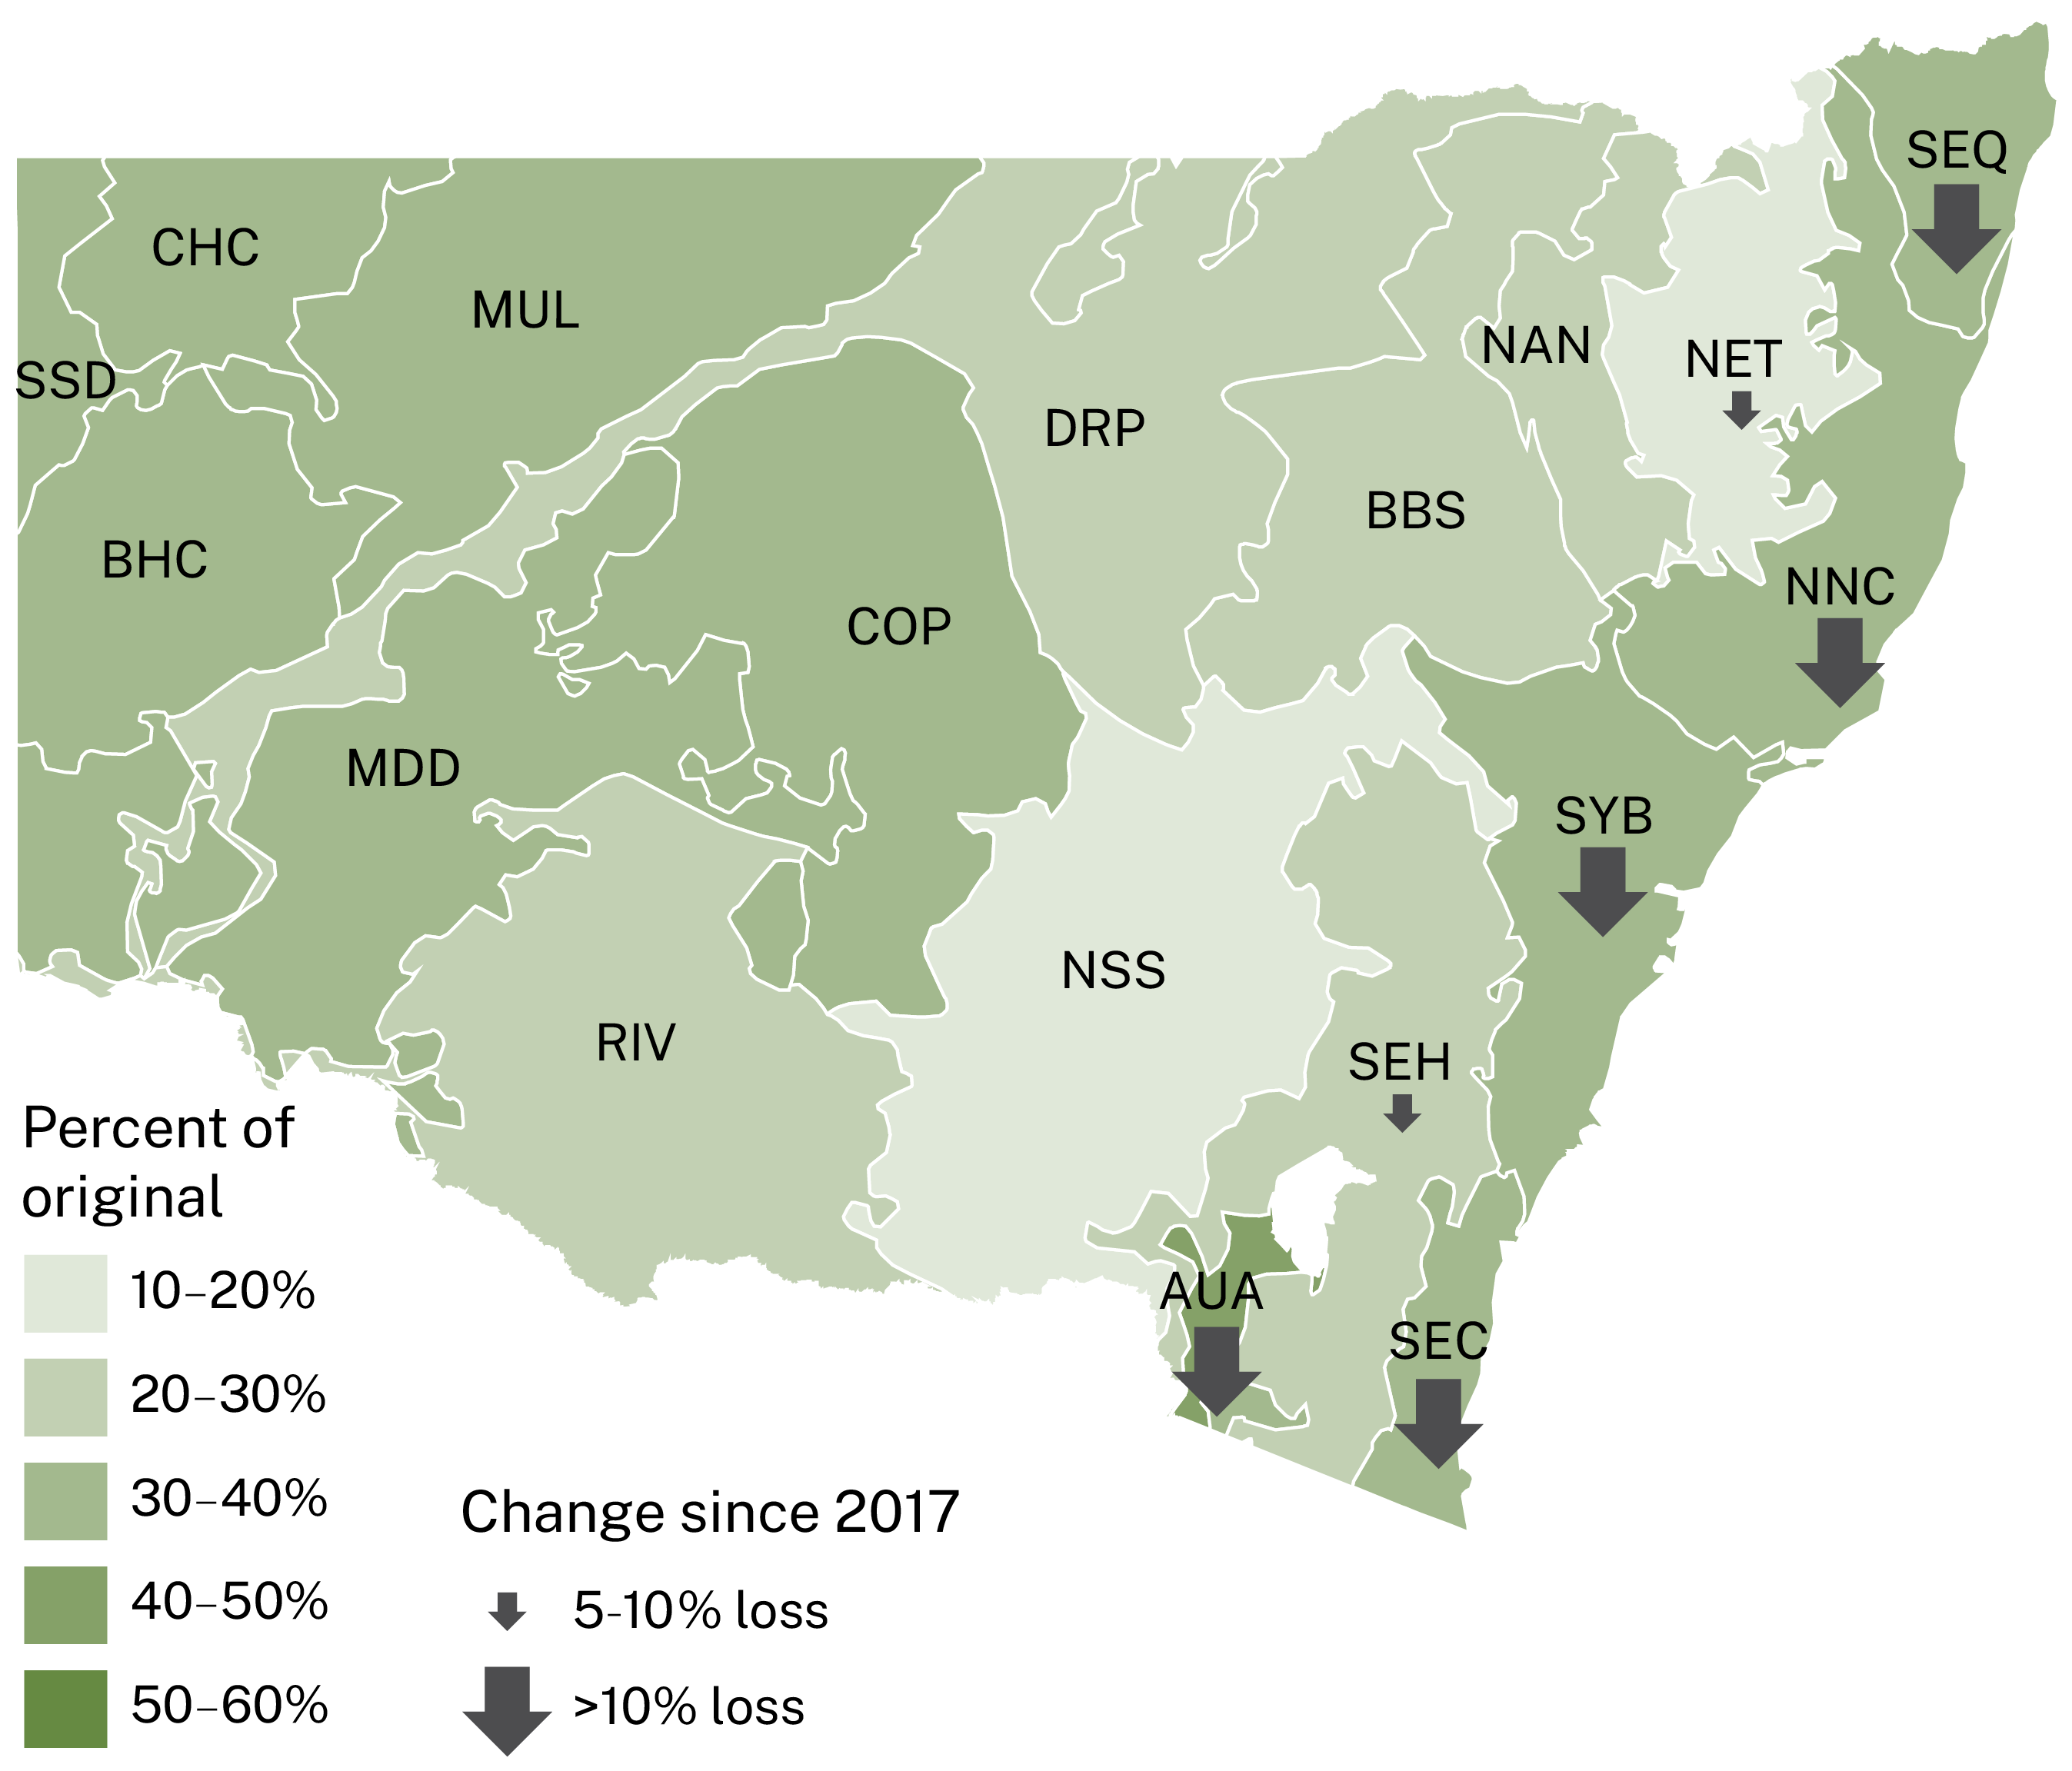
Notes:
Values shown are for 2017, or 2020 for bioregions impacted by the 2019–20 bushfires (indicated by arrows). The degree of change is indicated by the size and direction of the arrows.
These results only include the effects of the 2019–20 bushfires. They do not take into account other changes in habitat or land use since 2017.
Table B1.4 shows that the 2019–20 fires mainly affected alpine vegetation, Wet and Dry Sclerophyll Forests, Heathlands and Rainforests. These vegetation types are more common in eastern NSW.
Table B1.4: Ecological carrying capacity (%) of NSW native vegetation formations
| State vegetation type | 2007 | 2013 | 2017 | 2020 |
|---|---|---|---|---|
| Alpine Complex | 40 | 52 | 56 | 46 |
| Arid Shrublands | 37 | 37 | 36 | 36 |
| Dry Sclerophyll Forests | 41 | 45 | 44 | 33 |
| Forested Wetlands | 37 | 38 | 38 | 35 |
| Freshwater Wetlands | 32 | 33 | 33 | 32 |
| Grasslands | 26 | 27 | 26 | 26 |
| Grassy Woodlands | 26 | 28 | 28 | 25 |
| Heathlands | 53 | 58 | 58 | 34 |
| Rainforests | 62 | 64 | 64 | 50 |
| Saline Wetlands | 32 | 33 | 33 | 33 |
| Semi-Arid Woodlands | 37 | 38 | 36 | 36 |
| Wet Sclerophyll Forests | 57 | 61 | 61 | 42 |
Notes:
Assessments completed in 2007, 2013, 2017 and 2020. Results for 2020 are still interim as it takes several years for all input for modelling to become available.
These results only include the effects of the 2019–20 bushfires. They do not take into account other changes in habitat or land use since 2017.
Bioregions with the highest average ecological carrying capacity in 2017 were the:
- South-East Corner (61%)
- Australian Alps (59%)
- NSW North Coast (52%).
These same bioregions were also those most burnt in the 2019–20 bushfires, with ecological carrying capacity decreasing to:
- 33% in the South-East Corner
- 43% in the Australian Alps
- 40% on the NSW North Coast.
Bioregions with the lowest ecological carrying capacity in 2017, where only small areas of habitat for native species remained, were:
- the South Western Slopes (15%)
- Nandewar (22%)
- Brigalow Belt South (23%).
The 2019–20 bushfires only had a minor impact in these bioregions, with ecological carrying capacity decreasing between 0% and 1% ().
Other measures of habitat condition
An alternative measure of habitat condition is the assessment of tree cover and vegetation condition published in the annual Australia’s Environment report by the Terrestrial Ecosystem Research Network (TERN).
In Australia’s Environment, ‘tree cover’ refers to the projected canopy cover of woody vegetation, also known as the woody cover fraction (). Woody cover fraction can be used as a measure of vegetation condition, as it varies year-to-year depending on weather conditions being wet or dry.
Woody cover fraction excludes gaps within the tree canopy and between trees (). So, while the estimates include non-native vegetation, they end up lower than the extent of native vegetation mapped by State Vegetation Mapping. See the native vegetation clearing section of this topic for more information.
Woody canopy cover in NSW has been variable since 2000 (see Figure B1.4), decreasing in dry times (for example, during the Millenium Drought 2000–09 and the Tinderbox Drought 2017–20).
From 2021 to 2023 woody canopy cover has been above average, increasing following the Tinderbox Drought and bushfires of 2019–20 (). Note that canopy cover does not directly align to forest and woodland extent because the vegetation formations do not generally have 100% canopy cover.
Figure B1.4: NSW woody canopy cover, 2000–2023
Vegetation condition, in the Australia’s Environment 2023 report, represents the amount of all leaf area. It is partially related to woody cover fraction but is inclusive of all vegetation types including both native and non-native woody vegetation, grasslands, agricultural crops and weeds ().
Like woody cover fraction, leaf area has been variable since 2000, declining in dry periods and increasing in wet periods (see Figure B1.5). From 2019 to 2022, vegetation condition improved, returning to about average in 2023 ().
Figure B1.5: NSW vegetation condition (vegetation cover)
Threatened plant species
Many natural and human processes threaten plant species in NSW, including:
- climate change, such as increasing frequency and duration of drought
- weeds
- feral animals
- pathogens and disease
- changing fire regimes
- alteration of habitat by human activities, such as mining and building, that result in habitat clearing, fragmentation and degradation.
A key threatening process:
- seriously harms threatened species or ecological communities
- causes a species or ecological community to become threatened ().
Search the key threatening processes listed in the NSW Biodiversity Conservation Act 2016.
A species is considered threatened if it is facing high to extremely high risk of extinction. This can happen when:
- there is a reduction in its population size
- it has a restricted geographical distribution
- there are few mature individuals.
The NSW Threatened Species Scientific Committee decides when a non-marine plant species is threatened. The assessment is based on criteria developed by the International Union for the Conservation of Nature. The Fisheries Scientific Committee has the same responsibility for marine plants.
See the topic for information about threatened marine plants, such as kelp, seaweed and seagrass.
See the topic for more information on riparian and aquatic plants.
Between 31 December 2020 and 30 June 2024, the number of plant species listed as threatened under the Biodiversity Conservation Act 2016 increased by 18, bringing the total to 657.
In addition to this, nine species of fungi and two species of algae are listed under the Act. These numbers have not changed since 2020.
Many of the 111 listings for threatened ecological communities under the Biodiversity Conservation Act 2016 are defined by plant assemblages (groups of plants that often grow together in the same location). These include:
- Monaro Tableland Cool Temperate Grassy Woodland in the South Eastern Highlands
- Lagunaria Swamp Forest on Lord Howe Island
- Freshwater Wetlands on Coastal Floodplains.
See the list of threatened ecological communities for more information.
Image B1.3: Granite rose
Notes:
Granite rose (Boronia repanda) is one of many native plants listed as endangered in NSW.
The process of carrying out threat assessments continues to improve. This means some species are joining the list not because the threat level has changed, but because we now have enough data to undertake an assessment. This process also results in some species being delisted.
The listing process is scientifically rigorous and ensures decisions are made based on the latest species information.
While the numbers of threatened plants are increasing, having more accurate information means that planning and conservation actions can be developed to save them before they decline to critical levels or become extinct.
Without effective management, modelling predicts that only 49% of threatened plant species are likely to survive in 100 years’ time (). Management and conservation actions will not be enough to save many species without resolving key threats, such as habitat removal and climate change.
When considering species that are of significance to Aboriginal peoples, resources for their protection are limited if the species is not currently listed as threatened. NSW is lacking a formal framework for collaborating with local Aboriginal communities to identify, document and protect culturally significant species on public lands.
Although species listing can prioritise conservation efforts, Aboriginal communities have little input in this process and the potential impact on cultural practices is often overlooked.
See the topic for more information.
Community perceptions
Increasing community awareness of the importance of biodiversity will help protect it.
The annual Community Appreciation of Biodiversity Survey collects responses from a random sample of the NSW population. A set of questions are used to assess and track changes in community understanding and support of biodiversity conservation.
Community surveys have found that since 2015, the people of NSW are more aware that some NSW native plants are declining and could become extinct (see Table B1.5).
Table B1.5: NSW residents’ awareness of risks to native plant biodiversity
| Thinking about native plants, as far as you know, would you say | 2015 | 2022 | 2023 | 2024 |
|---|---|---|---|---|
| There are no native plant species in NSW in serious decline and at risk of becoming extinct | 4% | 5% | 6% | 6% |
| There are native plants in NSW in serious decline and at risk of becoming extinct | 50% | 75% | 73% | 71% |
| Not sure, don’t know | 46% | 20% | 21% | 23% |
| Sample (n) | 2,000 | 1,901 | 2,063 | 2,060 |
Pressures and impacts
Land clearing
Native vegetation has been extensively cleared in some parts of NSW for housing, infrastructure and agriculture.
Clearing of native vegetation is listed as a key threatening process under the Biodiversity Conservation Act 2016.
Environmental impacts include:
- irreversible disturbance or destruction of habitat
- fragmentation of populations of native and threatened species
- degradation of river banks
- loss or disruption of ecological function
- increased greenhouse gas emissions
- limited ability for species and ecosystems to adapt to climate change
- amplified effects of climate change
- loss of leaf litter which provides habitat and adds nutrients to soil
- loss or disruption of ecological function
- erosion, and changes to the lifeforms in soil (biota).
The clearing of native vegetation and associated land use changes has had significant impacts on Aboriginal peoples. Impacts include:
- the loss of traditional ecological knowledge
- desecrated sacred sites
- diminished access to essential resources, such as bush foods and medicinal plants.
These losses affect both the physical and cultural wellbeing of Aboriginal peoples, causing disconnection from their ancestral lands and knowledge systems.
Habitat loss and fragmentation
Native vegetation clearing results in loss of native species and destruction of their habitat.
These threats are increased by land being used for farming, housing or development and fragmentation of remnant vegetation.
These factors can prevent:
- native vegetation from regenerating and spreading
- native plants and animals from moving between suitable habitats, leading to a loss of genetic diversity (; ).
Riparian vegetation
Degradation of native vegetation along NSW waterways is a key threatening process.
Riparian habitat (habitat by or on a river, stream, lake or wetlands) has declined a lot since European colonisation. Riparian habitat strengthens the quality of water and habitat in and around waterways by:
- stabilising banks to prevent erosion
- improving water quality by filtering run-off from farming or industry
- regulating water and local air temperature
- protecting food webs
- providing habitat for native plants and animals.
Loss or degradation of riparian vegetation can:
- destabilise banks, causing and increasing erosion
- change patterns in waterway flows, causing changes in habitats
- degrade aquatic ecosystems
- reduce or eliminate habitat for native plants and animals.
Climate change
Human-induced climate change is listed as a key threatening process under the Biodiversity Conservation Act 2016. Climate change is already damaging native vegetation in NSW due to:
- changing patterns in regional rainfall and snow cover
- rising sea levels
- increased risk of extreme weather, such as heatwaves, droughts, bushfires, storms and flooding.
The resilience of native vegetation to future climatic conditions has been reduced by:
- habitat fragmentation
- weeds
- invasive animals
- disease
- erosion.
Habitat fragmentation makes it hard for species to move to new suitable habitat as the climate changes.
Predicted impacts on ecosystems include:
- decreased forest growth and productivity
- unbalanced competition between perennial native grasses, leading to the growth of some at the expense of others
- increased encroachment of woody shrubs into arid and semi-arid rangelands
- continued incursion of mangroves into freshwater wetlands
- growth of woody species higher up in alpine areas
- changed timing of species’ life cycles.
While there is some variation in climate projections, overall, experts agree conditions will be warmer and drier, especially in the cooler months, with rain coming in short, heavy falls.
Conditions are also likely to become more variable, with more extremely hot days (warmer than 35°C) and fewer extremely cold days.
See and topics for more information about forecast changes to climatic conditions.
Traditional ecological knowledge is important in climate change adaptation strategies. Aboriginal peoples, as the oldest cultures on earth, have adapted and thrived through changing climates ().
Their knowledge can provide crucial insights into adapting to current and future changes driven by rapid and human-induced climate change ().
See the topic for more information.
Invasive threats
‘Invasive threats’ is a general term for feral animals, weeds, pathogens, and other organisms that are introduced to places outside their native ranges, where they spread. They then damage or harm local ecosystems and species ().
Invasive plant species (weeds)
Weeds are plants introduced to Australia from overseas and growing where they don’t belong. They can spread rapidly and can seriously threaten native species, ecosystems, agricultural productivity and landscape processes ().
The Biodiversity Conservation Act 2016 lists seven key threatening processes related to invasive plant species.
The impacts of these processes include:
- competition with native plants for nutrients, water, sunlight and space
- formation of dense areas of vegetation that shade and smother native species
- their spread into native habitats, making them less suitable for native wildlife
- dominating regrowth in areas that have been burnt ().
For Aboriginal peoples and communities, there are further impacts including:
- less food security due to weeds competing with culturally important species
- disruption of cultural practices and knowledge due to altered ecosystems
- disruption of the natural rhythms of ecosystems and Country
- degradation of sacred sites
- economic impacts
- impacts on culturally significant species.
As at 2024, an estimated 325 high-risk weed species were recorded in the State ().
The weeds that are of most risk to native plants and animals in NSW are shown in Table B1.6 ().
This table also shows whether each weed is listed as:
- a priority weed in a Regional Strategic Weed Management Plan (RSWMP)
- a key threatening process in the NSW Biodiversity Conservation Act 2016.
Table B1.6: Top 20 widespread weeds threatening native animals and plants in NSW
| Common name | Scientific name | RSWMP priority species | Key threatening process |
|---|---|---|---|
| balloon vine | Cardiospermum grandiflorum | No | Yes** |
| bitou bush | Chrysanthemoides monilifera subsp. rotundata | Yes | Yes |
| blackberry | Rubus fruticosus species aggregate | Yes | Yes* |
| blue morning glory | Ipomoea indica | No | Yes** |
| bridal creeper | Asparagus asparagoides | Yes | Yes** |
| broad-leaf privet | Ligustrum lucidum | Yes | Yes* |
| Cape ivy | Delairea odorata | No | Yes** |
| cat’s claw creeper | Dolichandra unguis-cati | Yes | Yes** |
| ground asparagus | Asparagus aethiopicus | Yes | Yes** |
| Japanese honeysuckle | Lonicera japonica | No | Yes* |
| lantana | Lantana camara | Yes | Yes |
| lippia | Phyla canescens | No | Yes* |
| Madeira vine | Anredera cordifolia | Yes | Yes** |
| Mickey Mouse plant | Ochna serrulata | No | Yes* |
| narrow-leaf privet | Ligustrum sinense | Yes | Yes* |
| salvinia | Salvinia molesta | Yes | Yes* |
| Scotch broom | Cytisus scoparius subsp. scoparius | Yes | Yes |
| serrated tussock | Nassella trichotoma | Yes | Yes*** |
| sweet vernal grass | Anthoxanthum odoratum | No | Yes*** |
| turkey rhubarb | Acetosa sagittata | No | Yes* |
Notes:
* invasion by escaped garden plants.
** invasion by exotic vines and scramblers.
*** invasion by exotic perennial grasses.
RSWMP=Regional Strategic Weed Management Plan
Grazing animals
Grazing by introduced animals, such as rabbits, goats, deer, horses and pigs, is listed as a key threatening process in the Biodiversity Conservation Act 2016 because it poses a threat to biodiversity
Rabbits are one of Australia’s most destructive invasive animals.
They breed quickly and are very adaptable. This means they can occupy a wide range of habitats across Australia, often outcompeting and displacing native species.
They can overgraze an area and eat all parts of a plant, including the seeds, bark and roots. This can lead to:
- increased erosion
- reduced plant survival
- decreased new growth.
Feral goats are a serious threat to biodiversity on Australia’s rangelands () and islands (). They compete directly with native mammals for food and refuge (). In addition, their widespread grazing and trampling can:
- destroy the vegetation cover
- disturb the balance of species in a vegetation community
- prevent the regeneration of native plants
- lead to more rapid soil loss and erosion ().
Feral goat numbers can increase rapidly under suitable conditions. Feral goat numbers in western NSW have increased from 542,145 in 1999 to 4,993,531 in 2020 (; ).
See the topic for more information about grazing animals.
Insects
Insects are the most diverse class of animals and have a profound ecological influence, whether they’re native or invasive species. Insects that are predators, plant-eaters, pollinators of weeds, parasites or disease carriers can harm native plants ().
Two insects of particular concern are psyllids and fire ants.
Psyllids are tiny, sap-sucking insects. Bell miner birds protect them from predators because they eat their excretions.
The collaboration between bell miners and psyllids leads to psyllids becoming too plentiful.
The psyllids strip eucalyptus trees of their leaves, eventually killing them. This process is called ‘eucalypt dieback’ and is a key threatening process.
In 2006 it was estimated that 2.5 million hectares of NSW forest could be affected by eucalypt dieback (). This process reduces canopy cover and habitat for the many endangered and vulnerable native animals living in eucalypt forests.
Fire ants (Solenopsis Invicta) are an exotic invasive pest. They are listed as a key threatening process in the Biodiversity Conservation Act 2016.
While found mainly in Queensland, there have been two cases reported in NSW since 2021 ().
The ants are highly aggressive and can spread over large distances.
They feed on seeds, other insects and small animals, including those that pollinate native plants. They also inflict a painful bite.
Fire ants can damage or destroy ecosystems by:
- killing insects and small animals that are essential elements in food chains
- reducing plant populations and destabilising ecosystems ().
Pathogens and disease
Pathogens are organisms, such as viruses, bacteria and fungi, that cause disease. They can seriously damage animal and plant biodiversity and harm human health.
The Biodiversity Conservation Act 2016 identifies two pathogens that damage native vegetation and have been listed as key threatening processes:
- Phytophthora cinnamomi (P. cinnamomi ) – a water mould, though commonly referred to as root-rot fungus
- myrtle rust – a fungal disease.
P. cinnamomi is widespread in coastal forests. It infects many native plant species, damaging or killing them ().
Myrtle rust threatens common native species, such as eucalypt, paperbark, tea tree, bottlebrush and lilly pilly trees (Image B1.4). First detected in Australia in 2010, it has spread rapidly along the east coast of NSW and across Australia ().
Heavy infection can kill leaves and stems, and even an entire plant.
Image B1.4: Myrtle rust
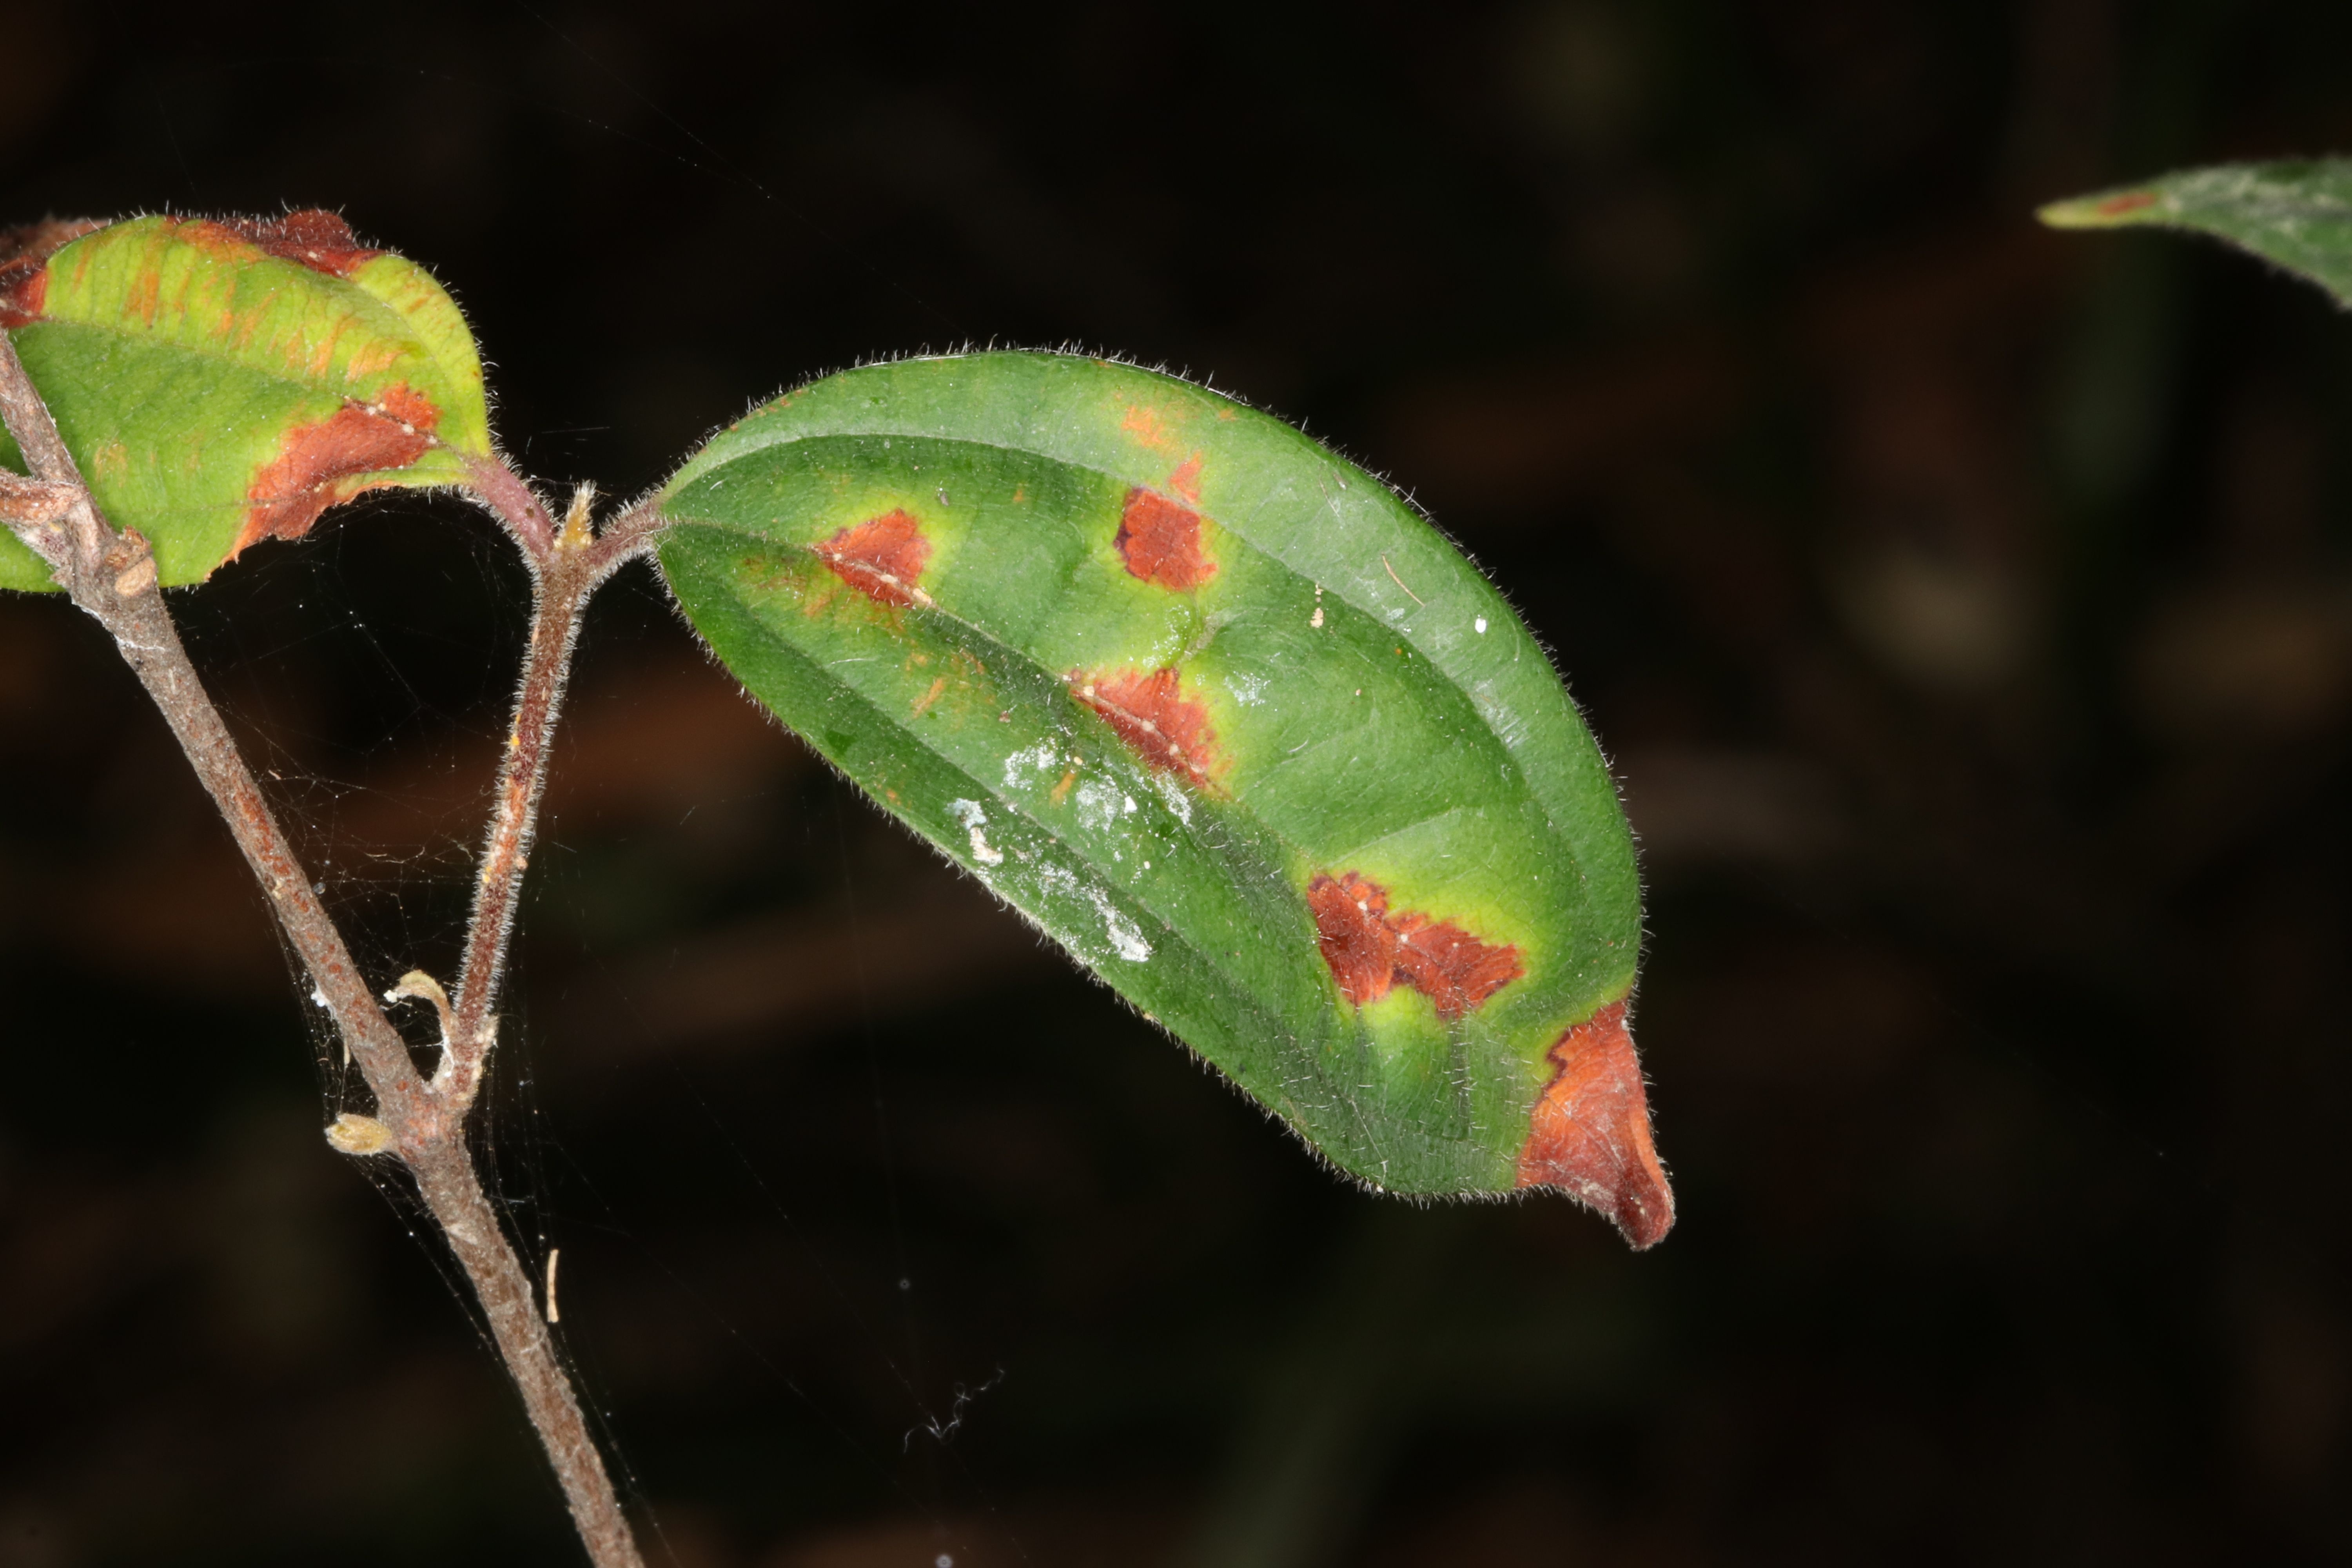
Notes:
Myrtle rust infection on Scrub Turpentine (Rhodamnia rubescens).
Responses
Policy protections
NSW plan for nature
The NSW plan for nature, released in July 2024, is the NSW Government response to the statutory reviews of the Biodiversity Conservation Act 2016 and native vegetation provisions of the Local Land Services Act 2013.
The response acknowledges that biodiversity in NSW is in crisis and that the Government’s policy objective needs to shift from mitigating decline to restoration and repair. This is essential to the wellbeing and prosperity of current and future generations.
Priority actions include:
- strengthening the Biodiversity Conservation Act 2016
- exploring, in partnership with Aboriginal stakeholders, new and better ways to support Aboriginal people to connect with and care for Country
- developing a NSW nature strategy
- improving whole-of-government accountability for biodiversity outcomes
- better incorporating biodiversity into strategic planning processes
- reforming the Biodiversity Offsets Scheme
- strengthening conservation on private land
- supporting landholders to drive improvements in land management practices and participate in natural capital markets
- improving biodiversity data, tools and reporting
- improving the regulation of native vegetation in rural areas
- commissioning independent advice on options to improve biodiversity outcomes in regional landscapes and enhance value and support for landholders.
Nature positive
Nature positive is a concept that was developed in 2019–20 to inspire action on the global biodiversity crisis, much as the net zero target galvanises climate change action.
The high-level goal of nature positive is to ‘halt and reverse nature loss by 2030 on a 2020 baseline and achieve full recovery by 2050’ ().
Delivering this goal requires measurable, net positive biodiversity outcomes through improvement in the abundance, diversity, integrity, and resilience of species, ecosystems and natural processes.
The concept is embedded in the Global Biodiversity Framework’s mission to 2030 to ‘take urgent action to halt and reverse biodiversity loss to put nature on a path to recovery for the benefit of people and planet’ ().
In December 2022, the Australian Government released its Nature Positive Plan: better for the environment, better for business. The plan outlines the Australian Government’s response to the 2020 independent review (PDF 6MB) of the Environment Protection and Biodiversity Conservation Act 1999.
The NSW Government has committed to developing and implementing a NSW nature strategy. The strategy, which will be a legal requirement under the Biodiversity Conservation Act 2016, will set goals and targets for conservation and restoration. These will include species recovery, landscape restoration and addressing threats, such as those outlined in this topic.
Monitoring and mapping
Nature positive spatial tools
The NSW plan for nature outlines the NSW Government’s commitment to identifying areas of the State that have high biodiversity value.
Mapping these areas using a single spatial tool, as recommended by the statutory review of the Biodiversity Conservation Act 2016, will help inform land use planning and nature positive outcomes.
The plan also commits to other improvements to mapping and monitoring, including:
- improving the accuracy of the Biodiversity Values Map
- comprehensive identification and mapping of threatened ecological communities
- ongoing native vegetation monitoring, including considering establishing a legislative requirement
- enhancing the Statewide Landcover and Tree Study program (SLATS) to capture both vegetation losses and gains (including revegetation and regrowth), reduce reporting time lags and enable accurate reporting of net changes in vegetation cover over time.
Measuring the health of native vegetation
NSW is transitioning to a different way of measuring the health of native vegetation. Rather than measuring ‘condition’, we are now measuring ‘integrity’ via the Biodiversity Assessment Method (BAM).
An example of how this has been used in northern NSW is in the NSW biodiversity outlook report 2024.
Ecological health performance scorecards
The Ecological health performance scorecards program is a biodiversity monitoring program by the NSW National Parks and Wildlife Service.
The pilot program measures the health of our national parks in eight sites across NSW by monitoring environmental indicators related to:
- the health of native plants and animals
- threats to ecological health, such as feral animals and weeds
- important ecological processes, such as soil chemistry and water quality
- fire patterns.
While most of the scorecards will be released in 2025, the first, for the Royal-Heathcote-Garawarra site, shows that despite being so close to urban areas, this area still has high conservation value. Key findings related to plants included:
- low levels of weeds away from high-use areas
- the critically endangered Scrub Turpentine (Rhodamnia rubescens) is significantly impacted by myrtle rust infection.
These findings will help inform management strategies for this site.
Urban greening
Shade provided by trees is important for:
- reducing heat in towns and cities
- improving air quality and reducing noise
- providing wildlife habitat
- increasing property, aesthetic and cultural values.
The NSW Government has been mapping urban tree cover across Greater Sydney since 2019. This helps councils plan and manage urban forests in local government areas.
The NSW Government has set a target to increase tree canopy cover across Greater Sydney to 40% by 2036.
The latest update shows an increase in canopy from 21% in 2019 to 21.7% in 2022. Most of this increase was in Central and Western Sydney local government areas ().
Land management
Aboriginal joint management
Aboriginal joint management has been in place in NSW national parks and reserves since its formal introduction in 1998. As at June 2024, about 30%, or 2,334,621 hectares of the NSW national park estate is jointly managed with Aboriginal people.
Joint management involves Aboriginal people who have a cultural association with a park being involved in park management or advising on its management.
Joint management of national parks ensures Aboriginal people have input into conservation measures, including feral animal and weed management, and Cultural Fire management.
See topic for further information.
Landcare Enabling Program 2023–27
This partnership between Local Land Services (LLS) and Landcare NSW supports:
- Landcare groups to develop their knowledge, skills and experience
- improved efficiency of groups and networks
- the increased self-sufficiency of Landcare groups and networks.
Local Land Services Landcare Riparian Restoration Project
Between 2021 and 2023, this collaborative project facilitated the restoration of riparian areas that had suffered cumulative damage from recent natural disasters (floods, fires and drought).
During the life of the project:
- 25 kilometres of streambanks were rehabilitated
- 776 hectares of riparian areas were restored
- 146 hectares of riparian vegetation was enhanced or rehabilitated
- 28 hectares of land were managed for weeds
- 7 alternative watering sites for stock were installed.
Natural Heritage Trust projects 2023–28
Projects to boost a range of species and landscapes are being delivered for five years by LLS, with Australian Government funding.
The projects aim to:
- increase environment protection
- encourage sustainable agriculture
- ensure better natural resource management across NSW.
See Natural Heritage Trust projects for more information.
Supporting landholders
Local Land Services (LLS) supports landholders in implementing sustainable land management and agricultural practices.
This includes advice on preserving and enhancing natural habitats and managing land to improve biodiversity.
LLS also advises landholders on evaluating environmental and natural capital markets in accordance with the NSW Natural Capital Statement of Intent.
Under the NSW plan for nature actions, LLS is responsible for building landholder capability and boosting landholder participation in natural capital markets, and expanding access to conservation and natural capital investments.
LLS has implemented a natural capital services and support program to help maximise private investment in nature and expand private landholder access to natural capital markets.
Between 2021 and 2024, LLS natural resource management programs achieved the following results:
- 6,577 hectares of wetlands were enhanced, rehabilitated or protected
- 14,561 hectares of rivers and estuaries were enhanced
- 2,946 hectares of land were revegetated
- 104,149 hectares of native vegetation were enhanced, rehabilitated or protected.
Private land conservation
More than 70% of the State’s biodiversity is on private land ().
The NSW Government committed more than $350 million over five years from 2019–20 to help the Biodiversity Conservation Trust deliver its private land conservation program.
This program was guided by the NSW Biodiversity Conservation Investment Strategy.
The NSW Biodiversity Conservation Trust managed 2,476 private land conservation agreements with landholders as at 30 June 2024, covering more than two million hectares of land ().
See the topic for further information.
Fire management
The NSW government’s Applied Bushfire Science Program addresses key recommendations from the 2020 NSW Bushfire Inquiry relating to the environment and recognition of Aboriginal cultural knowledge, and impacts of fire on Aboriginal cultural values. The program also advances the State's capacity to lead critical bushfire research.
The program is updating the ecological research and guidelines that directly influence fire planning and policy. An important focus includes establishing a central point of information for managing fire risk for native plants, animals and Aboriginal cultural values across the state.
The following questions are central to the research program:
- what fire management regime is best for a particular species
- how can we best manage fire risk in relation to cultural values.
Aboriginal peoples’ use of Cultural Fire was instrumental in maintaining a healthy landscape and managing flammable vegetation through frequent small fires. Recent studies have demonstrated that in south eastern Australia, shrub cover in woodlands increased due to the disruption to Cultural Burning after colonisation ().
One recommendation from the independent review of the Biodiversity Conservation Act 2016 was to incorporate traditional knowledges and practices into native vegetation management.
Cultural Fire
A dedicated team was created to lead the implementation of recommendations 25 and 26 of the NSW Bushfire Inquiry 2020.
This team is developing a NSW Cultural Fire Strategy to improve the coordination of Cultural Fire, explore its implementation on a wider basis and preserve the cultural integrity of Cultural Fire.
See the and the topics for further information about Cultural Burning.
The NSW Government has also established research partnerships with a range of universities and the Bushfire and Natural Hazards Research Centre. This will further improve our understanding of how threatened plant species respond to planned and unplanned fire and support effective management.
Protecting threatened species
Threatened Species Action Plan
The Australian Government’s updated Threatened Species Action Plan 2022–2032 lays out actions to protect, manage and restore Australia’s threatened species and important natural places.
The plan lists 30 priority plant species and 20 priority places across Australia, identifying key threats and actions that can be taken to protect them.
Several of these plant species and places are found in NSW, including:
- Native guava (Rhodomyrtus psidoides)
- Wollemi pine (Wollemia nobilis)
- Greater Blue Mountains
- Brigalow Country.
Threatened species and ecological communities programs
A performance audit assessed whether the NSW Department of Climate Change, Energy, the Environment and Water (DCCEEW) has effectively delivered outcomes to support threatened species and ecological communities across NSW, including delivery of the statutory Biodiversity Conservation Program (Saving our Species).
The audit found that DCCEEW had taken action to conserve fewer than one‑third of all threatened species and ecological communities. This number had decreased over time, in line with reduced program funding.
Recommendations included:
- strengthening compliance, governance, planning and risk management frameworks when working with threatened species
- developing a long‑term framework to coordinate and align efforts to conserve threatened species
- improving coordination among government agencies when delivering activities to increase effectiveness and decrease duplication of effort.
Threatened species framework for zero extinctions
The NSW National Parks and Wildlife Service has adopted a zero-extinction target for threatened species on land managed by the agency.
Actions to support this target and restore populations of threatened species are set out in the threatened species framework for zero extinctions.
The first report published under the framework was released in September 2024. It includes an overview of relevant programs and initiatives and highlights achievements during 2021–22 and 2022–23.
Saving our Species
The Saving our Species program aims to:
- maximise the number of threatened species and ecological communities that are secure in the wild in New South Wales for 100 years
- minimise the impacts of key threatening processes.
Saving our Species delivered actions across more than 210 projects for threatened plants and ecological communities in 2023–24. These actions were at more than 480 sites across NSW.
For example, Saving our Species program staff collaborated with Botanic Gardens of Sydney to:
- develop propagation techniques for eight threatened orchid species and establish a collection of seedlings that can be translocated to suitable habitat
- undertake genetic analysis of threatened plant species to inform critical management actions
- collect, store and test the seeds of high priority threatened plants.
Key threatening processes to native vegetation managed under the program include:
- infection of native plants by Phytophthora cinnamomi
- the invasion, establishment and spread of Lantana camara.
Invasive species
Weed management
In NSW weed management is prioritised based on risk as evaluated through the NSW Weed Risk Management system.
The risk for each weed is assessed based on the potential impacts if it becomes more established or more widespread.
Weeds that are considered a State biosecurity risk are managed using instruments such as Control Orders and Biosecurity Zones under the Biosecurity Act 2015 and the Biosecurity Regulation 2017 – Weeds.
These include rubber vine (Cryptostegia grandiflora) and mouse-ear hawkweed (Pilosella officinarum), both listed as Prohibited Matter under the Biosecurity Act 2015. Both are on track for eradication in NSW by the Department of Primary Industries and Regional Development.
The Regional Strategic Weed Management Plans also use risk to prioritise weed management in the 11 LLS regions.
The plans play a critical role in the early detection and eradication of priority weed species and the containment and management of those that are more widespread.
They list 64 weed species that have been assessed as regional priority weeds for conservation and environmental land use areas in NSW.
Of these, 13 are managed with the goal of preventing their spread in at least one LLS region. These include weeds such as leaf cactus (Pereskia aculeata) and horsetails (Equisetum spp.).
A further 38 regional weed species are being managed with the goal of eradication in at least one region. These include a wide range of priority species, such as:
- bridal creeper (Asparagus asparagoides)
- Hudson pear (Cylindropuntia pallida)
- sea spurge (Euphorbia paralias).
Another 34 species are managed for containment and asset protection in at least one LLS region.
These include opuntioid cacti, such as the prickly pears (Opuntioid spp.) and Hudson pear (Cylindropuntia pallida), which are being managed successfully through biocontrol programs and targeted on ground management ().
Other widespread species, including blackberry (Rubus fruticosus species aggregate), Lantana camara and serrated tussock (Nassella trichotoma), are managed using an asset protection approach through programs such as Saving our Species, which manage weeds and other threats to native species holistically. These programs aim to reduce weed impact at specific affected locations ().
LLS supports rural landholders to fulfil their responsibilities to manage weeds in accordance with Australian and NSW biosecurity legislation and Regional Strategic Weed Management Plans.
For example, from 2021 to 2024, LLS helped manage weeds on 141,100 hectares of private rural land for improved biosecurity, agricultural productivity and biodiversity.
Weed management in national parks
Weeds threaten biodiversity across NSW national parks and can also cause damage to areas that are culturally and historically important, such as Aboriginal rock art sites.
Working together with similar agencies, NSW National Parks and Wildlife Service (NPWS) manages programs that tackle these threats. NPWS has developed specific regional pest management strategies, which are used to guide and implement best practice control and monitoring programs in national parks and reserves. In relation to weeds, the strategies aim to:
- prevent or reduce the amount of new and emerging weeds
- help stop the destructive impact of weeds on threatened plants and animals, agriculture and cultural heritage.
NPWS plans weed control programs for where they’ll have the most benefit for biodiversity and the greatest cultural and community value. For example, weeds might be removed from areas where they’re impacting threatened species and their habitat.
Invasive animals
Each LLS area in NSW has regional pest animal committees. These committees coordinate activities to manage invasive animals on both public and private land. They have developed 11 Regional Strategic Pest Animal Management Plans.
See the ‘Responses’ in the topic for more information about how invasive animals are controlled in NSW.
Fire ants
The Biosecurity (Fire Ant) Emergency Order (No. 12) 2024 places restrictions on the movement of materials that may carry fire ants from one location to another. These include organic mulch and compost, turf, hay and chaff, potted plants, earthmoving equipment, sand and gravel.
The order sets out rules and requirements for safely transporting and using these carriers, and states the penalties for breaching the conditions.
Community involvement
Citizen science
Citizen science projects, in which community members gather data, photos and observations, are rapidly becoming more popular in Australia. They:
- allow community members to engage with environmental issues and scientists
- increase people’s knowledge of, and interest in, conservation
- support traditional scientific research and monitoring.
The collaboration between community members and scientists also means data is collected more often over a longer period than is possible in a research project staffed only by scientists.
Some citizen science projects involving the protection of native vegetation include:
The data collected through these and other apps and projects helps build knowledge of the distribution and health of native vegetation across NSW.
Trees Near Me app
The NSW Government launched its Trees Near Me NSW app in August 2022.
The app provides information about plant community types and plant species, such as where they grow (or grew, before clearing), and their natural habitat.
By planting locally native trees, people can provide more habitat for native animals that may be struggling and help increase the spread of native vegetation.
Restore Trees NSW
The NSW Government has recently released a new mobile and web-based app that shows the best locations for looking after and replanting vegetation in NSW.
Restore Trees NSW provides a range of environmental information for any location in NSW including vegetation, threatened fauna, soils, climate and topography.
The app also links to helpful online resources, information, such as seed suppliers, finance, community help and Local Aboriginal Land Councils.
Volunteer groups
Volunteer groups contribute enormously to improving and conserving the natural environment.
Landcare Australia is one of the largest volunteer organisations, made up of thousands of groups and more than 100,000 volunteers across Australia.
Bushcare groups managed by local councils weed and revegetate native bushland to improve and create habitat for native species.
Data gaps
More native plant species than vertebrate animals are threatened in Australia, but they are only about half as likely to be the focus of monitored conservation programs ().
There is information for only a few isolated species of many plant groups. This lack of information provides little insight into the broader status and management needs of these groups.
Patterns of decline that are likely to have been present for many years are still being discovered in lesser studied groups of species.
Future opportunities
Mapping and monitoring
While several data sources are available on the impact of weeds, this information is localised and dispersed across multiple agencies. There is an opportunity to collate and centralise this data so that it can provide an up-to-date statewide overview.
NSW is preparing to integrate the NSW vegetation hierarchy with a Global Ecosystems Typology. This will enable a better understanding of the global context of NSW vegetation and habitat, and facilitate integrated monitoring and reporting.
Research and development is underway to enable reporting on extent of native woody vegetation regrowth in addition to native vegetation clearing in NSW. Measuring the condition of regrowth in comparison to remnant vegetation via remote sensing methods is not yet possible. These analyses, once established, would support an annual reporting process for woody vegetation loss and regrowth/revegetation on rural regulated land, which is included in the NSW plan for nature.
A variety of technologies are being researched to better map and report on native grasslands across NSW. Traditionally, native grasslands have been difficult to map using remote sensing and on-ground survey has been poor. Natural native grasslands and derived grasslands, which can retain important native species, are currently being researched.
Technology
New options are becoming available for improving and expanding mapping and analysis of native vegetation.
Better satellite coverage linked to extensive on-ground data is for the first time enabling a comprehensive overview of native vegetation in NSW. This has improved our understanding and ability to report on statewide ecosystems.
Scientists can now better identify native vegetation quality by analysing data from drones using artificial intelligence (AI) and machine learning.
When AI and machine learning are integrated with the Internet of Things and networks of sensors across the State, scientists can collect and monitor in real-time data such as soil moisture, temperature, humidity and vegetation condition. Such analysis can provide early warnings of drought stress or disease outbreaks.
The use of AI also allows integration of data from satellites, ground-based sensors and historical records, for a more comprehensive understanding of vegetation health.
And passive acoustic surveillance technology can detect invasive species outbreaks.
Advances such as these will allow monitoring to occur at sites and in timeframes that would otherwise not be possible.
References
DCCEEW unpub., Threatened Plant Species (unpublished), NSW Department of Climate Change, Energy, the Environment and Water, Sydney