 Image source and description
Topic image:Worimi Country–Port Stephens. Photo credit: Greg West/DPI (2021). Special conditions apply.Banner image:Topic image sits above Butjin Wanggal Dilly Bag Dance by Worimi artist Gerard Black. It uses symbolism to display an interconnected web and represents the interconnectedness between people and the environment.
Image source and description
Topic image:Worimi Country–Port Stephens. Photo credit: Greg West/DPI (2021). Special conditions apply.Banner image:Topic image sits above Butjin Wanggal Dilly Bag Dance by Worimi artist Gerard Black. It uses symbolism to display an interconnected web and represents the interconnectedness between people and the environment.

Extreme climate and weather 2024
Rising temperatures are driving more intense rainfall events, ‘hot days’ and severe fire weather days in NSW.
NSW State of the Environment
This Extreme climate and weather 2024 page reflects the State of the Environment 2024 report as tabled in parliament for this section.
Overview
Weather is a short-term state of the atmosphere, whereas climate is the long-term condition.
Extreme climate, such as warmer land and ocean temperatures, influences our weather patterns. Projections indicate that our climate will become more extreme, with historical trends and current status demonstrating that these are occurring faster and more intensely than predicted.
See the and topics for more information about human-induced climate change.
Extreme weather is weather that occurs with extreme severity, such as heavy rainfall over a short period, or when least expected, such as a very hot day in winter. Extreme weather events could cause damage to the environment, communities and infrastructure.
Increased frequency and intensity of extreme weather events also cause damage to Aboriginal cultural sites and landscapes.
Although extreme weather occurs naturally, human-induced climate change is changing the frequency, intensity or duration (happens more, or less often, becomes more intense or lasts longer) of different types of extreme weather events.
There is strong evidence that the future climate will be hotter, which has implications on heat-related extreme weather events. While there is strong evidence of increasing risk of more extreme heat events and fire danger, projected changes to the frequency, intensity and duration of hazards that are influenced by rainfall such as, droughts, storms and floods are less certain.
Why is extreme climate and weather a problem?
Being more variable than expected, extremes in climate and weather can cause damage in ways we are not prepared for. This includes severe changes to our environment, damage to infrastructure, harm to the environment, short- and long-term health problems, and effects on livelihoods and economic growth.
Should extremes in our climate and weather become more common, our environment, communities and infrastructure may lack the resilience needed to avoid damage or recover.
Significant research is being undertaken into modelling and projecting changes to the climate to better understand what may happen in the future.
Globally, communities and governments are committed to reducing greenhouse gas emissions to mitigate climate change. They are developing policies and programs to prepare for, respond to and increase resilience to extreme weather.
See the topic for more information.
Extreme weather events in NSW
In NSW, extreme weather events of greatest concern are extreme rainfall, hot days and severe fire days. These extremes in weather can increase the risk of flooding, heatwaves and bushfires, respectively. Other impactful extreme weather events are strong winds, hail, storms and cyclones.
The risk of drought is also a concern in NSW. Drought may develop over a long period of low rainfall, or it may result from a sudden drying of the land. Drought conditions may be brief, or they may last for many years.
Recent examples of events resulting from extreme weather include the Black Summer bushfires of 2019–20, the Northern Rivers floods of 2022, as well as localised and unexpected storm events such as the Port Macquarie cyclone and the Christmas day hailstorm in Grenfell.
What are we doing?
The NSW and Australian Regional Climate Modelling project, or NARCliM, uses high-resolution regional climate models to project future climate changes in NSW, south-east Australia and parts of Australasia (; ).
This report relies on the newest NARCliM data (NARCliM2.0) to understand future extreme climate in NSW.
Visit the AdaptNSW website to learn more about how climate change may different regions in NSW.
NARCliM projections can be explored using an interactive climate change map or downloaded from NSW Climate Data Portal.
It can be inferred from climate projections that the frequency, intensity or duration of certain types of extreme weather could increase. It is more important than ever to prepare for and respond to extreme weather events.
The NSW Government is:
- reducing greenhouse gas emissions to lessen the impacts of ongoing temperature increases due to climate change
- supporting environmental restoration to provide natural buffers and refuge from extreme weather
- adapting our infrastructure and planning to be resilient to weather extremes
- supporting communities to be aware of, prepared for and responsive to extreme weather.
Table C2.1 lists the current key legislation and policies related to climate change mitigation and adaptation in NSW.
Table C2.1: Current key legislation and policies related to extreme climate and weather in NSW
| Legislation or policy | Purpose |
|---|---|
| Climate Change (Net Zero Future) Act 2023 | The main features of the act are:
|
| NSW Reconstruction Authority Act 2022 | Promotes community resilience to the impact of disasters in NSW through disaster prevention, preparedness and adaptation, and recovery and reconstruction following disasters. This act also establishes the NSW Reconstruction. |
| State Emergency and Rescue Management Act 1989 | Outlines responsibilities, powers and coordination mechanisms for responding to emergencies, including extreme weather events and hazards. Also requires the preparation of state, regional and local Emergency Management Plans and Recovery Plans. |
| Disaster Adapation Plans | Outline projects, strategies or actions to mitigate or minimise the impact of disasters caused by natural hazards at a local level. These plans are aligned to the State Disaster Mitigation Plan. |
| EPA’s Climate Change Policy and Climate Change Action Plan 2023–26 | Outline a comprehensive regulatory approach and set of actions to address the causes and consequences of climate change in NSW. They include actions to support licenced industries to decarbonise and build resilience to climate change. |
| NSW Climate Change Adaptation Action Plan 2025–2029 | This whole-of-government plan includes 46 actions led by eight agencies that target known climate change impacts and risks and help work towards achieving the Climate Change (Net Zero Future) Act 2023's adaptation objective. The actions help create the knowledge, skills, resources and processes needed to enable further adaptation on a larger scale. The plan states that decisions on adaption in NSW should be planned and based on comprehensive analysis of the best available information, including Aboriginal knowledge systems. The strategy includes ‘Enable Aboriginal adaptation’ as a key criterion in establishing Adaptation Action Plans which will include actions co-designed with Aboriginal communities to promote social, economic and cultural wellbeing. |
| State Disaster Mitigation Plan | Designed to improve community resilience and better prepare NSW to face the challenges of disasters caused by natural hazards, such as floods, bushfires, storms and cyclones, coastal erosion and inundation. |
Notes:
See the Responses section for more information about how are being addressed in NSW.
Related topics: | | | |
Status and trends
Extreme climate projections
This section uses climate modelling projections rather than indicators based on observed trends.
A summary of extreme climate projections under low- and high-emissions scenarios is provided to indicate future trends (see Table C2.2).
See Scenarios used in modelling climate projects in the topic for more information about the scenarios used in modelling climate projections.
Table C2.2: Summary of extreme climate projections for NSW relative to a baseline period between 1990 and 2009
| Extreme weather type | Definition | Low-emissions SSP1–2.6 (by 2080–99) | High-emissions SSP3–7.0 (by 2080–99) |
|---|---|---|---|
| Extreme rainfall | Infrequent, intense rainfall (daily 99th percentile of precipitation). May increase the risk of flooding. | Decrease in summer. Decrease in winter over eastern and coastal regions but increase in winter over inland regions. | Increase in summer, particularly over eastern and central regions. Decrease in winter over eastern and coastal areas but increase over inland regions. |
| ‘Hot days’ | Maximum temperature is higher than or equal to 35°C. May increase the risk of heatwaves. | More days above 35°C on average each year by 2080–99 (about 15.9 additional days per year), especially in northern NSW. | Far more days above 35°C each year (about 45.5 additional days per year), especially in northern NSW. |
| Severe fire weather | Forest Fire Danger Index >50. Combination of high temperatures, low humidity, no recent rainfall and wind. When combined with other factors, such as dry conditions, may increase the risk of bushfires. | More days of severe fire weather (about 3.5 additional days per year on average), especially in northern and western NSW. | Twice as many severe fire weather days as now (about 9.4 additional days per year), especially in northern and western NSW. |
Notes:
Projections are discussed in more detail in the Extreme rainfall, ‘Hot days’ and Severe fire weather sections.
Due to the many definitions of drought and the complex interactions involved between the atmosphere and land surface, making projections for drought conditions difficult. Some studies suggest that drought intensity and frequency may increase over most areas of NSW (), while the Upper Tablelands and Great Dividing Range areas may remain stable or improve ().
Flash droughts that develop quickly over shorter periods are also challenging to project ().
Events resulting from extreme weather 2021–24
Between June 2021 and June 2024 there were 62 extreme weather events declared as ‘natural disasters’ in NSW.
In part, owing to consecutive La Niña seasons across the past four years, the more damaging of these events have arisen from extreme and prolonged rainfall, rather than the dry weather, heat and bushfires cited in the State of the Environment 2021.
Major rainfall, storm and flooding events in this reporting period include some of the most devastating and widespread in NSW history:
- NSW-wide flooding (February to July 2022) – 61 local government areas affected; 9 flood-related deaths in NSW; estimated $3.35 billion of damage in NSW and Queensland combined.
- Northern Rivers, Mid North Coast and Sydney flooding (March to June 2021) – about 62,000 people evacuated; 2 flood-related deaths; estimated $629.6 million in damage.
- Sydney and Hunter flooding (June to July 2022) – 37 local government areas affected; 14,500 homes damaged; 5,000 left uninhabitable.
- Eugowra flooding (November 2022) – 159 people evacuated; 2 deaths; 80% of homes in the town affected; estimated $150 million in damage.
- NSW-wide floods (September 2022 to March 2023) – 157 homes destroyed; 2,816 left uninhabitable.
Many individuals, families and communities remain physically, mentally and emotionally affected by these events. Recovery efforts for the more recent events are still underway.
A full report of the 2022 NSW Flood Inquiry was commissioned in response.
It is difficult to attribute these floods to climate change. Moreover, it is not possible to predict the type and severity of future flooding.
Nonetheless, research indicates that extreme events are likely to become more frequent, intense or longer in duration (; ; ). Investing in infrastructure, planning and recovery funding for all types of extreme weather events will help to develop and sustain resilient communities.
Climate modelling
To better understand the range of extreme weather we may face, the NSW Government has developed a high-resolution regional climate modelling project called NSW and Australian Regional Climate Modelling, or NARCliM.
NARCliM1.0 was released in 2014, focusing on NSW, the ACT and parts of Australasia. NARCliM2.0 was released in 2024, incorporating new data on global emissions and climate change, increasing the resolution of projections and delivering technical improvements ().
NARCliM2.0 downscaled global climate models to project potential changes in climate under future global climate scenarios ().
These scenarios are known as the Shared Socioeconomic Pathway-Representative Concentration Pathways (SSP-RCPs). They describe how the world may develop under different levels of greenhouse gas emissions ().
This chapter refers to two scenarios:
- SSP1–2.6 – a low-emissions scenario where global CO2 emissions are cut to net zero by about 2075 and estimated global warming is 1.3–2.4°C by 2100
- SSP3–7.0 – a high-emissions scenario where global CO2 emissions are projected to double by 2100 and estimated global warming is 2.8–4.6°C by 2100.
See Scenarios used in modelling climate projects in the topic for more information on Shared Socioeconomic Pathways.
Uncertainty remains in the estimation of future extreme weather under NARCliM2.0 projections:
- The extent of climate change depends on future global rates of emission of greenhouse gases ().
- Extreme weather is affected by variability of natural drivers, such as El Niño Southern Oscillation (ENSO),the Indian Ocean Dipole and Southern Annular Mode ().
- NARCLiM2.0 uses one of several approaches for estimating future climate and is best practice. While it is unique for being the first regional climate modelling in Australia to simulate at very high resolution, there is no single ‘right way’ to project future climate.
- NSW is a large state with diverse topography, these factors significantly influence its climate and weather.
NARCliM2.0 is now being used to prepare projections for aadditional extreme weather events like heatwaves, droughts and storms. See the AdaptNSW website to learn more.
Extreme rainfall
Historical trends over the past 20 years strongly suggest an increase in the intensity of short-duration rainfall (less than an hour) near Sydney. Short-duration intense rainfall is one of the factors that can increase the risk of flooding ().
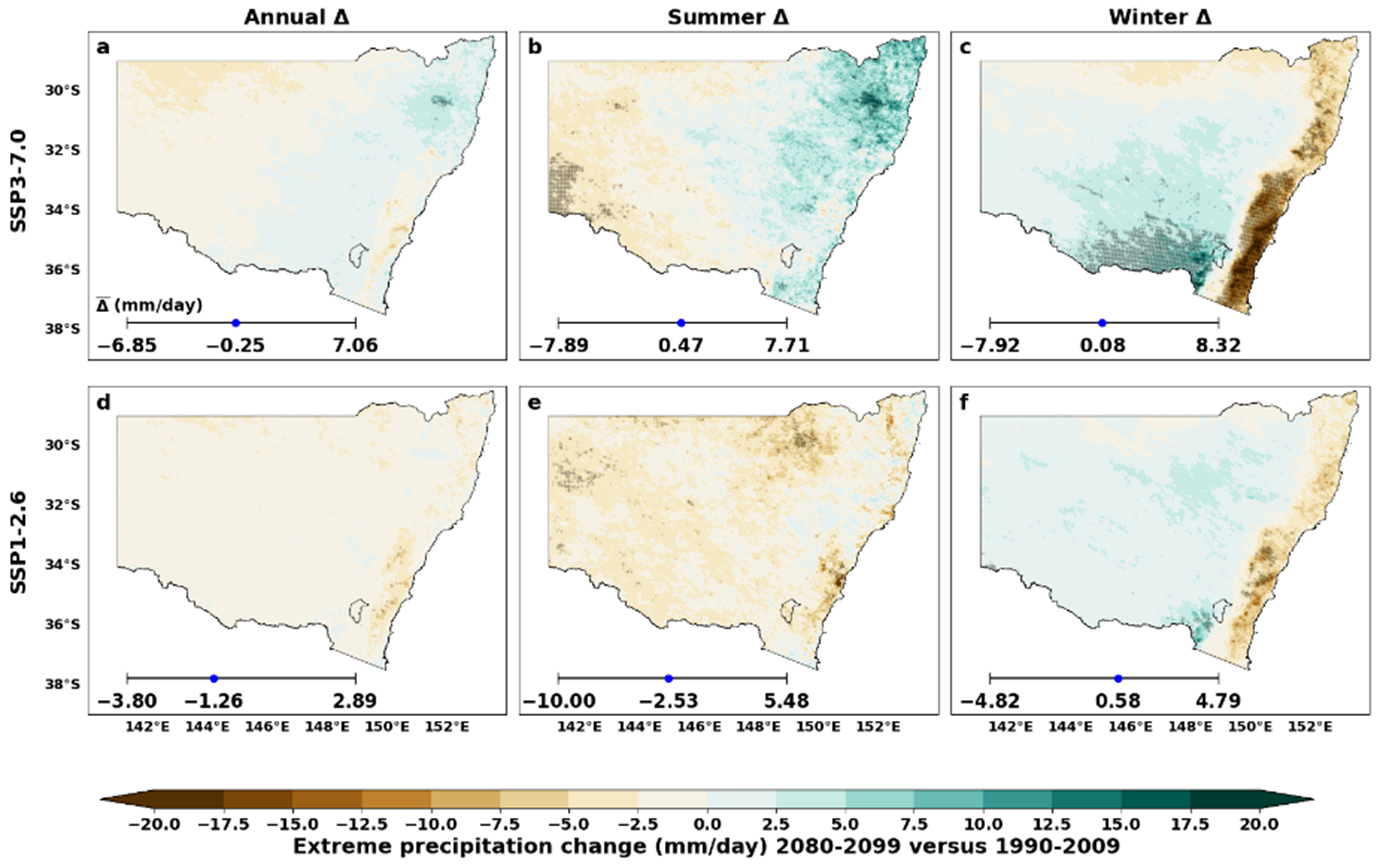
Extreme rainfall is projected to change depending on the season and geographic area of NSW (see Figure C2.1). In this topic, the intensity of extreme rainfall is represented by the daily 99th percentile of precipitation. This means that extreme rainfall is infrequent, with high precipitation levels ranking in the top 1%.
The modelling results are highly variable, with some models projecting reductions and others projecting increases. These uncertainties suggest that further research is needed.
Annual projections show mixed signals in extreme precipitation events. Winter projections have greater consistency among the NARCLiM2.0 models than summer projections. Extreme rainfall in winter is projected to decrease along the coast and increase inland, especially under the high-emissions scenario.
Under a high-emissions scenario (SSP3–7.0) by 2080–99
- Annual (Figure C2.1, map a): Overall small change in the annual mean of −0.25 millimetres (mm) per day (with a range of −6.85 to +7.06mm per day). This highlights more drying in north-western regions and precipitation increases along and to the west of the Great Dividing Range, with general reductions along coastal regions except in the north-east.
- Summer (map b): Increases in extreme rainfall intensity are projected for North Coast NSW during summer.
- Winter (map c): Variation in trend extreme rainfall across NSW (-7.9 to 8.3mm). Inland regions, particularly those in the Riverina, show a slight increase in extreme rainfall during winter. In contrast, there is a reduction in extreme precipitation in coastal NSW east of the Great Dividing Range. This indicates potential increases in extreme precipitation over inland regions that could have impacts like contributing to an increased risk of flash flooding. In contrast, there is a projected reduction in extreme precipitation along the eastern and coastal regions.
Under a low-emissions scenario (SSP1–2.6) by 2080–99
- Annual (map d): General reduction in extreme daily precipitation across NSW of 1.26mm per day (with a range of −3.80 to +2.89mm per day), dependent on the model in NARCLiM 2.0, indicating that some models project more drying, while others suggest strong precipitation increases across the State.
- Summer (map e): More pronounced decrease in extreme precipitation of 2.53mm per day (with a range of –10.0 to +5.48mm per day).
- Winter (map f): Increase in extreme precipitation over inland regions of 0.58mm per day (with a range of −4.82 to +4.79mm per day). This indicates potential increases in extreme precipitation under a low-emissions scenario over some regions, particularly inland, whereas a drying signal is predicted for eastern and coastal regions, although the magnitude of this reduction in extreme precipitation is less under the low emissions scenario.
See the Interactive climate change projections map for an in-depth exploration of NARCliM 2.0 data.
Figure C2.1: Projected changes (difference ∆ between 2080–99 and 1990–2009) in daily 99th percentile of precipitation (%)
Notes:
NARCliM2.0 modelled changes in extreme precipitation in 2080–99 under SSP3–7.0 (maps a, b, c) and SSP1–2.6 (maps d, e, f). Annual (maps a & d), summer (maps b & e) and winter (maps c & f) projections are presented.
The average change (∆) from all the models comprising NARCliM2.0 are shown at the bottom left of each plot, along with the range of changes from the individual models.
The stippling (small dots) shows areas where projected changes are statistically significant.
The Mann–Whitney U test (α = 0.05) is used to test the statistical significance.
See Table C1.4 in the topic for more information on scenarios used in modelling climate projections.
Risk of storms
Projections for storms vary from highly confident to highly uncertain (; ; ).
Studies using previous NARCliM projections suggest decreases in the frequency of East Coast Lows (ECL) over eastern Australia especially in winter. The amount of rain and the wind speed of these lows are projected to increase, meaning less frequent storms that are potentially more severe (; ; ; ). Studies using NARCliM2.0 will provide updated insights on frequency and severity of storms.
Hail is one of the leading causes of insured losses in Australia.
Data from 1979 to 2021 show that the number of hail-prone days per year decreased across much of Australia but increased in some heavily populated areas. The annual number of hail-prone days in and around Sydney increased by about 40% ().
While projections suggest that climate change could decrease the frequency of hailstorms and increase their severity, there is large variation in observed and modelled changes, so hailstorm responses to climate change remain highly uncertain in Australia and across the world (; ).
Risk of flooding
The increase in extreme rainfall does not necessarily result in increased risk of flooding, however, projections of rainfall and flood frequency are regionally consistent ().
Projecting future risk of flooding in NSW is difficult and requires consideration of many factors, including atmospheric conditions, catchment development and land use changes, such as urbanisation ().
Rising sea levels are likely to increase the risk of flooding in coastal and estuarine areas, placing these areas at further risk (; ).
See the topic for more information about sea level rise.
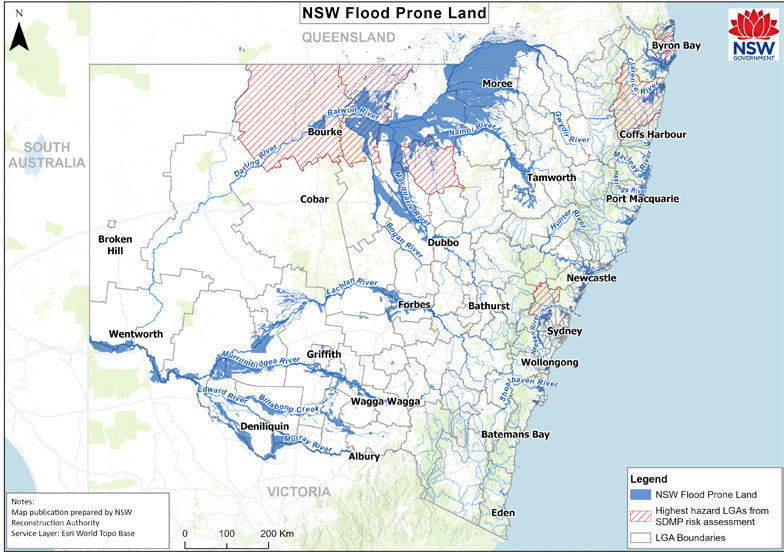
Most NSW communities along major river systems and in coastal areas are already vulnerable to floods (see Map C2.1). The Hawkesbury, Clarence Valley, Ballina, Coonamble and Bourke Local Government Areas are the most prone to damage from extreme rainfall and the increased risk of flooding (blue and striped areas in map).
Map C2.1: Flood-prone areas across NSW
‘Hot days’
To measure one type of heat extreme in weather, NARCliM2.0 models ‘hot days’.
‘Hot days’ are defined as days where the maximum temperature is greater than or equal to 35°C (). This is a useful measure of the effects of extreme heat on people, as human susceptibility to heat stress, stroke and exhaustion increases at these temperatures (; ).
The number of hot days in NSW tend to increase with distance inland. Currently areas near the coast have an average of less than 10 hot days per year near the coast and while inland north-western areas have an average of about 80 hot days per year ().
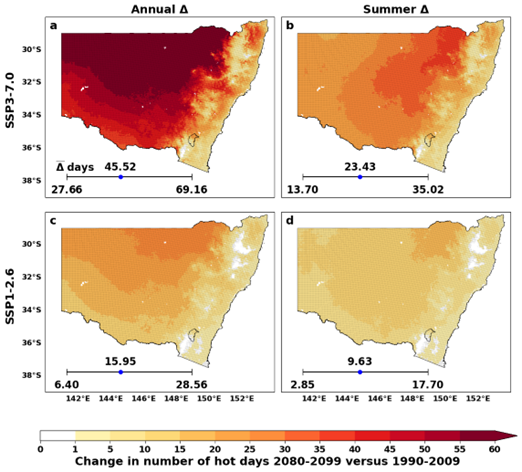
The number of hot days is projected to increase under all emission scenarios and across all seasons. Almost all increases are statistically significant (see Figure C2.2).
Under a high-emissions scenario (SSP3–7.0) by 2080–99:
- Significantly higher number of hot days.
- Annual (Figure C2.2 map a): Average increase of 45.5 hot days per year and up to 60 in the north of the State (dark red area).
- Summer (map b): Average increase of 23.4 hot days and up to 30 in areas west of the Great Dividing Range (dark orange area).
Under a low-emissions scenario (SSP1–2.6) by 2080–99:
- Annual (map c): Average increase of 15.9 hot days per year and up to 20 in northern NSW (orange area).
- Summer (map d): Average increase of 9.6 hot days and up to 15 in northern NSW.
The largest increases in the number of hot days will occur in the north and west of the State.
The impacts of hot days on coastal areas may be greater, as these areas hold most of our population and some infrastructure is not designed to handle extreme heat conditions. Conditions are also likely to be made worse by urban development.
Figure C2.2: Projected changes (difference ∆ between 2080–99 and 1990–2009) in ‘hot days’
Notes:
NARCliM2.0 modelled changes in number of hot days in 2080–99 under SSP3–7.0 (maps a, b, c) and SSP1–2.6 (maps d, e, f). Annual (maps a & c) and summer (maps b & d) projections are presented.
The average change (∆) from all the models comprising NARCliM2.0 are shown at the bottom left of each plot, along with the range of changes from the individual models.
The stippling (small dots) shows locations where projected changes are statistically significant.
The Mann–Whitney U test (α = 0.05) is used to test the statistical significance.
See Table C1.4 in the topic for more information on scenarios used in modelling climate projections.
See the topic for more information about average surface temperature overland increase projections.
Risk of heatwaves
Heatwaves (prolonged periods of above average heat for the expected season) have increased in intensity, duration and frequency in parts of NSW since 1911 ().
The most significant increases in heatwave intensity have occurred just inland of the east coast, along the Great Dividing Range, in parts of the Far West and along the eastern seaboard ().
Significant increases in urban heat intensity could be worse under a high-emissions scenario ().
Find out more about heatwaves in Australia.
Impacts in urban areas
‘Hot days’ and heatwaves can be significantly worse in urban areas owing to a combination of heat-absorbing concrete and building materials, as well as limited vegetation and tree canopy coverage, known as the urban heat island effect ().
Temperature increases caused by the urban heat island effect are usually greater at night than during the day and during winter than during summer.
The urban heat island effect is of particular concern for communities in NSW expecting population growth and urban development, which make them particularly susceptible to an increase.
The largest temperature increases due to the urban heat island effect are projected to occur in areas converted from forest and grasslands to new urban development () or in areas of intense urbanisation.
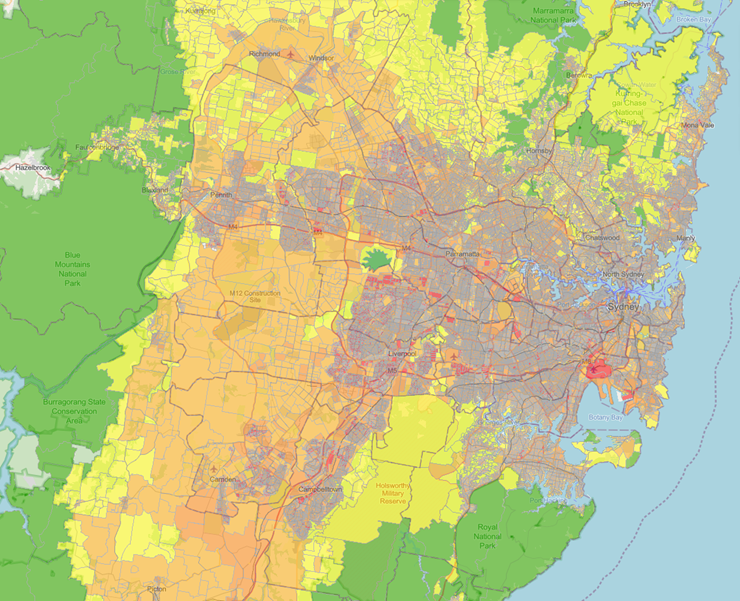
Large parts of south-western Sydney are expected to be 3–6°C warmer than non-urban areas (see Map C2.2, orange areas). Intensely urbanised areas such as Sydney Airport are expected to be more than 9°C warmer (see Map C2.2, red areas).
These urban heat effects will further increase the impacts of projected increases in hot days and heatwaves, particularly in areas such as Western Sydney ().
Find out more about the urban heat island effect in Sydney.
Map C2.2 Urban heat island effects in Sydney
Notes:
Green = cooler than baseline
Yellow = 0–3°C warmer
Light orange = 3–6°C warmer
Dark orange = 6–9°C warmer
Red = 9–12°C warmer
Baseline temperatures for this analysis were taken from well vegetated urban areas.
Severe fire weather
Severe fire weather conditions feature a combination of high temperatures, low humidity, no recent rainfall and wind, increasing the risk of bushfire occurrence and spread.
Severe fire weather risk is represented in NSW by the Forest Fire Danger Index (FFDI). This combines vegetation dryness, air temperature, wind speed and humidity to create a risk level ().
The number of severe fire weather days (days when FFDI is greater than 50) is projected to increase under both high- and low-emissions scenarios (see Figure C2.3).
More frequent severe fire weather days are expected inland, particularly in the north-west of NSW.
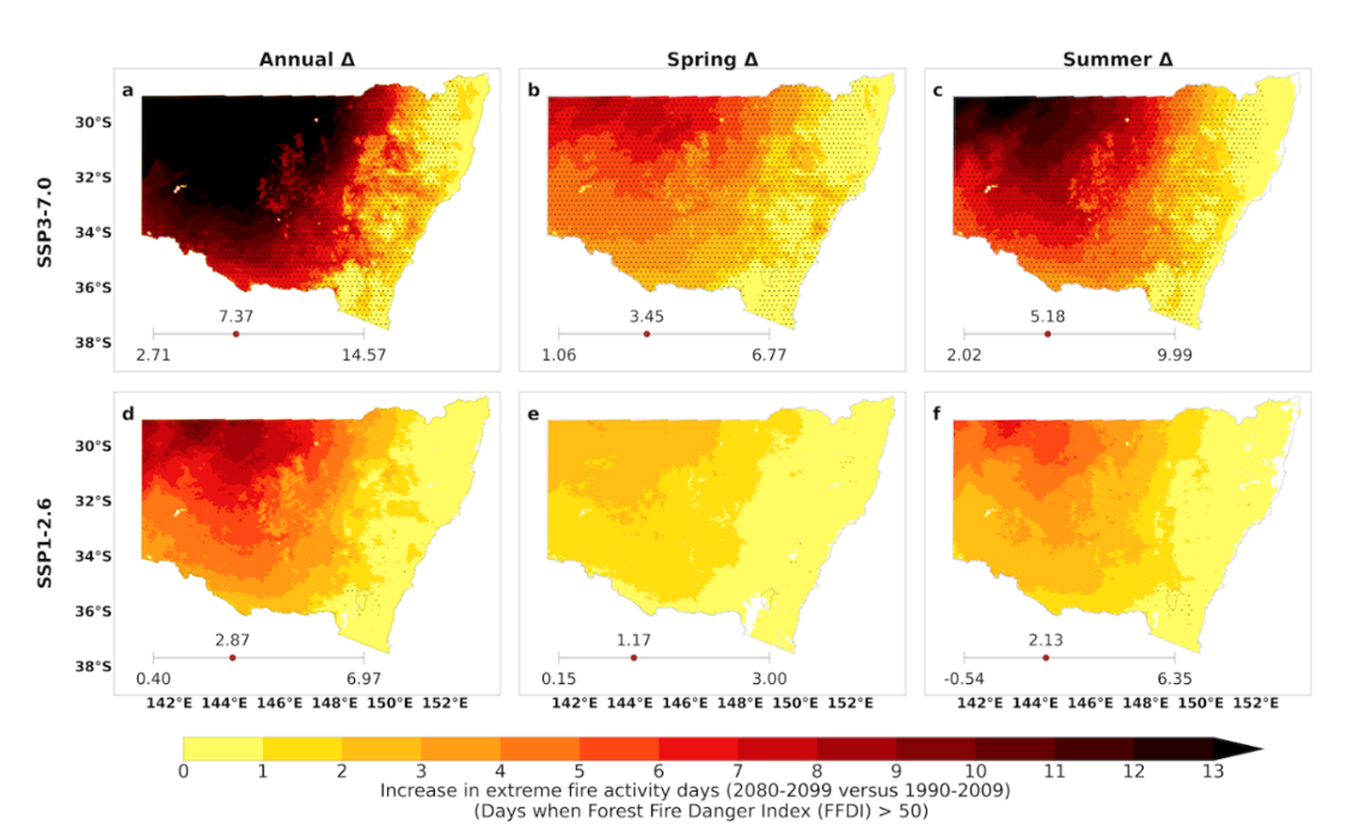
Under a high-emissions scenario (SSP3–7.0) by 2080–99:
- Much higher number of severe fire weather days.
- Annual (Figure C2.3 map a): Average increase of 9.4 days per year and up to 14 in north-western NSW (black area).
- Spring (map b): Average increase of about 3 days in spring over some eastern regions and up to 8 in north-western NSW (red area).
- Summer (map c): Average increase of about 5 days in summer and up to 13 in north-western NSW (dark red area).
Under a low-emissions scenario (SSP1–2.6) by 2080–99:
- Annual (map d): Overall increase of 3.5 days per year on average and up to 10 in north-western NSW (red area).
- Spring (map e): Average increase of about 1 day and up to 3 in north-western NSW (orange area).
- Summer (map f): Average increase of about 2 days and up to 6 in north-western NSW (red area).
The east coast is projected to experience fewer additional severe fire weather days than the north and west of the State.
Projections show notable increases in severe fire weather days annually (map a) and in summer (map c) under a high-emissions scenario.
See the Interactive climate change projections map for in-depth exploration of NARCLiM2.0 data.
Figure C2.3: Projected changes (difference between 2080–99 and 1990–2009) in the number of extreme fire activity days
Notes:
Extreme fire activity days are defined as days when the forest fire danger index – FFDI – is greater than 50.
NARCliM2.0 modelled changes in extreme fire activity days in 2080–99 under SSP3–7.0 (maps a, b, c) and SSP1–2.6 (maps d, e, f). Annual (maps a & c) and summer (maps b & d) projections are presented.
The average change (∆) from all the models comprising NARCliM2.0 are shown at the bottom left of each plot, along with the range of changes from the individual models.
The stippling (small dots) shows locations where projected changes are statistically significant.
The Mann–Whitney U test (α = 0.05) is used to test the statistical significance.
See Table C1.4 in the topic for more information on scenarios used in modelling climate projections.
Risk of bushfire
The combination of severe fire weather and periods of low rainfall can increase the risk of bushfire.
Bushfires in NSW can be extremely destructive, resulting in substantial costs, including the loss of human lives, buildings, infrastructure and livestock.
Although bushfires are a natural part of the Australian environment, climate change is increasing the frequency, duration, extent and intensity of ‘fire weather’ in southeast Australia (; ).
Recent trends suggest an increase in pyrocumulonimbus (pyroCb) storms, or smoke-infused thunderstorms, since their discovery in 2000 ().
These storms occur when multiple large bushfires close together produce intense updrafts. They can produce lightning, hail, downdraft wind and tornadoes, but not rain (). They are unpredictable and can spread rapidly in many directions.
Their intensity pulls smoke plumes up into the lower stratosphere that can then travel around the globe for months.
Two record-setting pyroCb storms have taken place in Australia in the last four years (including the Black Summer bushfires in 2019–20). These events may increase in magnitude and intensity because of climate change ().
NSW has experienced an increase in the number of severe fire weather days in the recent decades (). Already, the fire season arrives more than three months earlier than it did in the mid-1950s ().
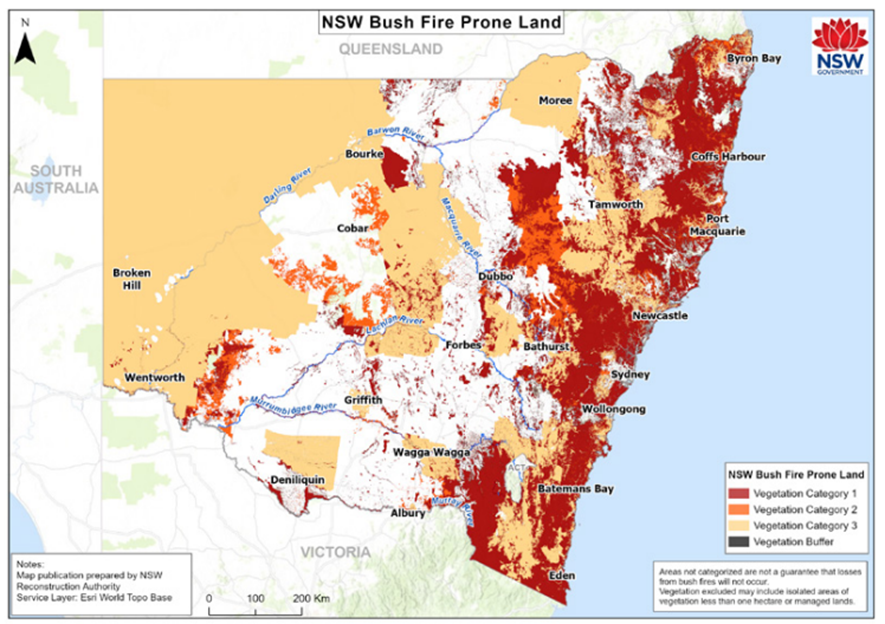
Many communities and large areas of the State are at risk of bushfires (see Map C2.3).
Map C2.3: Bushfire-prone areas across NSW
Notes:
Service Layer: Esri World Topo Base
Vegetation Category 1: Highest hazard. Areas of forest, woodlands, heaths (tall and short), forested wetlands and timber plantations.
Vegetation Category 2: Rainforests. Lower-risk vegetation parcels, including remnant vegetation and land with ongoing land management practices that reduce bushfire risk.
Vegetation Category 3: Grasslands, freshwater wetlands, semi-arid woodlands, alpine complex and arid shrublands.
Drought conditions
Drought conditions are characterised by reduced rainfall or flow of water in streams, creeks and rivers ().
Droughts can be prolonged events, beginning slowly and developing gradually, or flash events, developing in just a few weeks ().
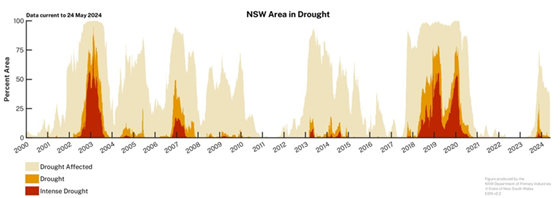
The ‘Millennium Drought’ from 1997 to 2010 was characterised by a sequence of lower-intensity drought events separated by short recovery periods ().
The most recent drought in 2017–20 (sometimes called the ‘Tinder Box’ drought) was shorter but of considerably higher intensity and covered a much larger area ().
Evidence from long term analysis (500–2,000 years) indicates that NSW has experienced more prolonged and severe droughts in the past than observed in modern records (100–150 year) ().
The Combined Drought Indicator uses a combination of factors, including rainfall, soil water (soil moisture content) and plant growth () to assess and monitor drought conditions in NSW (see Figure C2.4).
Figure C2.4: Area of NSW in drought from 2000 to early 2024
Notes:
The data represent the proportion of NSW in each of the three drought categories of the Combined Drought Indicator.
Find out more about the types and impacts of drought in Australia.
Risk of drought
As rising temperatures change rainfall patterns and increase evaporation, water will become scarcer (; ).
There is strong likelihood that NSW will become warmer in the future. Uncertainty remains in relation to NSW rainfall projections.
See the Status and trends section of the topic for more information on rainfall and temperature projections in NSW.
Drought projections in NSW can only be made with low to moderate confidence due to limitations in climate models ().
Global and regional climate models tend to agree that droughts could change with warmer temperatures influencing the rate of drying of the landscape. In NSW, the expectation is that droughts (specifically related to long-term decreases in rainfall) could intensify, last longer and become more frequent in southern NSW (; ; ; ; ).
This does not hold true for all regions of NSW. Under the NSW Department of Primary Industries-assessed high-emissions scenario, drought characteristics are likely to remain unchanged or may improve slightly in the Upper Tablelands and Great Dividing Range regions ().
Further research is needed to enhance projections for drought conditions in NSW.
Pressures and impacts
Greenhouse gas emissions
Greenhouse gas emissions have been rapidly accumulating since the industrial era (1910) owing to human activities, driving global temperature increase and climate change ().
This increase in overall temperature is resulting in variations in Australia’s rainfall patterns, as well as heightened frequency, intensity or duration of extreme weather ().
There is an urgent need to radically reduce emissions to slow down global warming and mitigate the worst impacts of climate change ().
The NSW Net Zero Plan Stage 1: 2020–2030 commits to net zero emissions by 2050.
Projections for climate change impacts are based on future greenhouse gas emissions scenarios (see Table C1.4 in the topic for more information on scenarios used in modelling climate projections).
See the and topics for more information.
Climate change
The surface air temperature over land in NSW has warmed by 1.4°C since national records began in 1910. This warming is not directly comparable to average estimates of global warming that include surface air temperature over both land and ocean. Surface warming occurs faster over land than the ocean.
The effects of climate change are already apparent:
- The past two decades have been the warmest in Australia thus far, having seen the warmest year (2019) as well as eight of the nine warmest years on record since 2013 ().
- The Tasman Sea is warming at twice the global average (), an increase of 0.35°C per decade since 1945 near Sydney.
- Sea level monitoring shows a total increase of 22 centimetres since 1900, half of this in the last 50 years, owing to climate change ().
The effects of climate change will continue to get worse with each increment of global warming (). This will mean that extreme weather events may occur more frequently, be more intense or affect larger areas.
Human health impacts
Extreme weather harms the health and wellbeing of Australians ().
In Australia, heatwaves are one of the deadliest natural hazards, causing 55% of natural-disaster-related deaths ().
They can cause dehydration, heat exhaustion, heat stroke or death when the body’s ability to cool itself is exceeded (). Babies, children, the elderly, pregnant women and people with pre-existing health conditions are at higher risk of heat-related health impacts. Communities in urban areas are also exposed to the urban heat island effect.
Heat-related deaths are predicted to double on average across major Australian cities from 2020 to 2050 ().
See the topic for more information about heat-related health impacts.
Poor air quality from extreme weather, such as smoke from bushfires or dust during droughts, exacerbates respiratory and cardiovascular symptoms. This means that people with existing conditions, including asthma and diabetes, are more at risk from the fine particulate matter released ().
As with heat, smoke from bushfires particularly affects the most vulnerable groups across the community (). This will have a flow-on affect for health services, with potential increases in visits to emergency departments, hospitalisations and death (; ).
See the topic for more information on health impacts.
Exposure to extreme weather can cause communities to experience psychological distress (). Mental health impacts can range from increased domestic abuse and alcohol and substance abuse to anxiety, depression and post-traumatic stress disorder ().
Communities experiencing decreased productivity and incomes owing to extreme weather are also at increased risk of depression and suicide ().
These issues affect more than the direct health of our population; the flow-on effects also disrupt productivity (). For example, the need for sick leave may increase, working conditions might worsen, particularly for those who work outdoors, or communities could be displaced owing to extreme weather events.
See Image C1.1 in the topic for more information on climate-related risks to health and wellbeing.
Environmental impacts
Changes in natural patterns of extreme weather could significantly affect the environment ().
Australian plant and animal populations can tolerate extreme weather and usually recover in time. But as extreme weather events occur with greater frequency, severity or duration, plant and animal populations will experience more damage to recover from and less time to do so ().
Repeated extreme weather events will lead to a degraded natural environment with less resilience to future events. This may result in permanent changes in ecosystem processes and potentially the collapse of some ecosystems.
Cumulative impacts may come from repetition of the same types of extreme events, such as repeated drought conditions, or a combination of extreme weather types, such as bushfires followed by flooding ().
More research into ‘repetition’ events is required for greater understanding of their impacts. It is possible that if too much damage is done to an ecosystem, such as an unprecedented amount of forest is burnt, it may not be able to recover sufficiently before the next event.
Extreme weather also causes damage to cultural sites and landscapes. Coastal archaeological sites, such as shell middens and burial grounds, are being damaged by erosion. Catastrophic bushfires, such as the Black Summer bushfires in 2019–20, have caused extensive damage to cultural landscapes, including cultural sites and important plants and animals.
Impacts on the economy
Impacts on livelihoods, food security, water supply, and economic growth due to extreme events are projected to increase as climate change continues ().
Modelling by NSW Treasury’s estimates $15.8–17.2 billion (in 2021 dollars) in total economic costs from disasters triggered by extreme weather events on average every year by 2060–61, that is more than threefold increase from $5.1 billion in 2020–21 (). This includes direct economic costs, fiscal costs (as measured through Government Disaster Recovery Arrangements) and total costs from storms, floods, bushfires and heatwaves (.
The report also estimates that between 700,000 and 2.7 million days of work could be lost to heatwaves alone.
The Black Summer bushfires in 2019–20 caused economic damage of about $6.5 billion () and loss of about 7,300 jobs () from tourism shutdown. The degree to which climate change influenced these fires remains to be established.
Agriculture and food production
Extreme weather is projected to compromise agriculture and food production (). By 2050, the agricultural output of the irrigated areas of the Murray–Darling Basin could halve compared to levels reported in 2018 (). The Basin covers much of NSW and currently accounts for 50% of Australia’s irrigated agricultural output by value (about $7.2 million per year) ().
Drought conditions, including ‘hot days’ and heatwaves, particularly affect the incomes of people in regional and rural NSW communities.
The NSW economy experienced an estimated $20 billion loss in Gross Domestic Product (GDP) during the 2017-20 drought ( ). It is estimated that by 2061, this could lead to annual average production losses of up to $1.5 billion across Australia ().
Loss of income and livelihood flows on to affect the income of local businesses and communities through higher food prices and scarcity and poor mental health.
Property costs, infrastructure damage and insurance
Extreme weather can pose challenges for property and infrastructure that were not designed and built with extreme weather in mind.
People working and living in such buildings will require additional heating or cooling during periods of extreme heat or extreme cold snaps. Increased heating and cooling also increases the strain on the energy grid and greenhouse gas emissions from electricity generation.
Additionally, extreme weather could lead to pollution that can cause harm to the environment and public health and will entail clean-up and liability costs.
See the Energy consumption and Greenhouse gas emissions topics for more information.
Hailstorms have historically been the costliest extreme weather in NSW, costing $23.2 billion in normalised losses from 1967 to 2022 ().
Floods are also among the costliest events resulting from extreme weather as they can cause extensive damage to infrastructure ().
Heatwaves can lead to infrastructure damage through overheating electricity substations and through increased maintenance costs for improved resilience.
Increased frequency, intensity or duration of events resulting from extreme weather can also affect cost-of-living through increased insurance premiums (). This could affect crop insurance, property insurance, and health and life insurance ().
The economic impact and cost of insurance was noted in the 2022 NSW Flood Inquiry (). The Insurance Council of Australia reported 59,000 claims lodged and $618 million damages incurred because of the 2022 flood event.
Properties at increased risk may not be insurable at all.
Extreme weather can also cause detrimental damage to the environment and ecological systems. The cost of addressing damages can be significant.
Natural disaster relief
The NSW Government allocates funding to respond to natural disasters each year (). It is used to help communities recover from the impacts of natural disasters, including:
- coordinating emergency responses
- recovery programs for regional councils, businesses and community organisations
- disaster relief and recovery grants
- building community resilience
- research programs.
The NSW Government budget for natural disaster recovery continues to increase each year ():
- $725 million in 2020–21.
- $1.9 billion in 2021–22.
- was $2.5 billion in 2022–23.
The NSW Government and the Australian Government jointly committed to an additional $2.6 billion for the 2025–26 budget in response to three major storm and flood events in NSW in 2022.
Responses
Climate change will increase the frequency and intensity of extreme rainfall, ‘hot days’ and severe fire weather that can contribute to disaster. The NSW Government is committed to building the State’s resilience to a changing climate.
A coordinated, multi-level response from government, industry and community must include Aboriginal communities and organisations in decision-making roles and support Aboriginal communities to access and care for Country.
This section focuses on actions to enhance the State's resilience against extreme climate and disasters that can be exacerbated by climate change.
See the Responses section of the topic for other climate adaptation actions.
See the Responses section of the and topics for greenhouse gas emissions-related climate mitigation actions.
See the topic for an update on progress towards the NSW Net Zero Plan.
Policies and strategies on resilience
This section focuses on policies and programs that are helping to enhance NSW’s resilience to climate-related risks and its ability to anticipate, reduce, accommodate or recover from the effects of a hazardous event ().
Overarching policies and strategies
The Climate Change (Net Zero Future) Act 2023 legislates an adaptation objective for NSW to be more resilient to a changing climate.
The NSW Climate Change Adaptation Strategy 2022 sets out the NSW Government’s approach to make NSW more resilient and adapted to climate change. Under the strategy, statewide climate change risk and opportunity assessments and adaptation action plans will be completed at least every five years.
The NSW Climate Change Adaptation Action Plan 2025–29 is a whole-of-government plan that includes 46 actions addressing known climate change impacts and risks and help to achieve the ‘adaptation objective’ under the Climate Change (Net Zero Future) Act 2023. The actions help create the knowledge, skills, resources and processes needed to enable further adaptation on a larger scale.
See the Responses section of the topic for more information about these policies and plans.
State Disaster Mitigation Plan
The NSW Reconstruction Authority was established under the NSW Reconstruction Authority Act 2022 to proactively reduce the impact of future disasters across NSW and to help communities recover from them faster.
The authority will complete critical planning and preparation with communities, businesses and all levels of government to reduce the impact natural disasters have on NSW.
The State Disaster Mitigation Plan, developed by the NSW Reconstruction Authority, identifies areas at risk of natural disasters, including hazards that can be heightened by climate change, such as coastal flooding, heatwaves or bushfires. It sets actions to strengthen policies and programs for disaster management ().
Critical Infrastructure Resilience Strategy
The NSW Critical Infrastructure Resilience Strategy (PDF 3.1MB) aims to ensure that critical infrastructure in NSW can withstand and quickly recover from disruptions such as natural disasters. It promotes systems that continue to operate during disasters or that can be restored quickly after disruption.
Enhancing community resilience
The NSW Government is helping local councils and communities build resilience to drought.
The Natural Hazards Package helps communities and councils prepare for, manage and recover from extreme weather. This includes a strategic guide, resource kit and handbook that helps in strategic planning for natural hazard risk management ().
The Increasing Resilience to Climate Change grants program granted about $600,000 to 23 projects that were completed in March 2022. The projects ranged from water-resilient community gardens, information campaigns for household cooling, bushland revegetation, and bushfire and drought education.
Managing risks for flooding and storms
The Flood-Prone Land Policy aims to make the community more flood resilient. It recognises that flood-prone land is a valuable resource and focuses on reducing the impacts for owners and occupiers of flood-prone property and reducing public and private losses.
The Flood Risk Management Manual guides councils on how to manage flood risk in their communities through. This includes helping councils develop and implement flood risk management plans. The manual also outlines technical assistance provided to councils by the NSW Government.
The Floodplain Management Program provides financial support to local councils and eligible public land managers to help them manage flood risk in their communities.
The program funded 35 projects totalling $6,818,477 in 2023–24 to assess risks and reduce impacts of flooding in NSW.
Managing risks for heatwaves
Managing extreme heat in homes and communities
The NSW Government has provided advice on passive cooling, which involves designing homes and using materials that can lower temperature in hot weather. This can make homes more resilient to heatwaves.
NSW Health’s Beat the Heat initiative provides guidance for communities to protect themselves on very hot days. It includes information on keeping cool and the signs of heat-related illness.
Reducing the heat island effect
Designing cities to absorb less heat can reduce the heat island effect.
NSW Government policies and strategies, including the Sydney Green Grid, 5 Million Trees Program and Greener Places Framework, are supporting the establishment of a network of green cover and open spaces. The Greater Sydney Region Plan has a target of 40% canopy cover in Greater Sydney by 2056.
While supporting the cooling of cities by providing shade, trees also increase the risk of bushfires. Adaptation strategies can be diversified to avoid increasing risk to communities.
Planning and building standards can significantly reduce risks of heat events. These include infrastructure considerations such as green roofs or façades and light-coloured building materials.
Some areas of Sydney have already incorporated these, such as Wilton to the south of Sydney: the Wilton Growth Area Development Control Plan 2021 encourages these considerations, as well as prioritising materials with low heat absorption and incorporating shading elements.
Managing risks for bushfire
The NSW Rural Fire Service’s Planning for Bush Fire Protection (2019) document provides standards and requirements for designing and building on bushfire-prone land in NSW.
It supports planners, developers and fire authorities in integrating bushfire risk management into land use planning. It also mandates appropriate bushfire protection measures for new developments.
The draft Bush Fire Prone Land Package further develops the consideration of bushfire risk in land use planning. It also aims to address climate change, lower recovery and rebuilding costs and support communities to be more resilient to bushfires.
Managing risks for drought
The NSW Department of Primary Industries and Regional Development uses the Combined Drought Indicator and the Enhanced Drought Information System to track drought in NSW.
Real-time data are available through the Interactive drought map.
The NSW DroughtHub contains information and resources for primary producers to prepare for and manage drought. The Drought Ready and Resilient Fund provides access to low-interest loans for primary producers to build resilience.
Future opportunities
Advancements in modelling have enhanced our understanding of future climate. There are opportunities to better understand and apply climate projections.
Opportunities include:
- improving the modelling and observation frameworks to represent and detect changes in rainfall dynamics, leading to improved confidence in forward estimates of extreme climate and weather events
- understanding the likelihood of rare, extreme temperature and rainfall that have the potential to break the resilience of environments, communities and infrastructure
- explaining the compounding effects of changing temperature and rainfall and their impacts on the risks of flooding, heatwaves and drought
- understanding the flow-on effects of extreme weather on ecosystems, communities and industries.
Councils and local communities will be better equipped for extreme climate and weather through:
- designing energy efficient buildings that can reduce the impact of high temperatures
- increasing capacity for councils and local communities to assess, control and monitor their own climate-related risks
- investing in appropriate adaptation measures now to reduce community vulnerability and build resilience for future extremes.