 Image source and description
Topic image:Wiradjuri Country–Millthorpe. Photo credit: Brian Rosenberg/DPIE (2017)Banner image:Topic image sits above Butjin Wanggal Dilly Bag Dance by Worimi artist Gerard Black. It uses symbolism to display an interconnected web and represents the interconnectedness between people and the environment.
Image source and description
Topic image:Wiradjuri Country–Millthorpe. Photo credit: Brian Rosenberg/DPIE (2017)Banner image:Topic image sits above Butjin Wanggal Dilly Bag Dance by Worimi artist Gerard Black. It uses symbolism to display an interconnected web and represents the interconnectedness between people and the environment.

Air quality
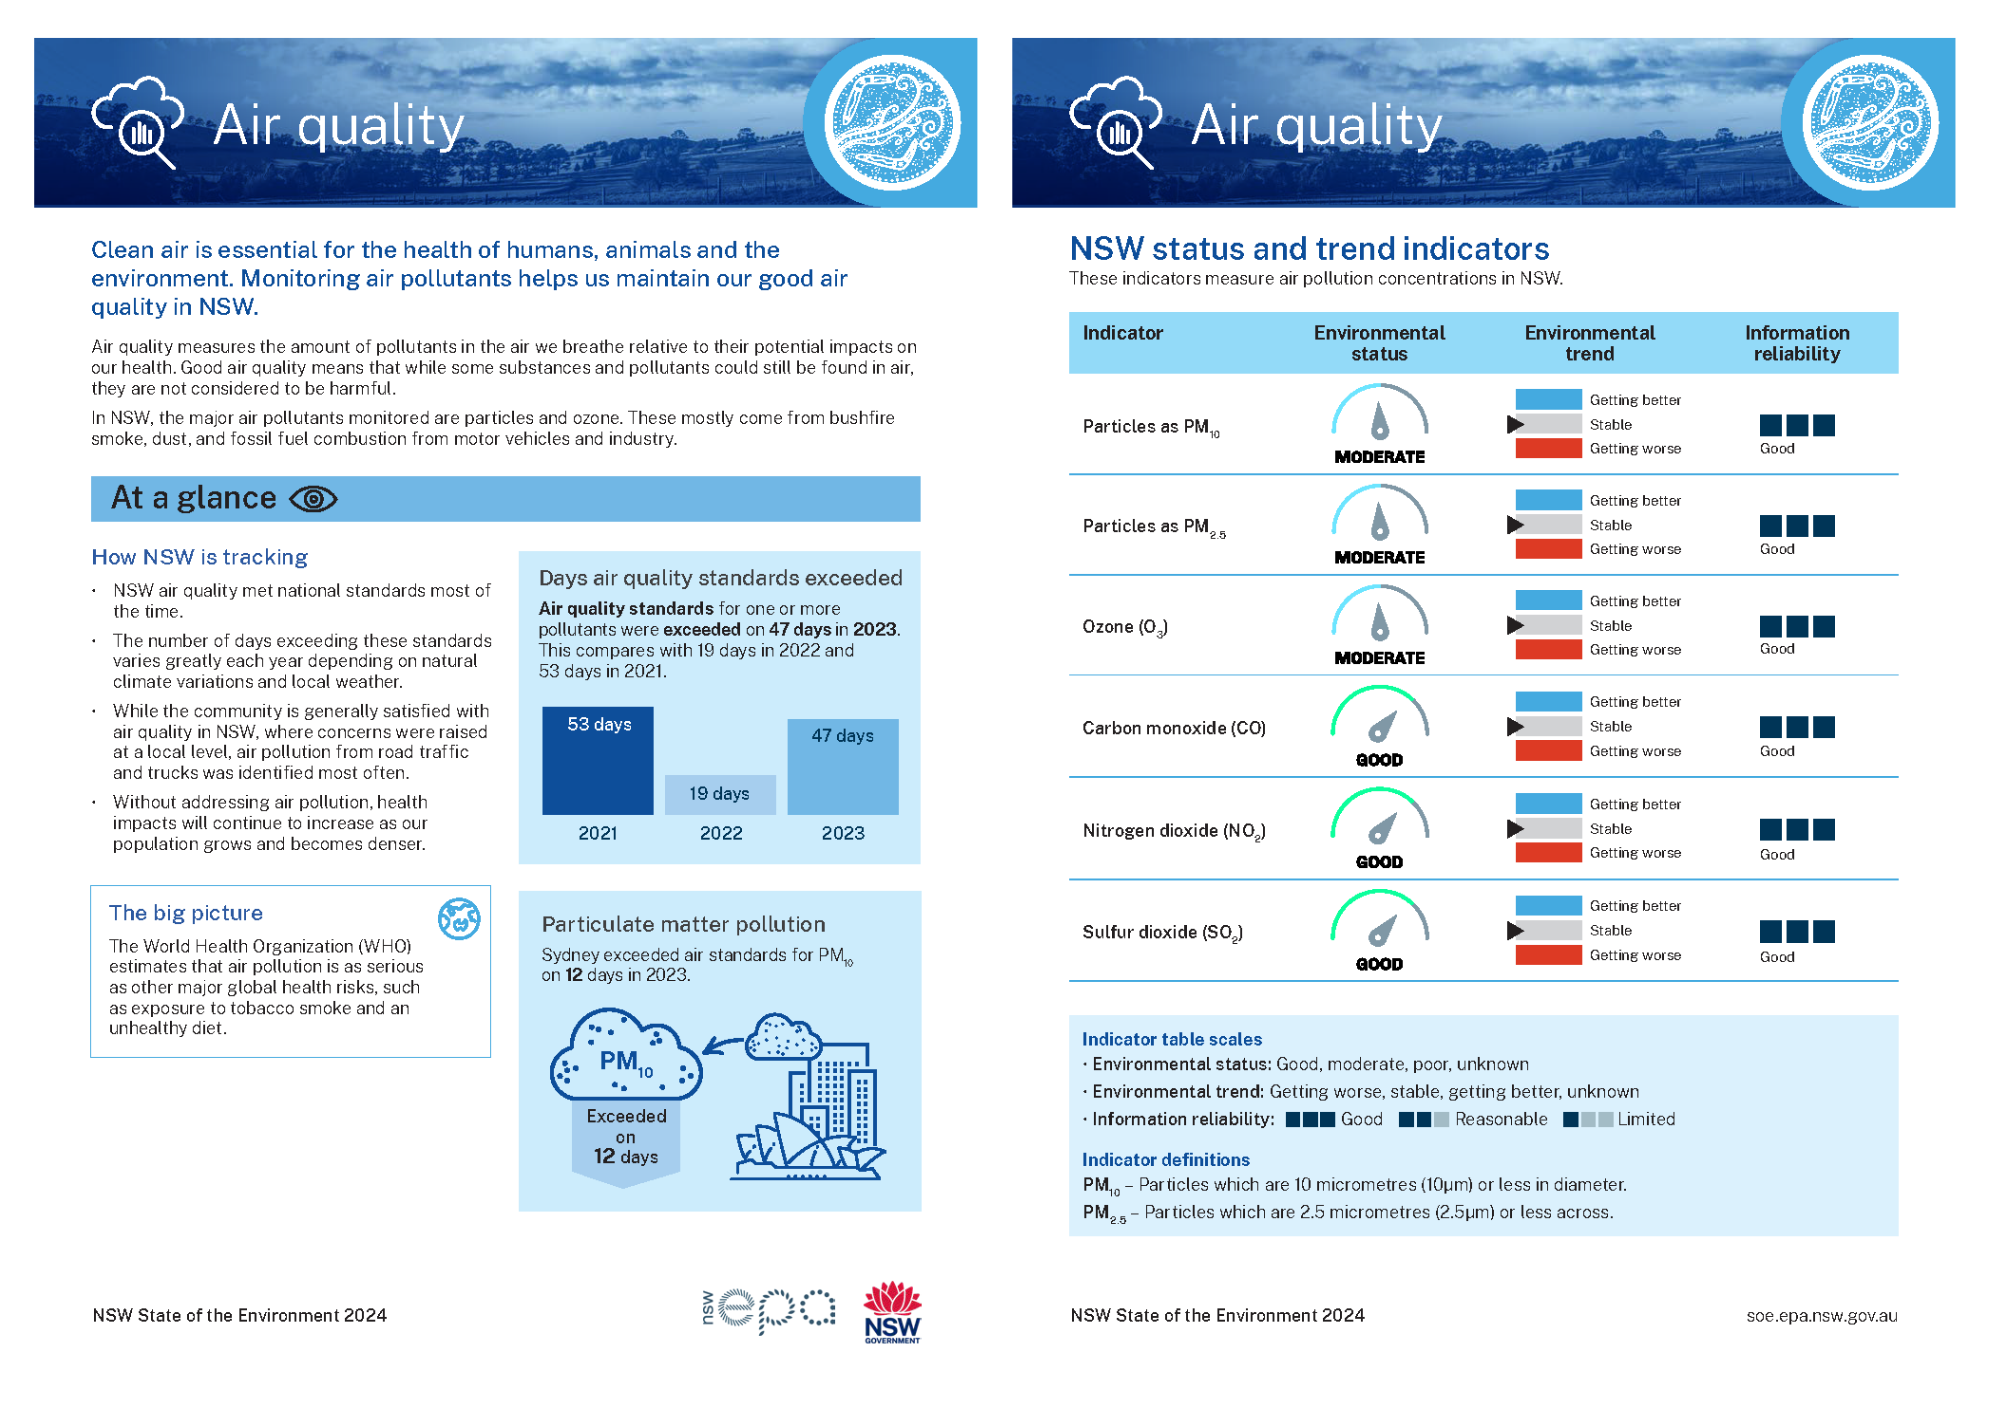
Clean air is essential for the health of humans, animals and the environment. Monitoring air pollutants helps us maintain our good air quality in NSW.
Topic report card
Read a two-page summary of the Air quality topic (PDF 346KB).
Overview
Air quality measures the amount of pollutants in the air we breathe relative to their potential impacts on our health. Good air quality means that while some substances and pollutants could still be found in air, they are not considered to be harmful. Harmful airborne pollutants can come directly from emissions sources or through chemical reactions in the air. They can be found both outdoors and indoors.
Health impacts may occur because of short- or long-term exposure to air pollutants. Children, the elderly, pregnant women and people with pre-existing health conditions are the most vulnerable to these impacts. For many air pollutants, such as particulate matter, some degree of health impact is possible at any level of exposure. As a result, criteria for the level of acceptable impact are applied when assessing air quality.
Consideration of air quality in the development of environmental and urban management programs and initiatives is crucial to improving outcomes for human health and the environment.
Find out more about managing air quality.
Prominent pollutants in NSW
Air pollutants in NSW mostly come from:
- natural sources, such as bushfires, dust storms, sea salt, and volatile natural chemicals released from vegetation
- human-generated sources, including domestic wood heaters, hazard reduction burning, motor vehicles, commercial activities, industries, such as coal mining, energy production, construction, manufacturing and manufactured products.
Particulate matter and ozone are the major pollutants monitored and reported on by the NSW Department of Climate Change, Energy, the Environment and Water (NSW DCCEEW).
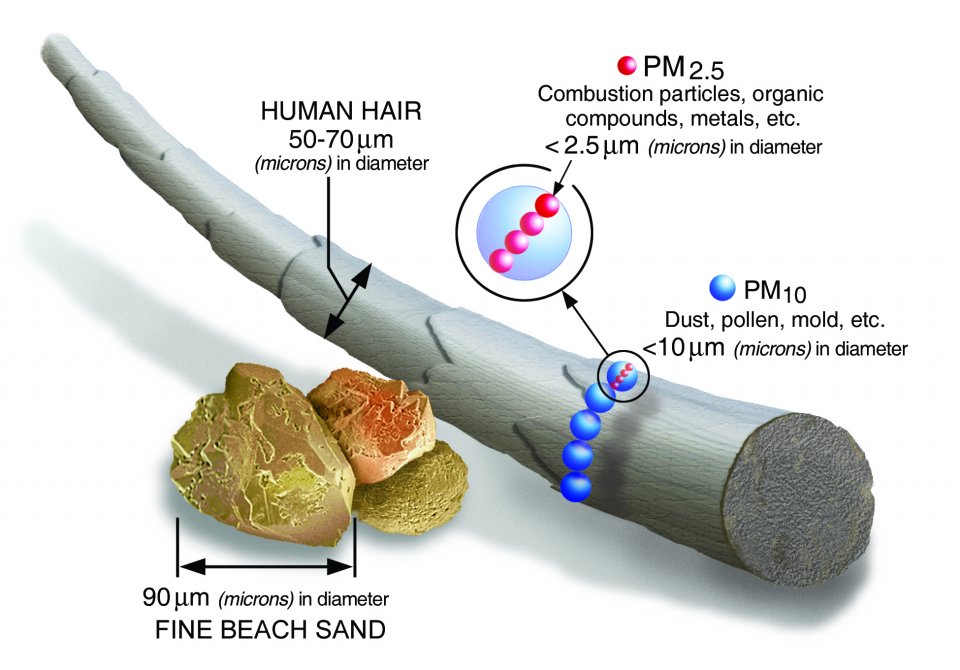
Particulate matter pollutants, or PM, come in various sizes: PM10 are relatively coarse particles up to 10 micrometres (µm) in diameter, while fine PM2.5 particles are less than 2.5µm. See size comparison for particulate matter in Image A1.1 ().
The smaller the particles, the more easily they can be inhaled into the lungs, with some small enough to pass into the bloodstream. Once there, even at relatively low levels, they can trigger heart attacks in people with health conditions and severely affect children and the elderly (). PM2.5 has the greatest impacts on human health. The National Environment Protection (Ambient Air Quality) Measure 1998 (AAQ NEPM) is periodically updated to reflect current health evidence.
Particulate matter pollution varies greatly with weather conditions, changes in the seasons, climate and human activities. These factors affect the concentration and type of particle pollution present in the air.
Unlike particulate matter, ozone is a gas that can be found in both the upper atmosphere (stratosphere) and at ground level (troposphere). Tropospheric ozone is formed when oxides of nitrogen (NOx) and volatile organic compounds (VOCs) react in the presence of sunlight. Fossil fuel combustion is a primary human-generated source of these components, making ozone a particular concern in heavily populated areas. Vegetation is also a natural source of VOCs.
Pollutants monitored in NSW can have several impacts on human health when the community is exposed to high concentrations. These predominantly include a range of respiratory and cardiovascular impacts. To help combat the health impacts of air pollution, the NSW Government reports publicly available data against one of five air quality categories. This is supported by an activity guide that supports the community to protect itself from air pollution.
Monitoring air quality in NSW
NSW DCCEEW monitors the criteria air pollutants identified in the standards set by the AAQ NEPM (see Table A1.1).
The practical objective of monitoring air quality is to protect human health by managing activities to reduce pollutants.
In NSW the main exceedances of the AAQ NEPM standards occur:
- in winter due to PM2.5 from domestic wood heating
- in areas surrounding mining and industry (PM10)
- during bushfires and hazard reduction burning, which generate both PM2.5 and PM10
- during the warmer months, especially summer (ozone formation).
Find out more about these and other air pollutants monitored by the NSW Government on the Air quality website.
Table A1.1: National Environment Protection (Ambient Air Quality) Measure standards
| Pollutant | Averaging period | Standard (maximum concentration) |
|---|---|---|
| Carbon monoxide | 8-hour rolling average | 9.0ppm* |
| Nitrogen dioxide | 1-hour average | 0.080ppm |
| 1-year average | 0.015ppm | |
| Photochemical oxidants (as ozone) | 8-hour rolling average | 0.065ppm |
| Sulfur dioxide | 1-hour average | 0.100ppm |
| 24-hour average | 0.020ppm | |
| Particles as PM10 | 24-hour average | 50.0µg/m3** |
| 1-year average | 25.0µg/m3 | |
| Particles as PM2.5 | 24-hour average | 25.0µg/m3 |
| 1-year average | 8.0µg/m3 | |
| Lead | 1-year average | 0.50µg/m3 |
Notes:
* ppm = parts per million
** µg/m3 = micrograms per cubic metre
This table is a compilation of the AAQ NEPM and accompanying provision.
In 2021, the standards for ozone were revised from 1-hour and 4-hour rolling averages to an 8-hour rolling average and from allowing one exceedance day per year to no exceedances, unless determined as an exceptional event. Information about averaging periods is available on the NSW DCCEEW website.
While air quality in NSW is generally good, ongoing monitoring and temporary responses assist in reducing the impact of air pollution.
NSW DCCEEW operates Australia’s most comprehensive air quality monitoring network, with more than 90 long-term monitoring stations in operation in 2024. These monitoring stations provide the community with accurate, near-real time data on an hourly basis (see NSW DCCEEW website for latest data). This includes:
- 56 standard, long-term monitoring stations that use National Association of Testing Authorities (NATA)-compliant monitoring methods to sample pollutants as per Australian standards
- 39 rural stations that use indicative monitoring methods in rural and remote areas of the state as an early warning for dust storm activity, including some in remote parts of Victoria and South Australia
- several low-cost sensors that enhance monitoring and assess air quality trends in a simplified, more accessible way for the public than standard monitoring instruments.
In 2025, a new long-term station at Ultimo-UTS was commissioned and incorporated into NSW DCCEEW's network. This follows the addition of a new station at Alexandria in 2021. Since 2021, existing stations at Bradfield Highway, Port Macquarie, and Coffs Harbour have also been incorporated into the Department’s network of long-term monitoring stations. Two new air quality monitoring sites are proposed for Narrabeen and Sutherland.
The Chullora station was decommissioned in 2022 and replaced by the Lidcombe station, which has been operational since 2020.
During 2024, permanent nitrogen dioxide monitoring began at Orange. During 2023, permanent ozone monitoring began at the Wagga Wagga North, Tamworth, Albury, Orange and Bathurst stations. Permanent nitrogen dioxide monitoring also began at Wagga Wagga North, Albury and Tamworth during 2023.
See the NSW Annual Air Quality Statement 2024 for more information about the air quality monitoring network and the most recent air quality data.
The NSW Environment Protection Authority (EPA) also requires premises licensed under the Protection of the Environment Operations Act 1997 to monitor and report on air pollution emissions. These include emissions to air according to each facility’s environment protection licence.
See the licensing and industrial emissions pages on the EPA website for more information.
Special air quality monitoring projects are also established in response to major areas of concern. For example, temporary research monitoring stations are operating at the Cadia gold mine and Warringah freeway upgrade in response to community concerns over air quality.
Find out how the EPA looks after air quality in NSW.
Air quality is regulated at both the federal (Australian Department of Climate Change, Energy, the Environment and Water (DCCEEW)) and state level (NSW EPA). Table A1.2 lists the main current instruments related to air quality in NSW.
Table A1.2: Current legislation and policies relevant to air quality in NSW
| Legislation or policy | Description |
|---|---|
| Protection of the Environment Operations Act 1997 | Sets the statutory framework for managing air quality in NSW. It contains provisions for the operation of industrial plant to prevent air pollution that exceeds regulatory standards; the prohibition of burning to reduce smoke pollution during certain weather conditions; and the management of smoke from domestic premises. |
| Protection of the Environment Operations (Clean Air) Regulation 2022 | Aims to reduce emissions of harmful air pollutants through requirements such as standards for domestic wood heaters; provisions for controls on open burning of vegetation and domestic waste; obligations to prevent or minimise emissions; anti-pollution devices for certain motor vehicles; standards on the supply of petrol; requirements for petrol vapour recovery at service stations in the greater metropolitan area; standards for industry air impurity emissions; and controls on the storage and transport of volatile organic liquids. |
| Protection of the Environment Operations (General) Regulation 2022 | Establishes the licensing fee scheme for major industrial premises and provides economic incentives for licensed businesses and industry to reduce pollution, including emissions to air. It also established the Upper Hunter and Newcastle Local air quality monitoring networks and gives effect to the requirements of the National Pollutant Inventory in NSW (see below). |
| NSW Clean Air Strategy 2021–2030 () | Sets out a whole-of-government approach to achieve ongoing reductions in the adverse effects of air pollution, including five areas to mitigate community exposure to poor air quality: better preparedness for pollution events; cleaner industry; cleaner transport, engines, and fuels; healthier households; and better places. |
| National Clean Air Agreement | Sets a framework for national collaboration on air quality issues to deliver health, environmental and economic outcomes, allowing the Commonwealth, the states and territories to coordinate cooperative actions at national, state and local levels. |
| National Environment Protection (Air Toxics) Measure 2004 | Specifies national-level standards for ambient air toxics and associated monitoring and reporting procedures to protect human health and wellbeing. |
| National Environment Protection (Ambient Air Quality) Measure 1998 (AAQ NEPM) | Specifies standards for ambient air quality and associated monitoring and reporting procedures for listed air pollutants to minimise the risk of adverse health impacts from exposure to air pollution. The NEPM’s environment protection goals aim to meet standards for carbon monoxide, nitrogen dioxide, photochemical oxidants (as ozone), lead, particles (as PM10 and PM2.5) and sulfur dioxide. The NEPM was updated in 2021 with a further review scheduled to commence in 2025. |
| National Environment Protection (National Pollutant Inventory) Measure 1998 | Requires reporting of emissions from industrial facilities. The national environmental protection goals for this measure include maintenance and improvement in ambient air quality and marine, estuarine and freshwater quality, as well as minimising environmental impacts associated with hazardous wastes and improving the sustainable use of resources. |
Notes:
See the Responses section for more information about how is managed in NSW.
Indoor air quality
Data gaps for indoor air quality exist due to limited monitoring at the state and national level. This is of particular concern as Australians spend on average 90% of their time indoors (). The health impacts from poor indoor air quality are estimated to cost Australia up to $12 billion per year ().
See the Future opportunities section of this topic for more information.
Indoor air pollution often has other sources and exceeds levels of outdoor air pollution (). They may also present in homes and buildings as by-products from domestic wood heaters, gas stoves and cooking and chemical cleaning products, as well as particulates shed by homewares and other products and in secondary tobacco smoke, dust and mould.
Find out more about the harmful impacts of wood smoke pollution on the EPA website.
Related topics: | | | | |
Status and trends
Air quality indicators
The NSW DCCEEW monitors six of the seven criteria pollutants under the AAQ NEPM as indicators of the state of air quality in NSW. Ambient monitoring of lead (the last of the criteria pollutants) ceased in NSW in 2004 following the introduction of unleaded motor fuel.
- Particles as PM10 are stable, with 18 days exceeding the national standards in 2024 (see Particles as PM10).
- Particles as PM2.5 are stable, with 20 days exceeding the national standards in 2024 (see Particles as PM2.5).
- Ozone is stable, with 3 days exceeding the national standards in 2024 (see Ozone).
As concentrations of carbon monoxide (CO), nitrogen dioxide (NO2) and sulfur dioxide (SO2) are generally well below the AAQ NEPM standards, detailed graphs of their long-term trends are not included in this report.
Air quality continues to be stable in NSW (see Table A1.3). The number of days exceeding national standards has been lower over the past three years due to wetter than average weather. Particulate matter and ozone pollution indicators remain at ‘moderate’ due to a return to the trend of increased exceedances in 2023.
Table A1.3: Air quality indicators
| Indicator | Environmental status | Environmental trend | Information reliability |
|---|---|---|---|
| Particles (PM10*) | Stable | Good | |
| Particles (PM2.5**) | Stable | Good | |
| Ozone (O3) | Stable | Good | |
| Carbon monoxide (CO) | Stable | Good | |
| Nitrogen dioxide (NO2) | Stable | Good | |
| Sulfur dioxide (SO2) | Stable | Good |
Notes:
* PM10 refers to particles which are 10 micrometres (10μm) or less in diameter.
** PM2.5 refers to particles which are 2.5 micrometres (2.5μm) or less across.
Indicator table scales:
- Environmental status: Good, moderate, poor, unknown
- Environmental trend: Getting better, stable, getting worse
- Information reliability: Good, reasonable, limited.
See to learn how terms and symbols are defined.
NSW generally experiences good air quality. From 2021 to 2024, air quality in NSW met AAQ NEPM standards between 84% and 100% of the time.
In 2024, most of NSW met national air quality standards 97% of the time with Newcastle local region the exception, achieving the standards 89% of the time. During 2024, exceedances of the AAQ NEPM standard for one or more pollutants occurred on 36 days, compared to 46 in 2023, 19 in 2022 and 53 in 2021.
Particles as PM10 and PM2.5 and ozone (O3) are of most concern as these pollutants exceed their AAQ NEPM standards most often. Since the 2019–20 bushfire season, successive La Niña events and subsequent drought recovery saw a sharp decline in exceedances of these pollutants through to 2024. Air quality exceedances for PM10 and O3 in 2022 were observed at record low levels due in part to well above-average rainfall across NSW.
Air quality in 2022 was overall the best on record. From 2021 onwards, trends in PM10, PM2.5 and O3 have reverted to levels consistent with observations before the 2019–20 bushfire season. During this period, levels of CO, NO2 and SO2 remained stable.
Particulate matter pollutants
Particle concentrations are monitored across the NSW Greater Metropolitan Region (NSW GMR) (Sydney, the Lower and Upper Hunter, Central Coast, Lake Macquarie and the Illawarra) to measure compliance with national standards. This takes in about 75% of the NSW population, including some regional centres. Levels recorded in regional centres are generally representative of the air quality in surrounding regions. Concentrations around NSW vary according to the source of the pollution and season.
Between 2021 and 2024, particle (PM2.5 and PM10) concentrations in NSW exceeded the national air quality standards from 19 days in 2022, to 42 days in 2023. In Sydney, particles exceeded the national standards from zero (2021, 2022) to 12 days in 2023.
Exceedances of the particle standards between 2021 and 2023 were most often caused by the burning of biomass (organic matter), including bushfires, hazard reduction burns and local agricultural burning, wood smoke from domestic heaters and airborne dust.
Particles as PM10
While levels of PM10 particulate matter pollution are generally good, they can become elevated and result in poor air quality during hazard reduction burns, bushfires and dust storms. The greatest number of days with PM10 levels above the 24-hour standard in NSW occurred during the severe drought between 2017 and 2020 and concurrent with bushfires in 2019 and 2020 (see Figure A1.1).
More recently, following fewer exceedances in 2021 and no exceedances in 2022 in the Sydney and Illawarra regions, PM10 exceedances in both regions rose in 2023, but fell in 2024 to only one day.
Figure A1.1: Number of days exceeding AAQ NEPM 24-hour standard for particles (PM10) in NSW, 2013–24
Notes:
To ensure consistency in presenting trends, all exceedances, including those due to exceptional events, are presented.
Particles as PM2.5
PM2.5 particulate matter pollution has a greater potential to cause detrimental health impacts by inhalation than PM10. These small particles also peak during specific events, including bushfires and droughts.
After the Black Summer bushfires, fewer exceedances were observed in 2021. In 2022 only one exceedance was recorded, which is the fewest on record. PM2.5 exceedances increased in 2023, then fell again in 2024 (see Figure A1.2).
Figure A1.2: Number of days exceeding AAQ NEPM 24-hour standard for particles (PM2.5M) in NSW, 2013–24
Notes:
To ensure consistency in presenting trends, all exceedances, including those due to exceptional events, are presented.
Seasonal exceedances in particulate matter pollution also occur in cooler months due to:
- hazard reduction burning
- smoke from domestic wood heaters
- agricultural burning.
Ozone pollution
Exceedances of O3 show geographical differences and trends over many years. In 2021, a revised 8-hour rolling ozone average standard was introduced. All exceedances before that date were retrospectively calculated to indicate how O3 levels in previous years compared with the new standard.
Figure A1.3 shows O3 exceedance days in the NSW GMR, with the highest occurring during drought years (2017–20) and the 2019–20 bushfire season. O3 exceedances increased in 2023 and 2024 following a record low of no exceedances in 2022. Most O3 exceedances occur in Sydney.
Reduced exceedances recorded in the NSW GMR in recent years may reflect fewer warm and sunny days during summer when successive La Niña events prevented the optimal meteorological conditions for O3 formation.
Figure A1.3: Number of days exceeding the new 8-hour AAQ NEPM standard for ozone (O3) in NSW GMR, 2013–24
Notes:
A day is counted only once per region, even if exceedances occur at multiple monitoring sites on that particular day.
Monitoring of O3 was extended to regional locations in Gunnedah (2018), Goulburn (2019) and Merriwa (2020). Five additional regional centres were also monitored for O3 during the 2020–21 summer for comparison against the revised 8-hour ozone standard. Apart from exceedances due to bushfire smoke, there were no other recordings of O3 levels above the previous or revised standards in regional areas.
In 2023, permanent O3 monitoring began in the regional locations of Wagga Wagga North, Tamworth, Albury, Orange and Bathurst.
Community perceptions of air quality
Enviro Pulse () is a quarterly survey asking a sample of NSW residents a range of questions on their environmental behaviours, experiences and motivations.
Enviro Pulse results found that NSW residents feel less concern about air pollution in 2025 than they did in 2021 (see Table A1.4).
Table A1.4: Concern about air pollution in NSW, March 2021 to March 2025
| Data type | Mar 21 | Mar 22 | Mar 23 | Mar 24 | Mar 25 |
|---|---|---|---|---|---|
| Air pollution | 57% | 54% | 48% | 49% | 43% |
| Sample (n) | 1,004 | 1,016 | 1,011 | 996 | 960 |
Notes:
Enviro Pulse survey is ongoing.
Enviro Pulse found most NSW residents (84%) identified local air pollution as a concern for their local area in 2025 (see Table A1.5). Residents considered road traffic, trucks, and bushfire and hazard reduction burns as the most concerning sources of air pollution in their local area.
Table A1.5: Sources of air pollution of concern in local area, March 2023 to March 2025
| Source | Mar 23 | Sep 23 | Mar 24 | Sep 24 | Mar 25 |
|---|---|---|---|---|---|
| Road traffic | 58% | 53% | 52% | 54% | 55% |
| Trucks | 46% | 37% | 44% | 43% | 41% |
| Bushfire smoke or hazard reduction burns | 44% | 55% | 39% | 44% | 37% |
| Industrial sources | 29% | 26% | 28% | 27% | 26% |
| Diesel equipment (for example construction equipment) | 27% | 24% | 25% | 29% | 24% |
| Smoke from wood heaters or fireplaces | 21% | 25% | 21% | 24% | 20% |
| Coal mines | 18% | 16% | 18% | 17% | 16% |
| Rail | 13% | 12% | 15% | 13% | 15% |
| Smoke from fire pits, pizza ovens or other outdoor domestic sources | 12% | 13% | 15% | 15% | 12% |
| Power generation plants | 15% | 13% | 14% | 14% | 13% |
| Total with any air pollution concerns | 84% | 87% | 84% | 85% | 84% |
| Total with no air pollution concerns | 16% | 13% | 16% | 13% | 13% |
| Sample size (n) | 1,011 | 1,013 | 996 | 981 | 960 |
Notes:
Enviro Pulse survey is ongoing.
On days of poor air quality, NSW residents adopt a range of behaviours to protect their health (see Table A1.6). The most common action has been to close all windows and doors. There has been a growth (twice as many) in those purchasing or using air purifiers and in researching what to do. These increases are despite five times as many people not taking any action as the air quality is good.
Table A1.6: Actions taken by people the last time they experienced a day with poor air quality, March 2021 to March 2025
| Source | Mar 21 | Mar 22 | Mar 23 | Mar 24 | Mar 25 |
|---|---|---|---|---|---|
| Closed all windows and doors | 74% | 76% | 75% | 55% | 57% |
| Used my air purifier | 12% | 13% | 17% | 21% | 17% |
| Used personal protective equipment, for example a face mask when going outside | 16% | 18% | 20% | 19% | 14% |
| Bought an air purifier | 8% | 8% | 12% | 14% | 10% |
| Researched what to do | 8% | 7% | 10% | 13% | 11% |
| Went to a public building with better air quality than my home | 7% | 6% | 8% | 10% | 7% |
| Kept or brought my children home from school | 6% | 7% | 9% | 9% | 6% |
| Not applicable, air quality has been good | 3% | 4% | 3% | 15% | 20% |
| Sample (n) | 1,004 | 1,016 | 1,011 | 996 | 960 |
Pressures and impacts
Human health impacts
The World Health Organization (WHO) estimates that air pollution is on a par with other major global health risks, such as exposure to tobacco smoke and an unhealthy diet (). Without addressing air pollution, long-term exposure will increase the risk of chronic respiratory and cardiovascular disease and mortality and permanently affect lung development in children ().
In the NSW GMR, it is estimated that 5,900 years of life are lost each year due to long-term exposure to fine particles (PM2.5), equating to the equivalent of 420 premature deaths ().
The NSW population is projected to reach more than 10.1 million people by 2041 (). Increased population densities will raise the community’s exposure to air pollution, resulting in public health impacts and costs, even where air pollution concentrations remain the same. This is particularly relevant for growth areas in parts of western Sydney and along major road transport corridors due to exposure to traffic emissions.
See the and topics for more information.
Transport emissions
In the Sydney region, motor vehicles are a significant source of O3 precursor emissions (NOx and VOCs) and particulate matter pollutants (PM2.5 and PM10).
Results from the Sydney Air Quality Study Stage 2 () show that human activities account for 48% of PM2.5 exposure across the NSW GMR. Of these emissions, on-road motor vehicle exhausts contribute 13% and on-road vehicles non-exhaust (tyre and break wear) accounts for 4%.
In terms of the impact on mortality and the associated annual health costs from premature death or years of life lost, this equates $614 million from motor vehicle exhaust and $218 million from non-exhaust sources (2021 Australian dollar values) ().
Without a significant decrease in the use of fossil fuels for private and public transport, air quality may decline as the population grows. This could create negative impacts on the environment and poorer human health outcomes for the people of NSW.
See the , , and topics for more information.
Smoke from bushfires and hazard reduction burns
The impact of bushfire smoke on populations over large areas depends on a variety of factors, including the nature of the fire and weather conditions. With severe fire weather projected to increase over coming decades, days of poor or worse air quality due to bushfire smoke are likely to increase.
The number of severe fire weather days varies significantly from year to year. A series of successive La Niña events over the 2021 to 2023 period likely limited the development of severe fire weather, reducing the number of large bushfires and reducing particulate matter pollution from smoke.
The PM2.5 component of smoke provides the greatest health risk to communities. While exposure to smoke is usually short-term over hours or days, concentrations can be extremely high. This contributes to increases in premature deaths and hospital presentations due to the effect of PM2.5 exposure on lung and heart conditions.
PM2.5 particles associated with the 2019–20 bushfire season contributed to 219 excess deaths, 1,050 hospital admissions for respiratory conditions and 577 hospital admissions for cardiovascular conditions in NSW ().
See the topic for more information.
Watch this video about how bushfires affect air quality (3 minutes).
Wood heaters
Smoke from wood heaters is a significant source of exposure to PM2.5 and other pollutants that are detrimental to human health in both metropolitan and regional areas of NSW. Wood heaters are responsible for more human health impacts in NSW than any other single source of human-generated air pollution.
Smoke from wood heaters accounts for 42% of PM2.5 emissions generated each year on average (). This results in an estimated 269 premature deaths and over $2.2 billion in health costs every year, across the NSW GMR ().
Watch some short videos about how you can reduce wood smoke emissions.
Climate change
The relationship between climate change and air pollution is complex and knowledge is limited, especially about how it might affect regional air quality. Climate change is impacting health through extreme weather events, increased air pollution from bushfire smoke and dust and through human sources, such as air conditioning ().
The emergence of acute asthma presentations after thunderstorms is likely to become more frequent and severe due to climate change ().
This is happening already. See the topic for more information.
An understanding of the future projections of meteorological variables (such as temperature, precipitation and cloud cover) and changes in the frequency and severity of bushfires and dust storms, are as important to air quality projections as they are to the projections of greenhouse gas emissions.
See the and topics.
Responses
Prioritising air quality
National Clean Air Agreement Work Plan
The National Clean Air Agreement is an agreement between the Commonwealth, the states and territories that sets a framework for national collaboration on air quality issues and delivery of a program of activities to respond to air quality priorities.
Under the agreement, Australia’s environment ministers determine rolling three-year work plans. The 2021–23 Work Plan was implemented collaboratively by all participant jurisdictions and built on the achievements of the previous work plans. It includes a range of projects across the four strategic approaches set out by the agreement which are:
- better knowledge, education and awareness
- emissions reduction measures to reduce air pollution and population exposure to air pollution
- building and advancing partnerships and cooperation
- improved standards for reporting and monitoring air pollution.
A work plan for 2024–26 is under development.
NSW Clean Air Strategy
The NSW Clean Air Strategy 2021–2030 () presents a cohesive, whole-of-government set of priorities and actions to support liveable communities, healthy environments and the NSW economy by reducing the adverse effects of air pollution on NSW communities. The priority areas are:
- better preparedness for pollution events – improve information and how it is communicated to help reduce health impacts of air pollution on NSW communities, including from bushfires, hazard reduction burns and dust storms
- cleaner industry – drive improved management of air emissions by industry
- cleaner transport, engines and fuels – further reduce air emissions and impacts from vehicles, fuels and non-road diesel sources
- healthier households – support reducing air emissions from household activities, with the main priority being wood heater emissions
- better places – reduce the impacts of air pollution on communities through better planning and design of places and buildings.
The strategy integrates with the Net Zero Plan Stage 1: 2020–2030 () and other key energy, transport and planning strategies. Annual reports on how the NSW Government is tracking in implementing the strategy form part of the NSW annual air quality statements.
NSW Clean Air Regulation remake
The revised Protection of the Environment Operations (Clean Air) Regulation 2022 took effect in December 2022. Key changes include:
- requiring cleaner, lower volatility petrol to be supplied for an extra month over summer to reduce ozone
- stricter emission limits and controls on volatile organic liquids in storage tanks, loading plant and tank vehicles
- requiring older industrial activities and plant, which began operating or were upgraded between 1979 and 1997, to comply with more stringent air emission standards.
Updating standards and air quality criteria
Changes to national standards
Nationally consistent air quality standards are set out under the National Environment Protection (Ambient Air Quality) Measure (AAQ NEPM) which help to guide jurisdictional policy on air pollution. These standards are periodically reviewed by the National Environment Protection Council (NEPC).
In May 2021, the AAQ NEPM was updated by the Commonwealth to introduce more stringent national air quality standards for ozone (O3), nitrogen dioxide (NO2) and sulfur dioxide (SO2). Introduced on the back of recent health evidence and a desire for consistency with other international jurisdictions, the changes included:
- reducing the hourly NO2 standard from 0.120 parts per million (ppm) to 0.080ppm
- replacing the hourly and rolling 4-hour O3 standards with a rolling 8-hour ozone standard of 0.065ppm
- removing the annual standard for SO2 and reducing the hourly standard from 0.200ppm to 0.100ppm and reducing the 24-hour standard from 0.080ppm to 0.020ppm
- removing allowable maximum exceedances
- extending the application of the exceptional event rule to the new 8-hour rolling O3 standard.
The hourly standard for SO2 will be further reduced to 0.075ppm from 2025. For PM2.5, new goals of 20 micrograms per cubic metre (µg/m3) (24-hour) and 7µg/m3 (annual) are being introduced from 2025. A further review of the standards is scheduled to commence in 2025.
The Environmental Health Standing Committee of the Australian Health Protection Committee (enHealth) produced two new guideline documents:
- Guidance for public health agencies – managing prolonged smoke from landscape fires
- PM2.5 air quality categories and public health advice – provides guidance to public agencies for health advice during fluctuations in air pollution from fine particle matter.
Improving regulations
Actions by the NSW EPA
The EPA is one of the agencies responsible for the regulation of air quality in NSW. It uses a comprehensive and robust framework for managing air quality, including the regulation of air pollution emissions from scheduled industrial premises.
This regulatory framework was set up and is maintained by the Protection of the Environment Operations Act 1997 (POEO Act), the Protection of the Environment Operations (Clean Air) Regulation 2022 and the Protection of the Environment Operations (General) Regulation 2022 (see Table A1.2).
The EPA actively promotes compliance with the relevant legislation to deliver improved environmental outcomes and requires licensed industry operators to work to reduce emissions and improve their environmental performance in the long-term.
Between 2021 and 2024, the EPA implemented and worked to improve the regulations for air quality by:
- continuing to monitor and regulate licensed industrial facilities, including for air emissions, and enforcing regulations where necessary
- reviewing and remaking the POEO (General) Regulation 2022 and POEO (Clean Air) Regulation 2022
- updating the Approved methods for the sampling and analysis of air pollutants () and the Approved methods for the modelling and assessment of air pollutants ().
The EPA’s Public Register is regularly updated to provide information about environment protection licences and other regulatory requirements under the POEO Act.
Programs and resources
Local Government Air Quality Toolkit
The NSW DCCEEW has completed a major update of the Local Government Air Quality Toolkit based on extensive consultation with the NSW EPA and local councils.
The toolkit contains a comprehensive set of guidance materials to assist councils to meet their regulatory responsibilities to effectively manage air quality issues in their local government areas. Upgrading the toolkit was a priority action under the NSW Clean Air Strategy 2021–2030 ().
The revised toolkit contains new guidance material on climate change impacts, land use planning and emissions from crematoriums. It also includes new practical visual guides and a resource pack to assist council officers with air quality-related inspections.
Bust the Dust campaign
Dust from mining activity in the Hunter Valley is a key concern for the local community. The EPA runs Bust the Dust campaigns to regulate air quality at mine sites and implement procedures to reduce dust from their operations.
Between 2020 and 2022, the Upper Hunter experienced above-average rainfall, a result of multi-year La Niña weather events. During this period, the EPA’s Environment Line received few reports of poor air quality. The prevailing wetter conditions at the time are believed to have aided dust suppression and reduced particulate emissions from the land and Upper Hunter coal mines. Consequently, the EPA did not run any compliance campaigns in 2021 or 2022.
In 2023, long-range weather forecasts predicted a return to El Nino conditions of hot dry periods. In light of the seasonal forecast, the EPA resumed the Bust the Dust campaign, examining Upper Hunter coal mine operations and monitoring the effectiveness of their dust control measures.
Between August and December 2023, the campaign used various resources, including drones, to help EPA officers better identify the source of dust plumes and observe their impacts on air quality. Coal mines were generally observed to be implementing appropriate dust management controls.
The results from this latest campaign revealed improved performance by local mines compared with previous years, including increased measures for dust suppression and several instances where operations were suspended in response to dust risks. While dust from mining activity in the Hunter Valley remains a key concern for the community, the EPA will continue its campaigns and routine inspections to ensure the mines are maintaining good air quality in the region.
National Pollutant Inventory
As required by the National Environment Protection (National Pollutant Inventory) Measure (NPI NEPM), the EPA requires about 1,000 industry facilities in NSW to publicly report their emissions of listed pollutants, including emissions to air.
NPI data is searchable by state, destination (such as air) and substance emitted.
Load-based licensing
The EPA administers the Load-Based Licensing (LBL) scheme which aims to encourage cleaner production through a ‘polluter pays’ principle that requires some environment protection licensees to pay part of their licence fees based on the load of pollutants their activities release to the environment.
By linking the fees payable to pollutant loads, LBL aims to provide an ongoing economic incentive for licensees to improve their environmental performance beyond the levels required by regulation or licence conditions alone. For more information see the EPA website.
Petrol vapours and vehicle emissions
The EPA leads the following programs to reduce air quality pollutants from petrol vapour and vehicle emissions:
- The summer low-volatility petrol program manages ozone formation in the NSW GMR from 1 November to 31 March each year. Regulatory requirements limit petrol volatility, which is a contributor to the development of ozone, to a maximum of 64 kilopascals, a measure of vapour pressure indicating how easily the fuel can give off fumes. Petrol importers and blenders are required to test and report to the EPA on batch volatility each month.
- The vapour recovery at service stations program captures displaced vapours from storage tanks when fuel is delivered to a service station as well as when motorists refuel at the bowser.
- The smoky vehicle enforcement program aims to reduce vehicle emissions to air by ensuring owners properly maintain their vehicles. A smoky vehicle is any motor vehicle that emits visible smoke continuously for over 10 seconds.
NSW Electric Vehicle Strategy
Launched in June 2021, the NSW Electric Vehicle Strategy () commits to increasing the uptake of electric vehicles. The NSW Government has set targets of 52% of new vehicles sold to be electric by 2030 and 100% of new passenger fleet vehicle procurement also to be electric by the same date. These targets, as well as other incentives, investments and programs will support the reduction in transport emissions in NSW.
Transport for NSW
In 2023, Transport for NSW released its Net Zero and Climate Change Policy with a range of emissions targets including:
- 100% renewable energy for the rail, light rail and metro train network by 2025
- net zero operational and fleet emissions by 2035
- net zero embodied emissions by 2045
- net zero transport sector emissions by 2050.
The Zero Emissions Buses program commits to transitioning the state’s public transport buses to zero emissions technology. Completion targets are 2035 for Greater Sydney; 2040 in outer metropolitan regions; and 2047 in regional NSW.
The Towards Net Zero Emissions Freight Policy, published in 2023, sets out a road map to support the road and rail freight transport industry to transition to low and zero emission vehicles and technologies.
The 30-minute city
The Greater Sydney Region Plan sets an objective for achieving a ‘30-minute city’, in which most residents are within half an hour of their nearest metropolitan centre, using public and active transport. About 61% of homes across Greater Sydney met this objective in December 2023.
See the Transport topic for more information on programs to reduce motor vehicle emissions.
Programs in NSW schools
In 2023, the NSW Department of Education implemented a two-year Clean Air Schools pilot program in collaboration with the University of NSW. This non-invasive air quality monitoring program aims to improve the overall learning environment for schools. Low-cost air quality sensors to monitor air pollution for two years have been installed at indoor and outdoor locations in 100 schools across NSW.
Design Framework: Sustainability () requires that all new NSW public school buildings valued at over $10 million and at least 1,000 square metres in size are certified as Green Star Buildings. There is a minimum requirement for projects in metropolitan areas to be fossil fuel-free from 2023 for 5 Star ratings and from 2026 for 4 Star ratings in regional areas.
The Sustainable Buildings SEPP () will also require NSW schools to measure and report embodied emissions and verify energy performance of buildings with a view to them being fully electric or able to be converted to fully electric by 2035.
Wood heaters
Particulate matter pollution from indoor wood heaters continues to be the number one human-generated air pollution issue in NSW, despite being a seasonal occurrence. Wood heaters were specifically included in the NSW Clean Air Strategy 2021–2030 (), in addition to already existing regulations, to deliver long-term and widespread wood smoke emission reductions and public health benefits.
The EPA website provides educational materials to raise public awareness about the health impacts of wood smoke and how to properly operate wood heaters. A fact sheet on wood heaters and health is available on the NSW Health website. The EPA also provides a resource kit to help local councils run community education campaigns. The NSW Government is continuing to lead and support research into the health impacts of wood heaters and the effectiveness of different types of interventions.
Monitoring and research
Review of Monitoring Plan
The NSW Air Quality Monitoring Plan 2021–2025 () aligns the NSW monitoring network with the national monitoring framework; proposes an expansion of the network through the use of low-cost sensors to improve monitoring coverage for particulate matter pollution; and focuses on ensuring NSW meets its obligations to the AAQ NEPM.
Future opportunities
Review of AAQ NEPM national standards 2025
In May 2021, the National Environment Protection Council (NEPC) amended the National Environment Protection (Ambient Air Quality) Measure (AAQ NEPM) to tighten national standards for nitrogen dioxide, sulfur dioxide and ozone. NEPC also agreed to further tighten the sulfur dioxide 1-hour standard and update the goal for the PM2.5 24-hour and annual averaging periods from 2025.
The Australian Government is scheduled to commence a further review of the national standards in 2025, creating an opportunity to review the standards against the latest available evidence and World Health Organization Guidelines.
Standards Australia review of wood heater emissions standard
The Protection of the Environment Operations (Clean Air) Regulation 2022 requires all domestic solid-fuel heaters sold in NSW to comply with the current Australian Standards for efficiency (AS 4012) and particulate matter emissions (AS 4013).
The NSW Government is currently supporting a proposal by Standards Australia to review these standards with a proposed stricter emission limit for wood heaters. The review expected in 2024–25 will include a period for public comment.
Non-road diesel engine emissions
Currently there are no national standards or approaches to manage emissions from non-road diesel engines in Australia. However, evaluations of the potential for a national approach to manage non-road diesel engine emissions have commenced under the National Clean Air Agreement.
The Australian and NSW Governments worked on this project across 2022 and 2023. A cost-benefit analysis report was published in early 2023 and, based on the findings, the Commonwealth progressed a Regulatory Impact Analysis process. Public consultation of the draft Impact Analysis occurred in mid-2023 and the Commonwealth is now considering national regulation.
Further information on the project can be found on the National Clean Air Agreement website
Updated fuel and vehicle emission standards
The Australian Government is responsible for setting fuel quality and vehicle emission standards for new on-road vehicles in Australia. The following new fuel quality standards will come into effect from December 2025:
- The level of aromatic hydrocarbons in 95 RON (research octane number) petrol will be reduced to a maximum of 35% to enable the introduction of stricter noxious emissions standards for light vehicles.
- The level of sulfur allowed in all petrol grades (91 RON, 95 RON and 98 RON) and E85 will be reduced to 10 parts per million.
The Commonwealth Government is also implementing more stringent (Euro 6d equivalent) noxious emissions standards for new light vehicles (passenger and commercial vehicles with gross vehicle mass up to 3.5 tonnes). These standards will set stricter limits on the levels of noxious emissions (such as carbon monoxide, hydrocarbons, oxides of nitrogen and particles) produced by new road vehicles supplied to Australia. The new vehicle standards commence from 1 December 2025 for all new model vehicles and from 1 July 2028 for all new vehicles.
Further information on the new vehicle standards is available on the Australian Department of Infrastructure website.
Transport emissions trends
Despite these more stringent emission standards and the NSW Electric Vehicle Strategy (), transport emissions are projected to only fall marginally as 2030 approaches. NSW transport greenhouse gas emissions are projected to reduce decline by 5% in 2030 compared to the baseline 2005 level.
Emission reductions from the uptake of battery electric and plug-in hybrid vehicles are also offset by record sales of new vehicles, a large proportion of which are classified as SUVs or light commercial vehicles, such as utes () that are high fuel consumers. This trend has been encouraged by tax incentives for businesses in recent years, such as the exemption from fringe benefits tax () that apply for vehicles able to carry more than one tonne.
Transport for NSW annual fleet registration data also shows an ongoing increase in the percentage of diesel vehicles in the NSW on-road vehicle fleet:
- 17.3% at 30 June 2014 ()
- 22.68% at 30 June 2023
- 23.18% at 30 June 2024.
This average increase of greater than 0.5% per year is significant, as diesel vehicles contribute disproportionately to the amount of air pollution produced by on-road vehicles ().
The latest data from the Australian Infrastructure and Transport Statistics Yearbook 2023 () shows that the total vehicle kilometres travelled in NSW increased by approximately 9% in 2022–23 compared to 2021–22.
The total vehicle distance travelled also continues to increase for light goods vehicles and heavy vehicle categories, which are predominantly diesel vehicles.
Considerations
Increased greenhouse gas emissions
Moving freight over long distances (long haul) by rail has significantly lower environmental impacts than transporting it by road. This is mainly due to rail’s greater efficiency in hauling larger volumes of goods. Rail freight produces 16 times less greenhouse gas emissions and is four times more fuel efficient compared to road freight ().
Population density
Implementation of a 30-minute city may reduce transport emissions but will require work to develop sound planning approaches which minimise the impact on air quality when increasing population density near sources of pollution.
Indoor air quality data gaps
Further exploration of the use of low-cost sensor technology would help to establish baseline monitoring for indoor air quality. Further investment in innovative technologies would support improved functionality of these sensors.
Further exploration could address growing concerns in ultrafine particulate matter (particles with a diameter of 0.1 micrometres or less) and airborne microplastics (particularly polyester microfibres from clothing).
Utilising AI and machine learning
Exploration of the role that artificial intelligence (AI) and machine learning could play in better managing and monitoring air quality. Machine learning techniques have the potential to support air quality monitoring and projections, as they are currently being incorporated into weather forecasting.