 Image source and description
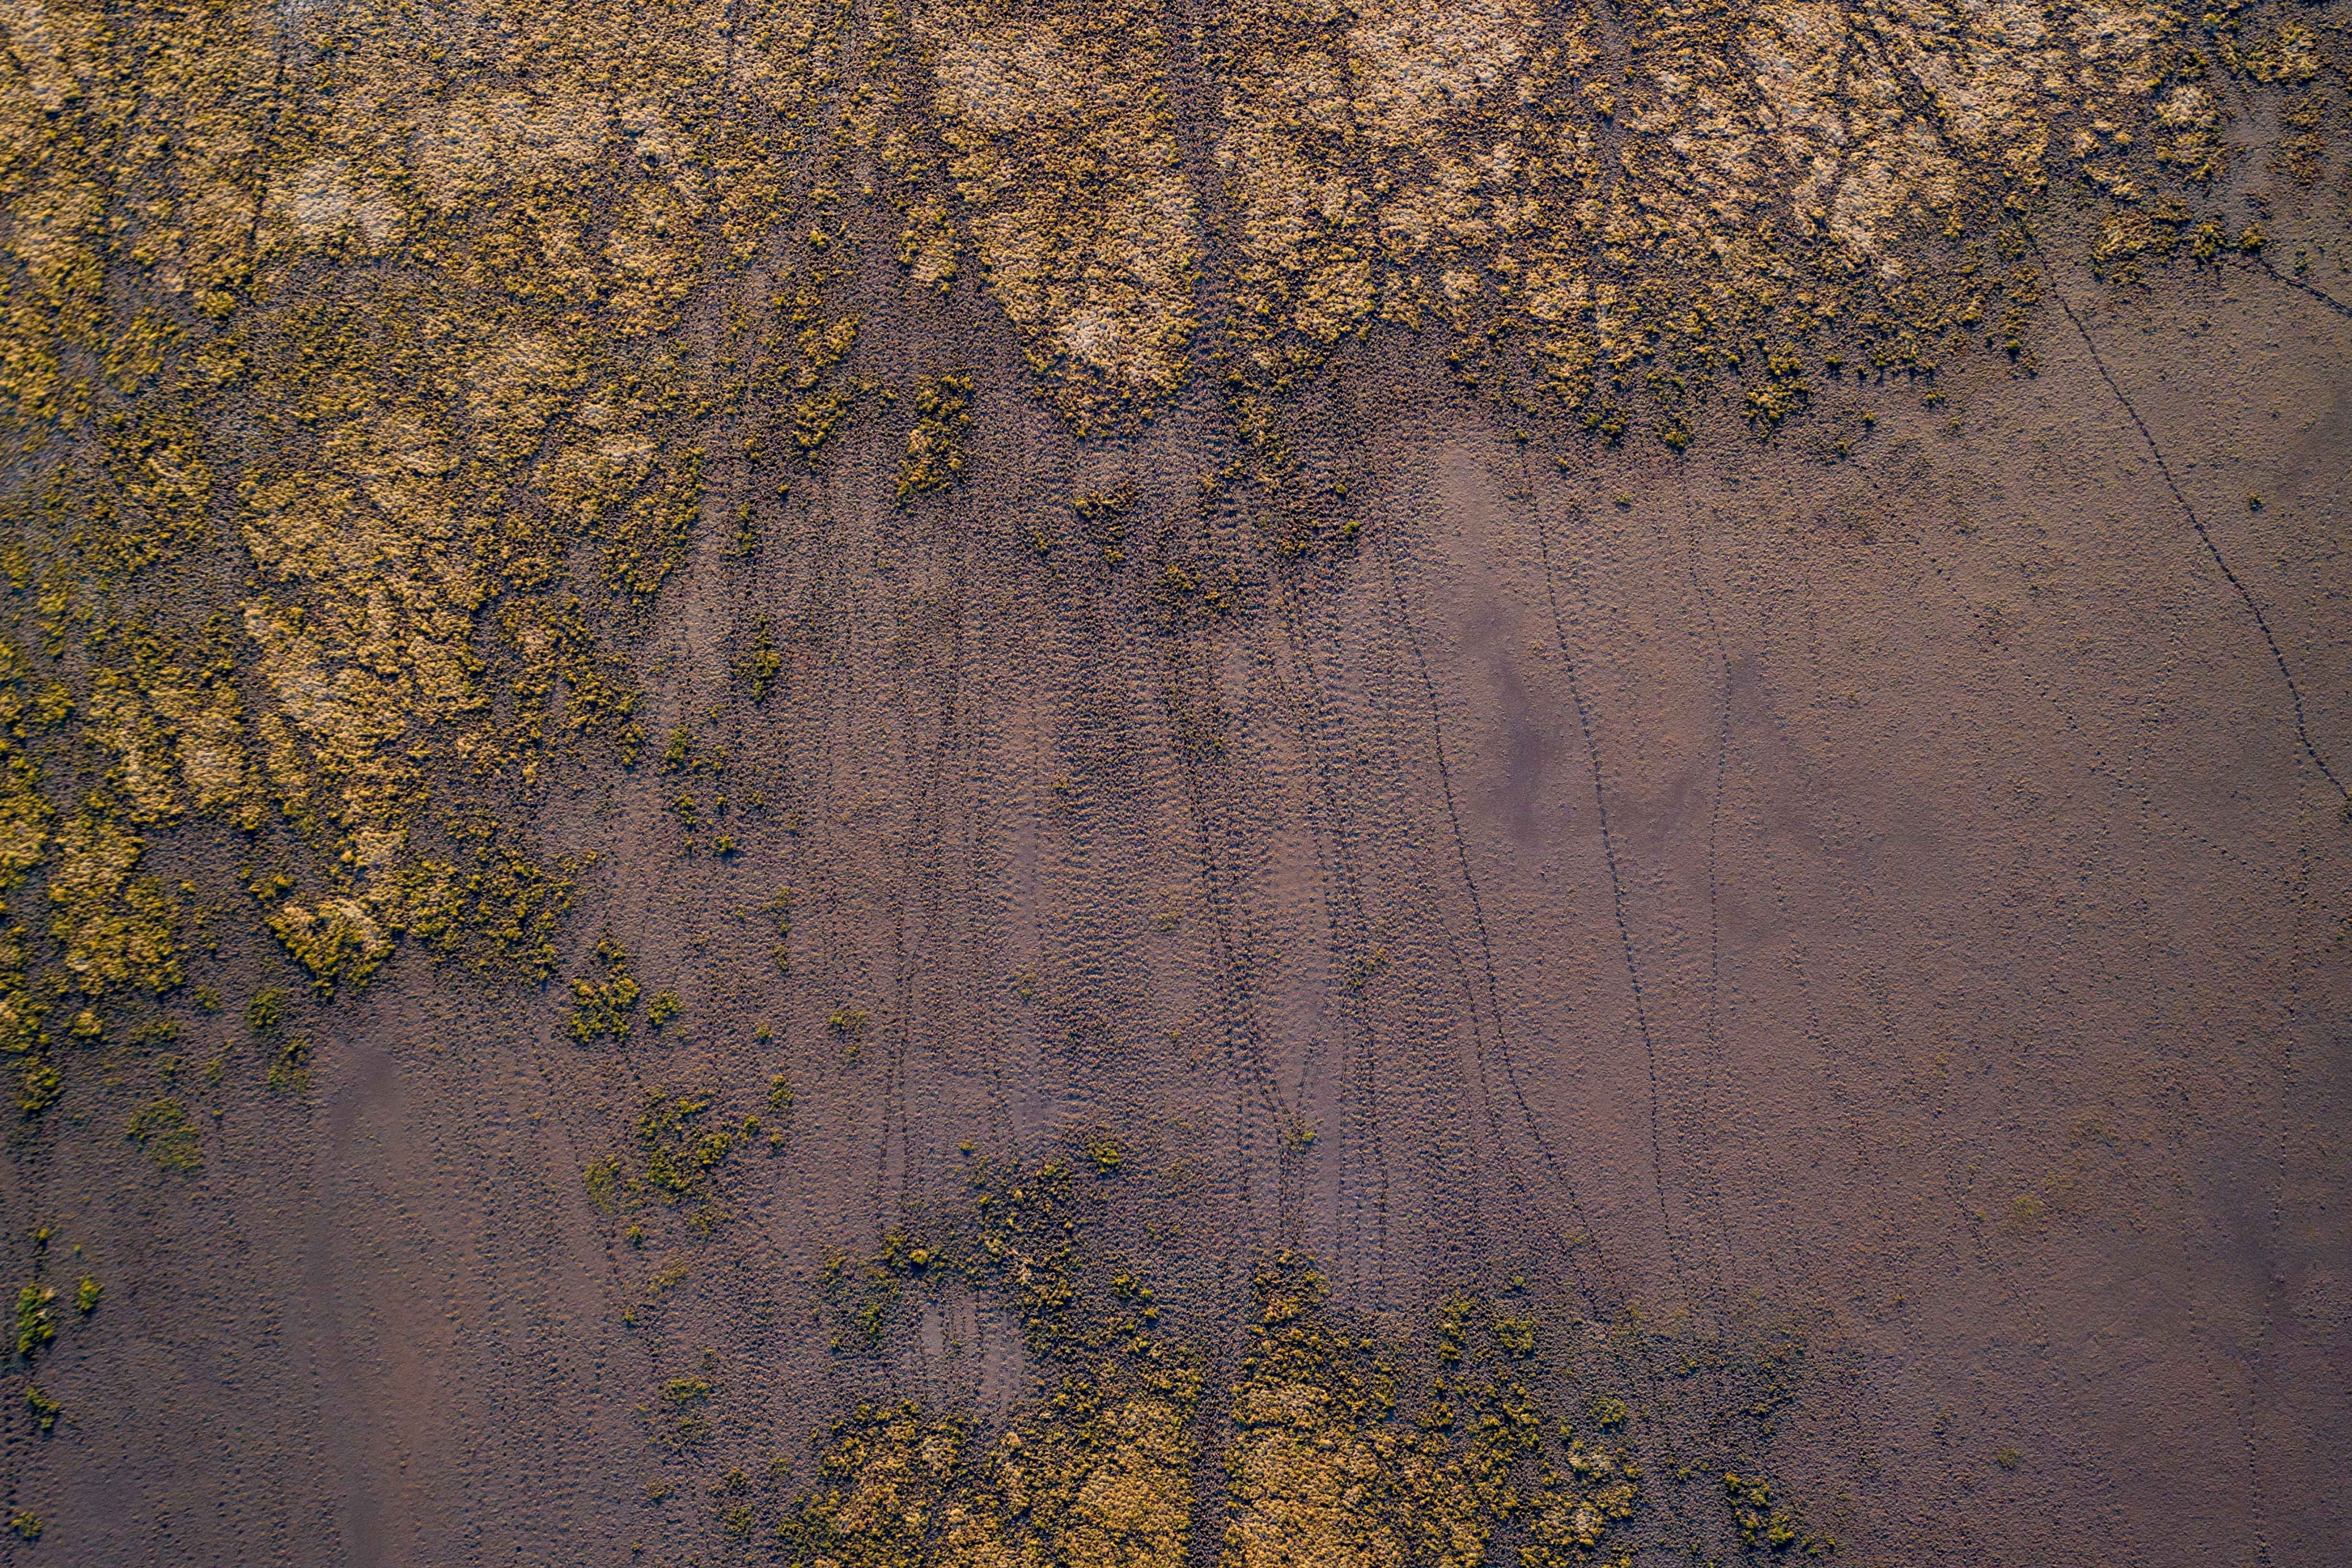
Topic imageBundjalung Country–Clarence floodplain. 'Zippered' Clarence River floodplain showing kangaroo tracks through the mud in a wetland. Photo credit: Stuart Murphy (2020). Special conditions apply.Banner imageTopic image sits above Butjin Wanggal Dilly Bag Dance by Worimi artist Gerard Black. It uses symbolism to display an interconnected web and represents the interconnectedness between people and the environment.
Image source and description
Topic imageBundjalung Country–Clarence floodplain. 'Zippered' Clarence River floodplain showing kangaroo tracks through the mud in a wetland. Photo credit: Stuart Murphy (2020). Special conditions apply.Banner imageTopic image sits above Butjin Wanggal Dilly Bag Dance by Worimi artist Gerard Black. It uses symbolism to display an interconnected web and represents the interconnectedness between people and the environment.
Soil condition
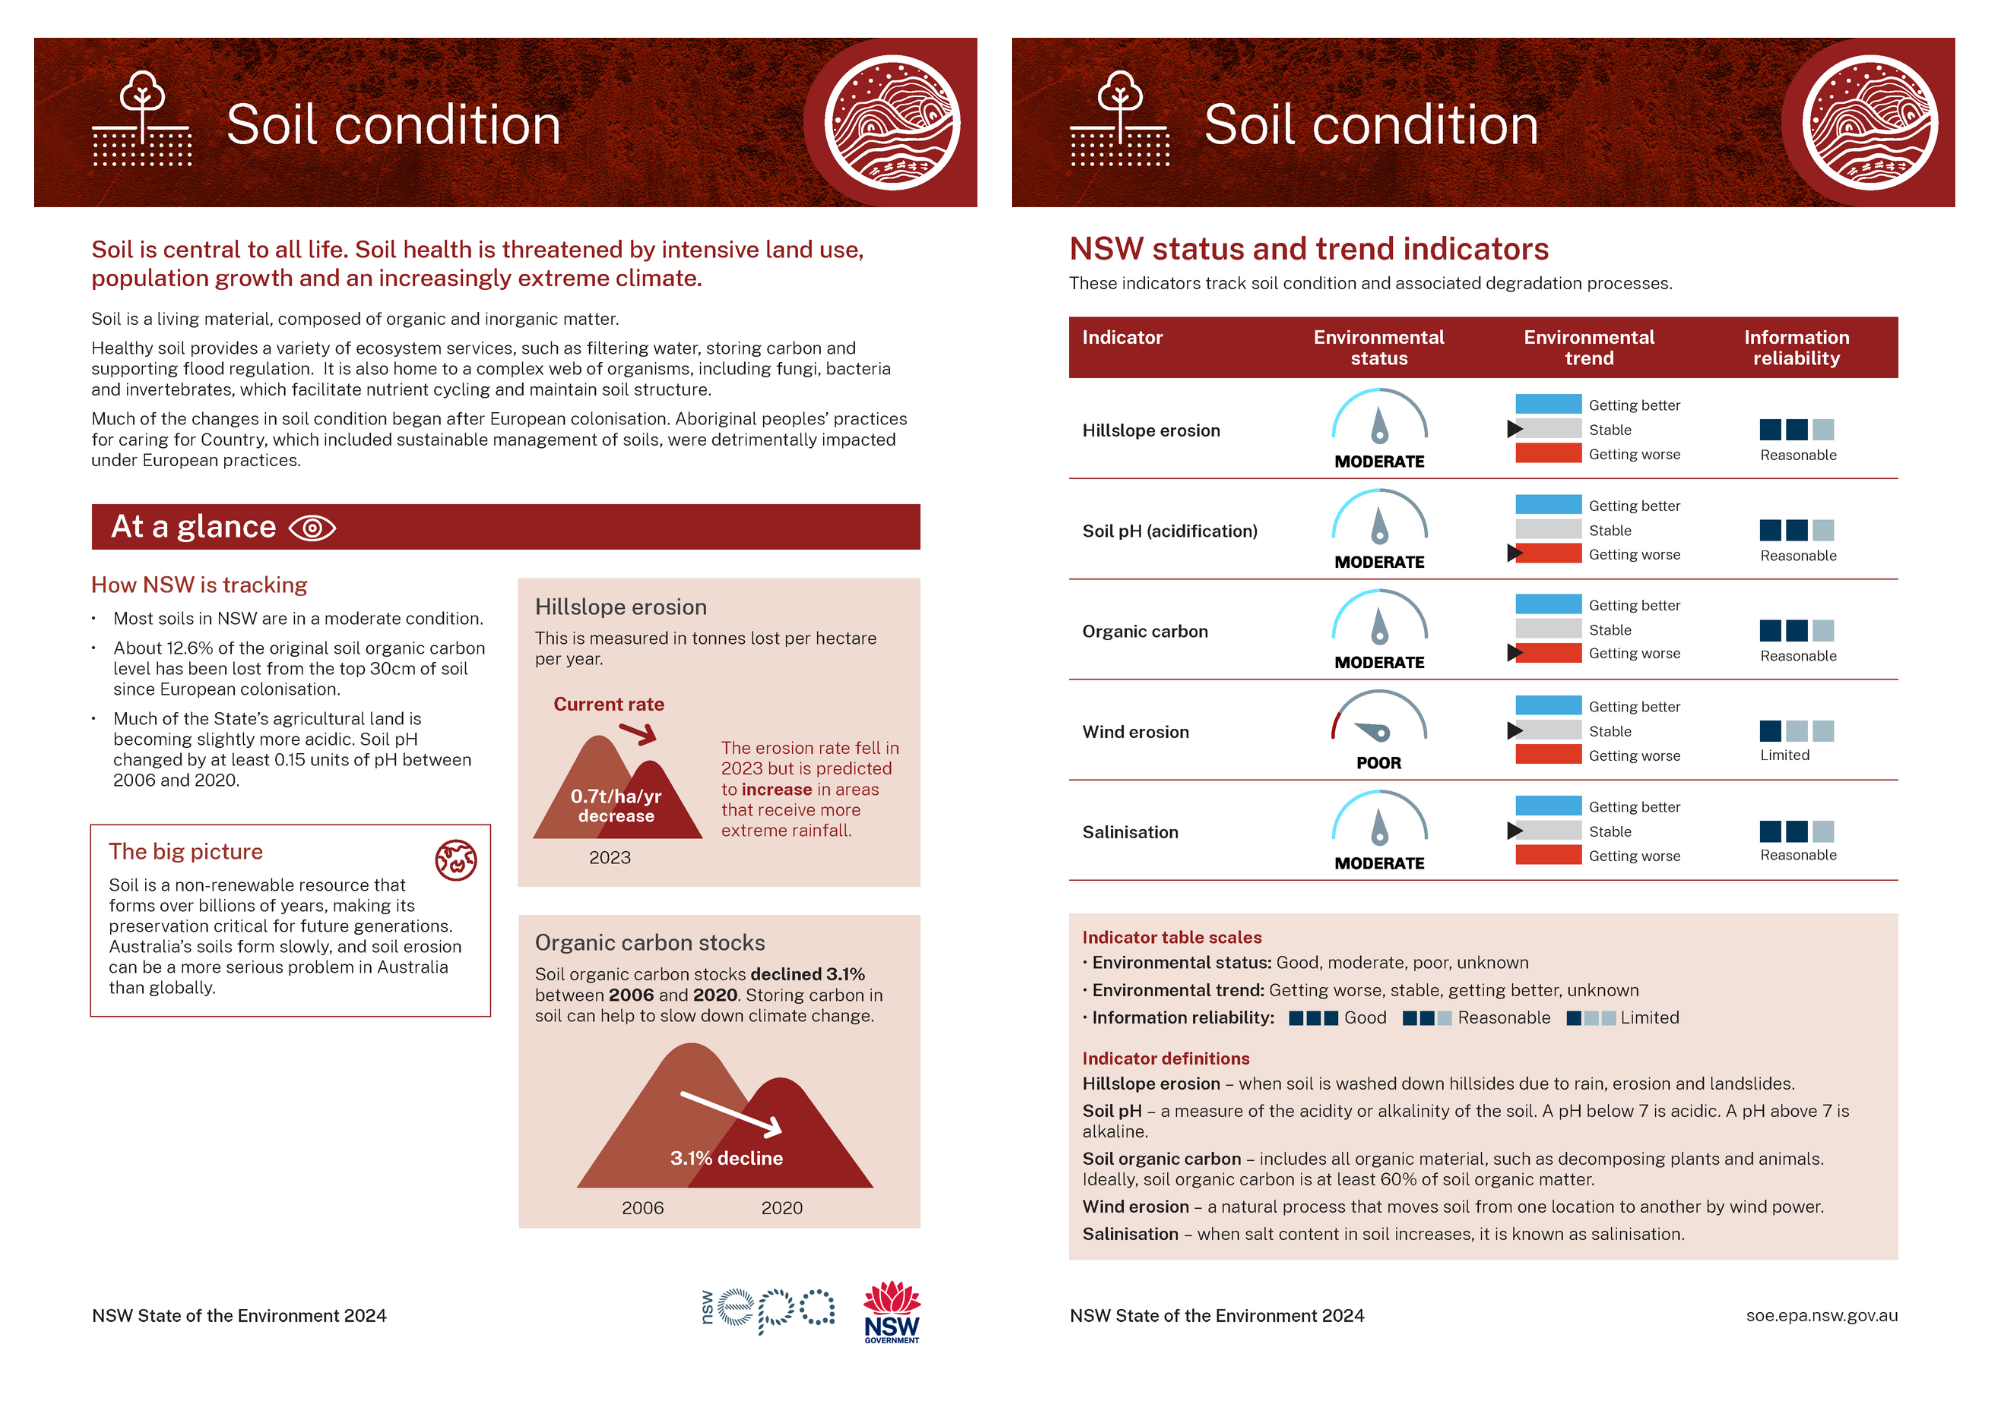
Soil is central to all life. Soil health is threatened by intensive land use, population growth and an increasingly extreme climate.
Topic report card
Read a two-page summary of the Soil condition topic (PDF 1.2MB).
Overview
Beneath our feet, soil quietly sustains the web of life on earth.
It’s a living material, connected to everything that plants, animals and humans need, including eating, drinking and breathing.
Soil is central to the function and health of the environment. This material:
- stores, regulates and supplies water
- stores, regulates and supplies nutrients so plants can grow
- provides habitat for plants, animals and microbes
- delivers other ecosystem services, such as mitigating greenhouse gases and supporting biodiversity ().
Soil is also essential for human health and wellbeing. It provides food, fibre and water, and underpins our economic activity.
Aboriginal peoples sustainably managed soils for millennia and continue to hold knowledge of soils and their role in maintaining healthy ecosystems.
Australia’s soils contribute:
- about $63 billion each year to the economy through agricultural production ()
- about $930 billion per year across all functions and services ().
Ecosystems are communities of plants, animals, invertebrates, and the microorganisms that rely on each other for food, habitat, breeding and survival. Sustainable soil management helps to maintain ecosystem health and prevents them from degrading.
Soil is a non-renewable resource, as it forms over billions of years (; ). Although some soil properties can be managed and restored, when soil degrades, it is generally a permanent change. This is why it is important to preserve soil’s natural qualities.
There are many layers of soil, including topsoil, subsoil and bedrock. The topsoil is usually responsible for the majority of nutrient cycling (including carbon) and microbial activity, but subsoil function is also important.
Living soil
Soil is one of the most biodiverse habitats on earth and it has been estimated that 59% of all terrestrial species inhabit the soil ().
Soil is a dynamic and biologically active layer of the earth's surface with a complex community of microorganisms including fungi, bacteria and archaea, and soil macrofauna including insects and other invertebrates, interacting with organic matter and minerals.
A healthy soil, in good condition, will have millions of microscopic and larger organisms carrying out various environmental functions. These key functions include nutrient cycles, decomposition that leads to soil aggregation, as well as suppression of pests and pathogens and supporting other flora and fauna. Everything works together to supply the water, oxygen, nutrients and soil physical condition that plants need to grow and thrive ().
Recent global scientific interest, including the United Nations Convention on Biodiversity, has highlighted the vital role of microbes, including fungi in soils, in:
- helping to reduce the effects of climate change by storing carbon through plant growth and through regulating the carbon cycle ().
- sustaining agricultural productivity and promoting healthy plant growth and resilience against pests and diseases ().
In NSW and Australia, our understanding of the soil microbiome and its roles and functions in soil health is currently being developed. This encompasses:
- improving our understanding of the composition of the microbiome of different soils and their functions in different areas.
- improving knowledge to inform management and conservation strategies that maintain soil biological and ecosystem health, and productivity in diverse Australian landscapes.
Soil health
Soil condition, also referred to as soil health, assesses how well soil performs all its functions and ways in which those functions are being preserved for future use ().
These functions include healthy natural or managed ecosystems that:
- sustain plants and animals in both the broader environment and in production landscapes
- maintain or enhance water and air quality and promote plant and animal health ().
The health of a soil can be assessed by comparing it with an ideal soil for a given purpose or land use, or with a natural soil with its original vegetation. This comparison informs how a soil’s health can be improved or maintained by changing management practices to:
- increase acidity or alkalinity, depending on what is needed
- increase nutrients
- improve texture, structure and water holding capacity through addition of organic matter.
For the purposes of maintaining natural ecosystems, a soil is healthy if it exists in natural conditions with its original native vegetation. When land is cleared for cropping or grazing, the condition of the soil will change in ways which can be measured and compared with a soil in original condition.
Most soils in NSW are in a moderate condition.
Much of the changes in soil condition began after European colonisation. Aboriginal peoples cared for the land and maintained healthy ecosystems for millennia ().
Development, such as housing, infrastructure, cities and industrial activities, have significantly impacted soil health, including through soil sealing and compaction, pollution, topsoil removal, salinity and disruption of natural processes.
Urbanisation leads to soil sealing, where the soil is covered with concrete and asphalt. This can:
- reduce water infiltration
- disrupt natural drainage
- limit the soil’s ability to store carbon and support plant life.
Construction compacts the soil by:
- degrading its structure
- reducing its capacity to retain water and nutrients
- restricting its activity to grow healthy plants.
Industrial and urban activities may:
- contaminate soils with pollutants, such as metals and other chemicals
- further damage soils
- risk damaging ecosystems and harming human.
Soil degradation
Soil degradation refers to changes that are largely due to human activities, including undesirable changes brought about by development, agriculture or other land uses. Soil degradation can reduce both its quantity and quality, limiting or removing its ability to:
- supply nutrients for healthy plant growth and the invertebrates that live in it
- regulate water
- store carbon.
Land and soil also have spiritual and cultural significance, particularly for Aboriginal peoples, and these values have also been diminished in many areas through land and soil degradation.
As Australia’s soils form slowly, soil erosion can be a more serious problem in Australia than globally ().
Erosion is a natural process, but its impacts are often increased by development, urbanisation and farming. Around the world, the nutrient loss in agricultural land from soil erosion is between:
- 23 and 42 million tonnes of nitrogen
- 15 and 26 million tonnes of phosphorus ().
Some consequences of soil degradation can be irreversible or expensive to rectify, including:
- accelerated erosion
- salinity
- soil acidification due to agriculture and fertiliser use.
Some forms of degradation, such as decline in nutrients and soil acidification in surface and subsoils, can be improved if resolved early when degradation is minor. Although restoration can be expensive (), when done appropriately and at the correct rates it can lead to economically viable functional improvements.
Industrial and urban land activities may lead to soil pollution, where harmful pollutants, such as metals, chemicals and waste, are introduced into the soil.
See the topic for more information.
The NSW Enviro Pulse survey provides quarterly responses from a structured random sample of the NSW population.
For NSW residents, pesticides and soil pollution remain environmental concerns for about a quarter of the population (see Table L1.1).
Table L1.1: Concern about pesticides and soil pollution in NSW (March 2021 to March 2024)
| Concern | Mar 21 | Sep 21 | Mar 22 | Sep 22 | Mar 23 | Sep 23 | Mar 24 |
|---|---|---|---|---|---|---|---|
| Pesticides | 31% | 29% | 29% | 29% | 28% | 25% | 27% |
| Soil pollution | 30% | 26% | 31% | 27% | 24% | 21% | 25% |
| Sample (n) | 1,002 | 1,017 | 1,015 | 998 | 1,008 | 1,011 | 992 |
Notes:
Enviro Pulse survey is ongoing
Soils and climate change
Climate change is caused by emissions of carbon dioxide and other greenhouse gases into the atmosphere by human activities.
Storing carbon in soil can help to slow down climate change. Soil is part of the natural carbon cycle, contributing to the land carbon sink. As plants die or shed leaves, microorganisms break down the organic matter and turn it into more stable forms of carbon that remain in soil.
Levels of soil carbon depend on:
- the balance between decomposition by microorganisms and soil fauna and vegetation harvesting
- the amount of erosion – the higher the rate of erosion, the lower the amount of carbon in the soil ().
Soil organic carbon fluctuates over time, mainly due to rainfall and land management practices. Revegetation and improved land management practices can help to increase soil organic carbon and other soil benefits. However, there are limits to the amount of carbon that soils can store.
See the topic for more information about carbon sinks.
Soil management
NSW is a signatory to the National Soil Strategy which provides a framework for coordinated action on soil by governments, industry and communities.
Soil is regulated and overseen by several government agencies in states and territories, and locally (see Table L1.2).
In NSW:
- Department of Climate Change, Energy, the Environment and Water (DCCEEW) collects, manages and provides information about NSW soils and landscapes, and advises on sustainable soil management
- Department of Primary Industries and Regional Development (DPIRD) advises and supports primary industries on soil management, including the Soil Conservation Service
- Local Land Services (LLS) administers Part 5A of the Local Land Services Act 2013 (land management framework) and provides natural resource management services and advice to landholders.
Table L1.2: Current key legislation and policies relevant to soil management in NSW
| Legislation or policy | Purpose |
|---|---|
| Contaminated Land Management Act 1997 | Regulates the identification, management and remediation of significantly contaminated land in NSW |
| Local Land Services Act 2013 | Governs management of natural resources, biosecurity and agricultural production on private rural land |
| Soil Conservation Act 1938 | Provides rules to support the conservation of soil and farm water, and reduce erosion |
| State Environmental Planning Policy (Biodiversity and Conservation) 2021 | Regulates clearing of native vegetation in towns and cities, and land zoned for environment protection (chapter 2) |
| State Environmental Planning Policy (Resources and Energy) 2021 | Aims to balance the needs of agriculture and mining, petroleum production and extractive industries and to protect strategic agricultural land |
| State Environmental Planning Policy (Rural Lands) 2008 | Aims to promote the proper management, development and protection of rural lands and to reduce land use conflicts that may arise from use of rural lands |
Notes:
See the Responses section for more information about how is managed in NSW.
Related topics: | | | | |
Status and trends
NSW indicators
This section describes changes in soil condition that have happened over the past 10–15 years. Soil condition in NSW is assessed through remote sensing and modelling.
This assessment considers five main indicators of soil condition recorded in NSW (see Table L1.3).
- Hillslope erosion is stable, with the impact of increases in rainfall balanced by the restoration of vegetation cover following the 2019–20 bushfires (see Hillslope erosion).
- Soil pH (acidification) is increasing, with the biggest impacts seen in the Riverina, Murray and Central West regions (see Soil pH (acidification)).
- Organic carbon is decreasing, with projections for continued reduction likely to impact soil quality (see Soil organic carbon).
- Wind erosion is stable, with recent wet weather reducing erosion levels seen in previous reporting periods (see Wind erosion).
- Salinisation is stable, with changes in rainfall patterns and evaporation due to climate change likely to impact this in the future (see Salinisation).
Table L1.3: Soil condition indicator status and trends
| Indicator | Environmental status | Environmental trend | Information reliability |
|---|---|---|---|
| Hillslope erosion | Stable | Reasonable | |
| Soil pH (acidification) | Getting worse | Reasonable | |
| Organic carbon | Getting worse | Reasonable | |
| Wind erosion | Stable | Limited | |
| Salinisation | Stable | Reasonable |
Notes:
Indicator table scales:
- Environmental status: Good, moderate, poor, unknown
- Environmental trend: Getting better, stable, getting worse
- Information reliability: Good, reasonable, limited.
See to learn how terms and symbols are defined.
The condition of soils is assessed through the degradation impacts by land use practices and prevailing climate conditions, such as extreme rainfall (see Table L1.4).
Table L1.4: Indicators of soil condition and associated degradation processes
| Indicator of soil condition | Degradation process |
|---|---|
| Hillslope erosion: when soil is washed down hillsides due to rain, erosion and landslides. | Loss of topsoil: leads to a loss of soil productivity and biodiversity. It is exacerbated by vegetation clearing and lack of groundcover. Subsequent sedimentation and nutrient loss may decrease environmental and water quality (). |
| Soil pH: a measure of how acidic or alkaline the soil is. A pH below 7 is acidic. A pH above 7 is alkaline. | Acidification: most plant growth and yield is reduced below a pH of 5 (). Acidification is increasing in NSW due to nitrate leaching, removal of large amounts of agricultural products such as grain, hay or silage, and use of ammonium nitrogen fertilisers, for example, urea (). |
| Soil organic carbon: includes all organic material, such as decomposing plants and animals. Ideally, soil organic carbon is at least 60% of soil organic matter. | Loss of soil organic carbon: increases vulnerability to erosion and degradation mainly due to land clearing, intensive agricultural land use, drought and climate change |
| Wind erosion: A natural process that moves soil from one location to another by wind power (). | Loss of topsoil: Many areas have been damaged due to wind erosion. Some recover naturally, but others are damaged permanently due to insufficient groundcover, particularly in western areas of NSW and in drought conditions. |
| Salinisation: When salt content in soil increases, it is known as salinisation. There are four types: dryland, irrigation, urban and industrial salinity. | Increased salinity: Land clearing, polluted groundwater or unsound irrigation bring salts to the surface. Increased salinity in soil decreases its quality, resulting in loss of productivity, soil erosion, stunting or death of vegetation and damage to building foundations and infrastructure. |
Notes:
In 2021–23, updated data compared to 2018–20 was only available for hillslope erosion and wind erosion. For other indicators, the modelling is from 2020 and was also presented in the State of the Environment 2021 report.
Hillslope erosion
Hillslope erosion continues to be stable. Rates fluctuated between 2021 and 2023 with both higher and lower rates of hillslope erosion than the baseline period average (between 2001 and 2020).
Historically, hillslope erosion has contributed to extensive soil loss and an associated decline in ecosystem function.
During the current reporting period (2021–23) there is variation in the status of hillslope erosion in NSW.
- The average rate of hillslope erosion for the baseline period (2001–20) was 1.0 tonnes per hectare per year (t/ha/yr).
- Hillslope erosion rates increased significantly after the 2019–20 bushfires and rainstorms that followed.
- Hillslope erosion rates in 2021 and 2022 reduced slightly from a high of 1.8t/ha/yr in 2020 but were still above the baseline rate.
- The erosion rate in 2023 decreased to 0.7t/ha/yr
- Typical rates of soil formation in NSW are between 0.04–0.4t/ha/yr ().
The increase in hillslope erosion was mainly due to the increase of rainfall from 500 millimetres (mm) a year in 2001–20 to 692mm a year in 2021–23. This 38% increase subsequently resulted in a 43% increase of erosion in 2021–23 from the 2001–20.
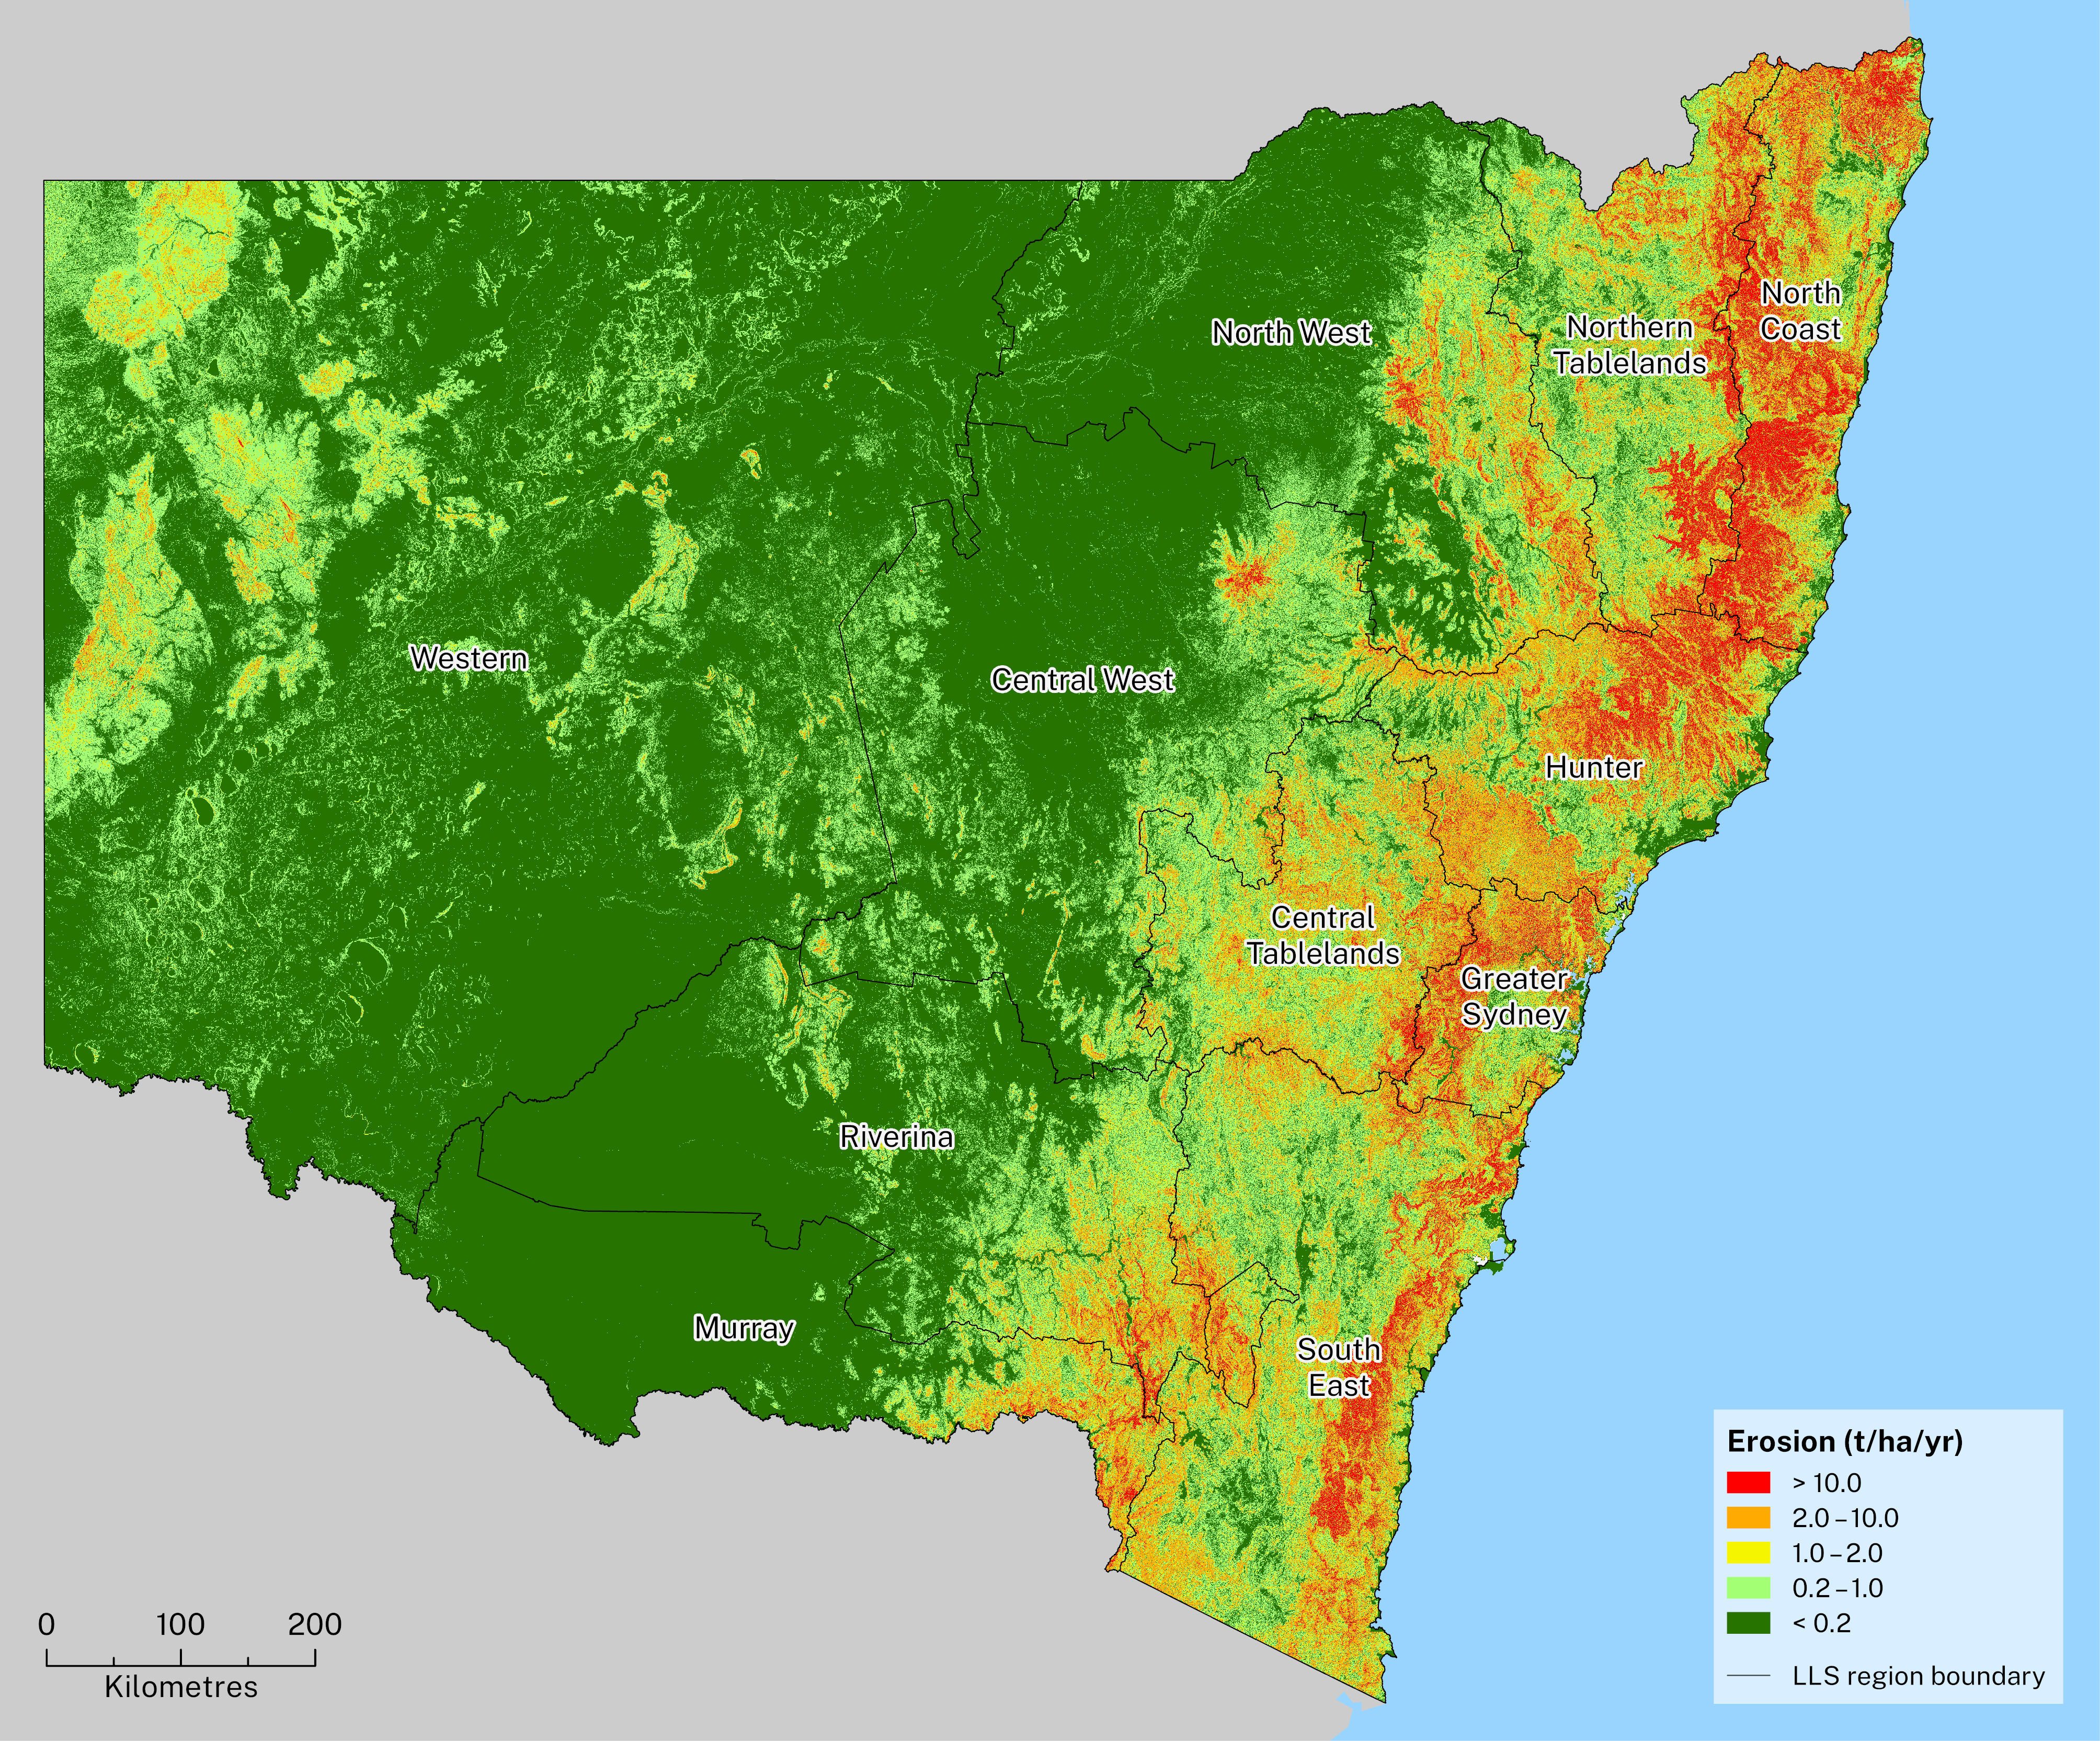
The average annual rate of hillslope erosion across NSW for 2021–23 (see Map L1.1) was calculated from modelling based on the Revised Universal Soil Loss Equation ().
Map L1.1: Annual mean hillslope erosion, 2021–23
Notes:
Access the interactive version of this map.
Modelling is based on the Revised Universal Soil Loss Equation.
The areas of highest erosion for 2021–23 were unchanged from previous years (see Map L1.2). These areas were:
- North Coast region
- Hunter region
- Greater Sydney region.
The Western region has the lowest levels of erosion, as it is mainly flat.
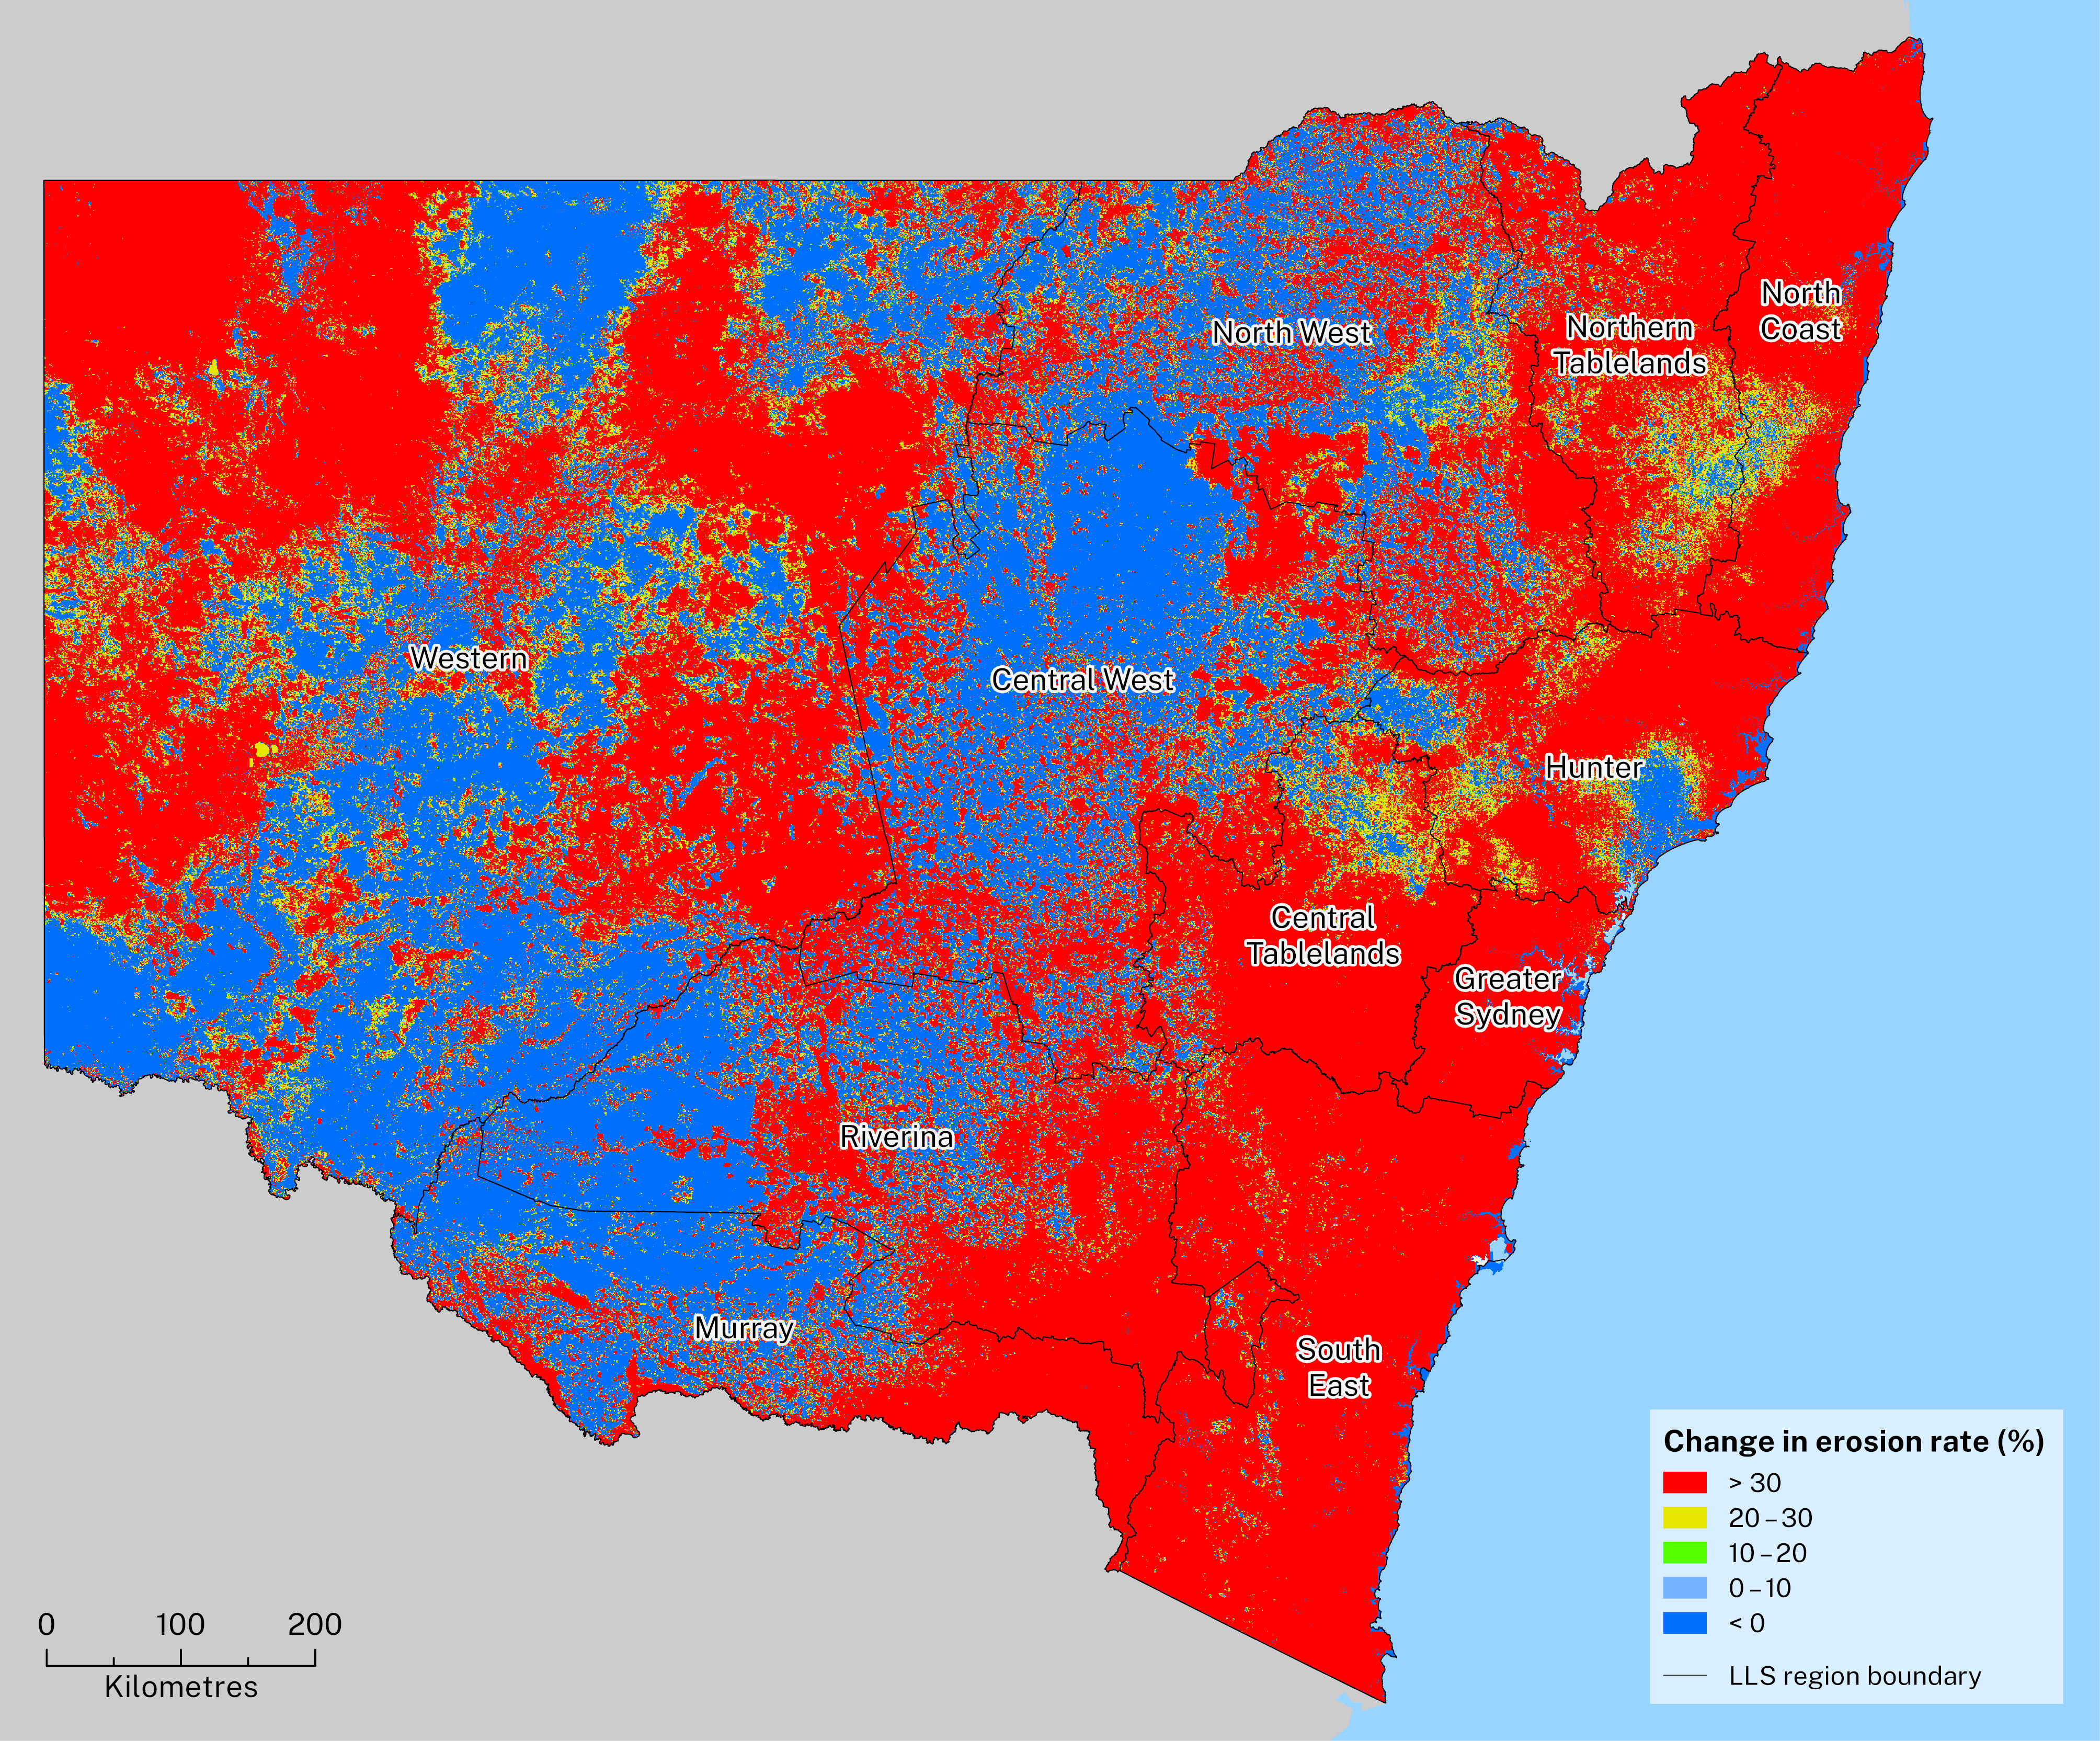
Map L1.2: Change in annual mean hillslope erosion, from 2001–20 to 2021–23
Notes:
Access the interactive version of this map.
Modelling is based on the Revised Universal Soil Loss Equation.
The variation in erosion rates was due mainly to:
- the 2019–20 bushfires
- the subsequent loss of vegetation cover
- storms in 2020 across eastern NSW (North Coast, Greater Sydney).
Modelled changes in hillslope erosion between 2001 and 2020 and the current reporting period are presented in Table L1.5 for all Local Land Services (LLS) regions in NSW.
Table L1.5: Modelled mean hillslope erosion (t/ha/yr) by region and the changes
| LLS Region | Baseline (2001–20) | Last period (2018–20) | Current period (2021–23) | Hillslope erosion (% change) |
|---|---|---|---|---|
| Central Tablelands | 1.38 | 1.51 | 1.83 | 32.18 |
| Central West | 0.30 | 0.31 | 0.34 | 15.92 |
| Greater Sydney | 3.27 | 4.21 | 5.07 | 55.08 |
| Hunter | 3.67 | 3.14 | 4.54 | 23.61 |
| Murray | 0.34 | 0.28 | 0.54 | 58.68 |
| North Coast | 5.44 | 4.76 | 7.28 | 33.98 |
| North West | 0.64 | 0.55 | 0.73 | 15.19 |
| Northern Tablelands | 3.07 | 2.40 | 3.71 | 20.66 |
| Riverina | 0.46 | 0.40 | 0.65 | 40.46 |
| South East | 1.69 | 1.93 | 2.68 | 58.93 |
| Western | 0.17 | 0.13 | 0.20 | 22.76 |
| NSW | 0.95 | 0.88 | 1.26 | 32.62 |
Notes:
The value for all NSW is not the simple average of the Local Land Services regions, due to their differing areas.
t/ha/yr is tonnes per hectare per year.
The yearly averages for rates of hillslope erosion between 2001 and 2023 across NSW are presented in Figure L1.1, which shows:
- the average erosion rate for 2021–23 was 1.32 tonnes per hectare per year (t/ha/yr)
- the average hillslope erosion rate for the baseline period (2001–20) was 1.0t/ha/yr
- hillslope erosion over 2021–23 increased by about 32% compared with 2001–20, while the highest overall erosion rate for the past 20 years was in 2020 (1.80t/ha/yr)
- most (86.1%) of NSW had an erosion rate of less than 0.5t/ha/yr (arguably the tolerable erosion rate, the maximum level of soil loss without significant degradation), while 13.9% of NSW had an erosion rate of more than 0.5t/ha/yr.
Figure L1.1: Hillslope erosion in NSW, from 2001 to 2023
Soil pH (acidification)
Soil acidification is moderate, and available data shows it has been worsening over time.
All plants, whether natural or grown for agriculture, function within different ranges of soil pH ().
Soil pH indicates whether a soil is acidic or alkaline. The pH scale is from 0 (most acid) to 14 (most alkaline) and the level 7 is neutral. Acidic soils, particularly with pH levels below 4.5, pose challenges for agricultural crop growth due to associated toxicities ().
Modelling has predicted that soils in NSW will become slightly more alkaline over time. The influence of farming on soils, however, can make them more acidic (). Ammonium-based fertilisers increase nitrate levels through a process called nitrification, where ammonium is converted into nitrate by soil bacteria. This process releases hydrogen ions into the soil, which lowers the pH, making the soil more acidic.
Modelling of pH levels in the top 10cm of soil shows that soils with higher acidity occur along the east coast and Central Tablelands regions, while more alkaline soils are in the drier western regions of the State (see Map L1.3).
Map L1.3: pH levels in the top 10 centimetres of soils in NSW, 2020
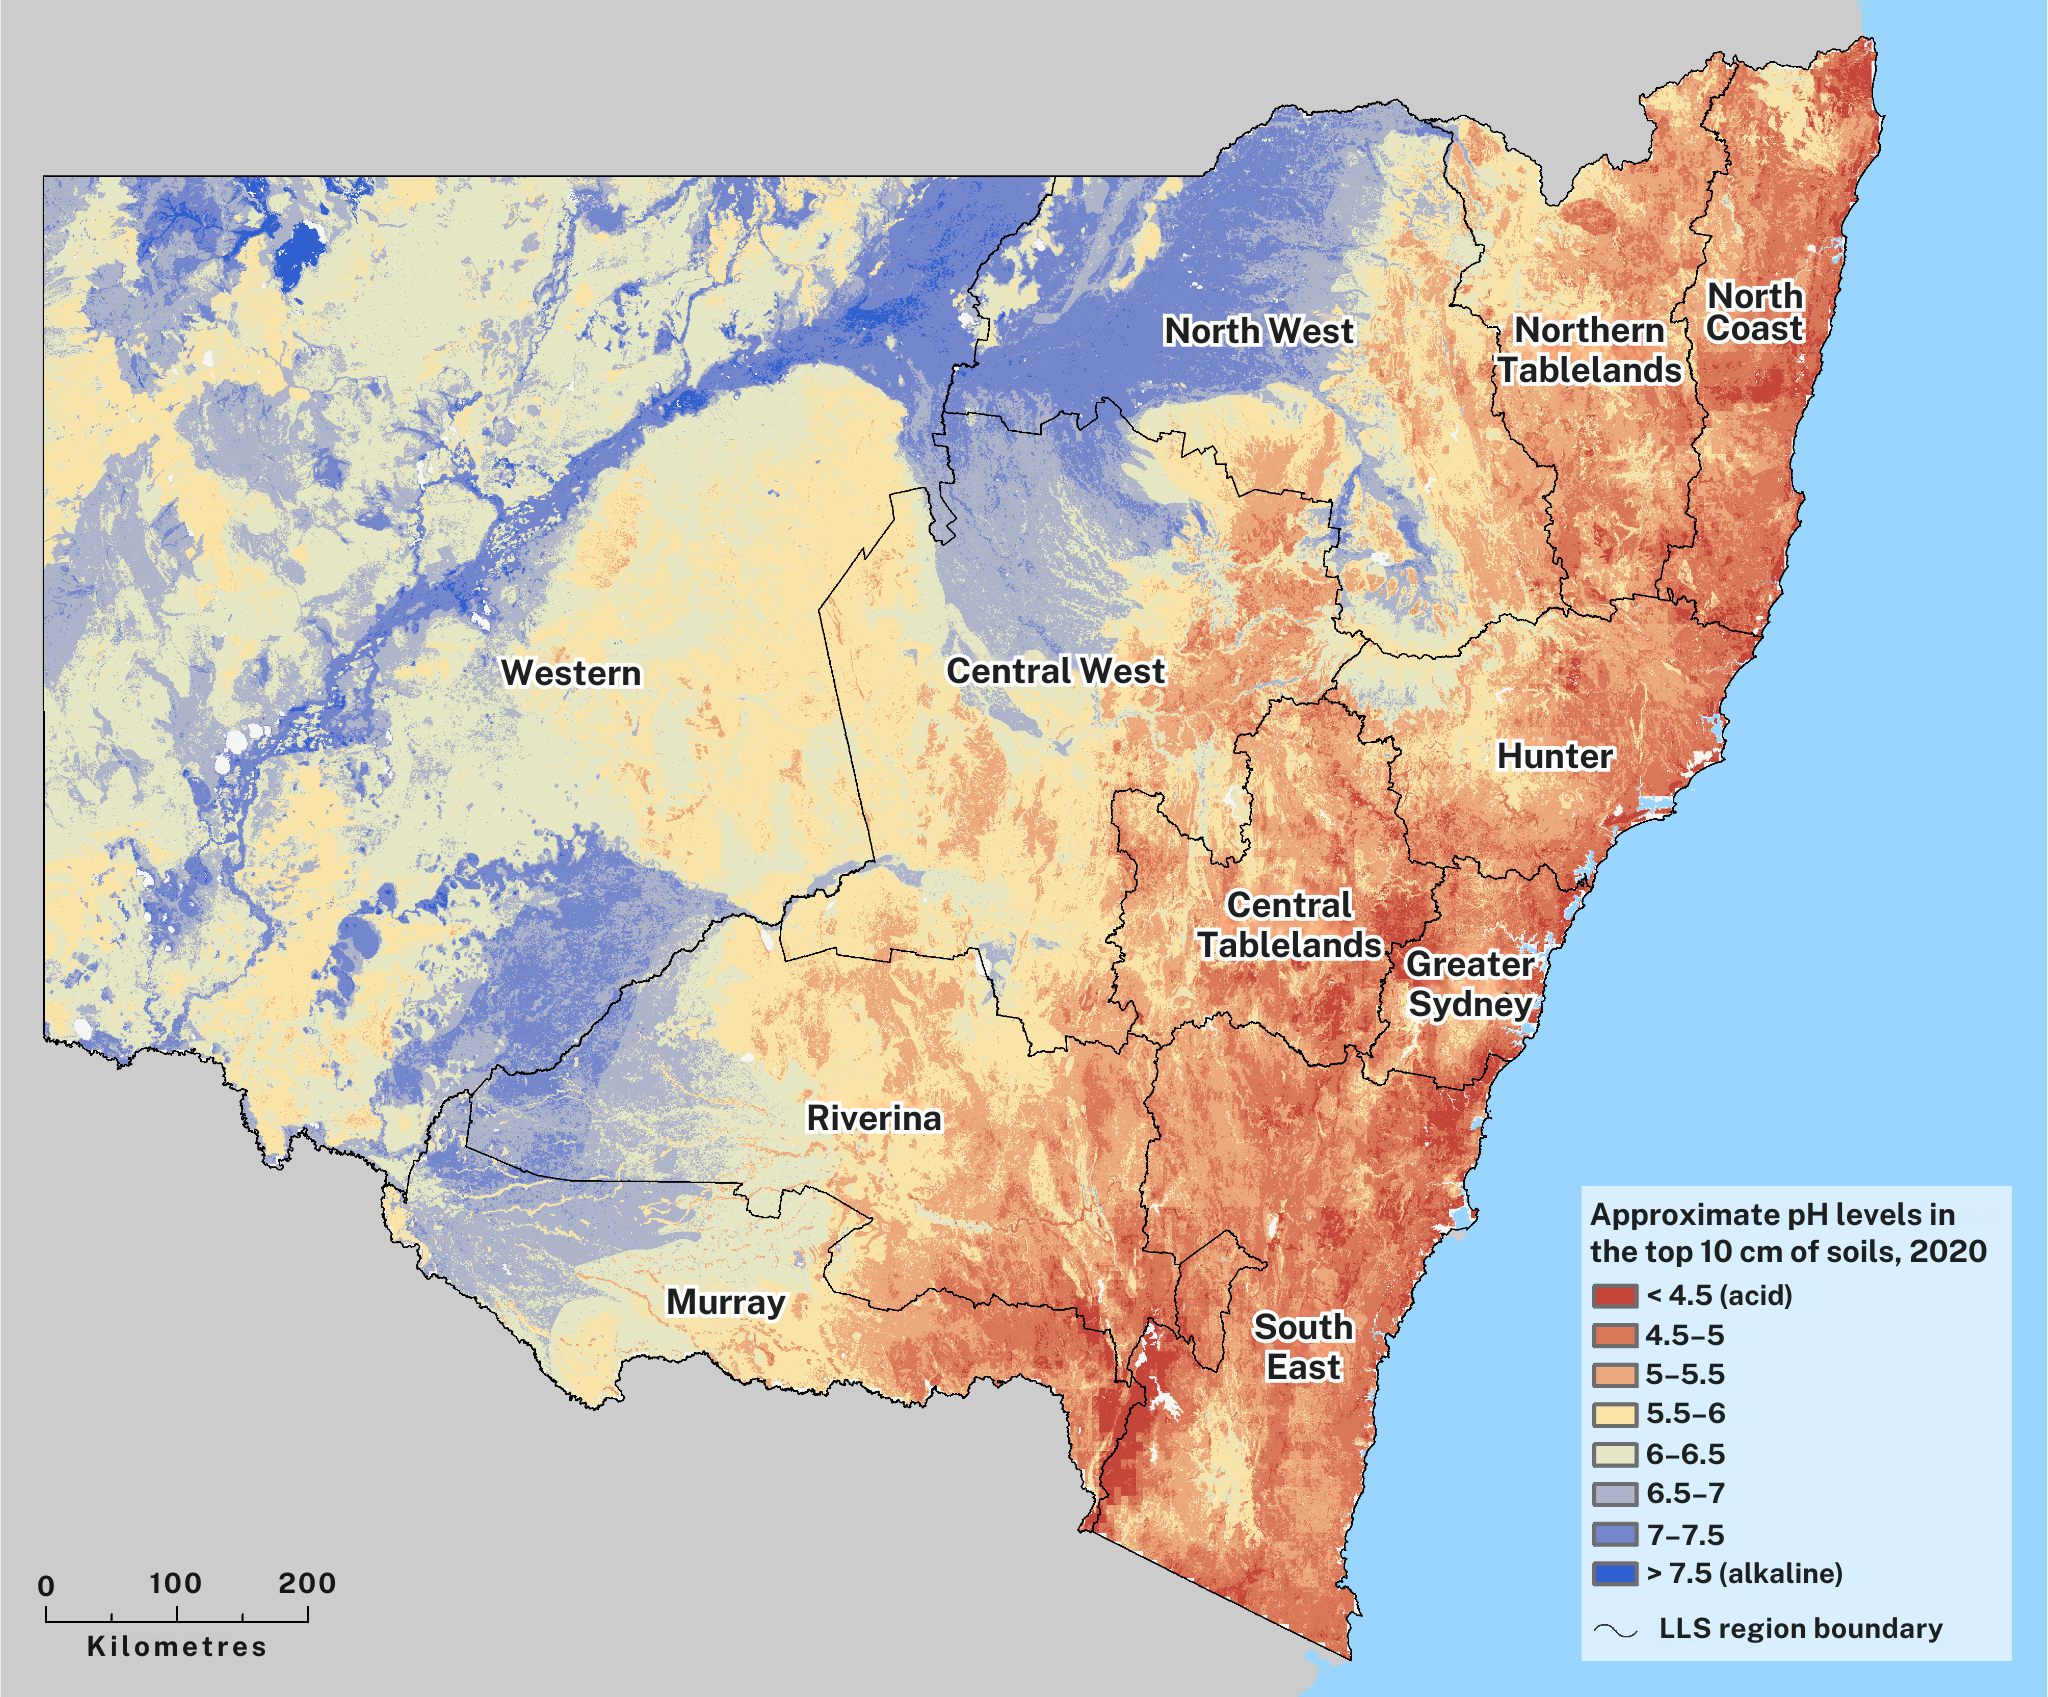
Notes:
Access the interactive version of this map.
All pH measurements refer to laboratory analysis by the CaCl2 method, the standard method for measuring pH in soil in Australia. pH measured in CaCl2 is normally between 0.5 and 0.9 units lower than pH measured in water, and more accurately reflects the conditions experienced by plants in soil (NSW Agriculture 2000; Hazelton & Murphy 2016).
The changes in soil pH levels from 2006–20 in Map L1.3 should be compared to data on current pH levels shown in Map L1.4.
Modelling of pH levels in the top 10cm of soil agricultural areas of NSW suggests that much of the State’s agricultural land is becoming slightly more acidic, with soil pH declining by 0.15 or more from 2006–20 (see Map L1.4).
This trend towards acidification is most evident in the Riverina, Murray and Central West Local Land Services regions.
Agricultural land mapping excludes:
- nature conservation reserves and national parks
- private land set aside for conservation
- State forests and private forests used for logging
- the rangelands of the western Local Land Services region.
This modelling incorporated changes in land use and groundcover but did not consider the application of lime, which is often used by farmers to raise soil pH levels (to make it less acidic). Exclusion of the use of lime means that the data on acidification is likely to be the worst-case scenario. Therefore, with the use of lime, some acidic soils may be improved for agriculture and other uses.
Map L1.4: Modelled change in pH levels for the top 10cm of soil, from 2006–20
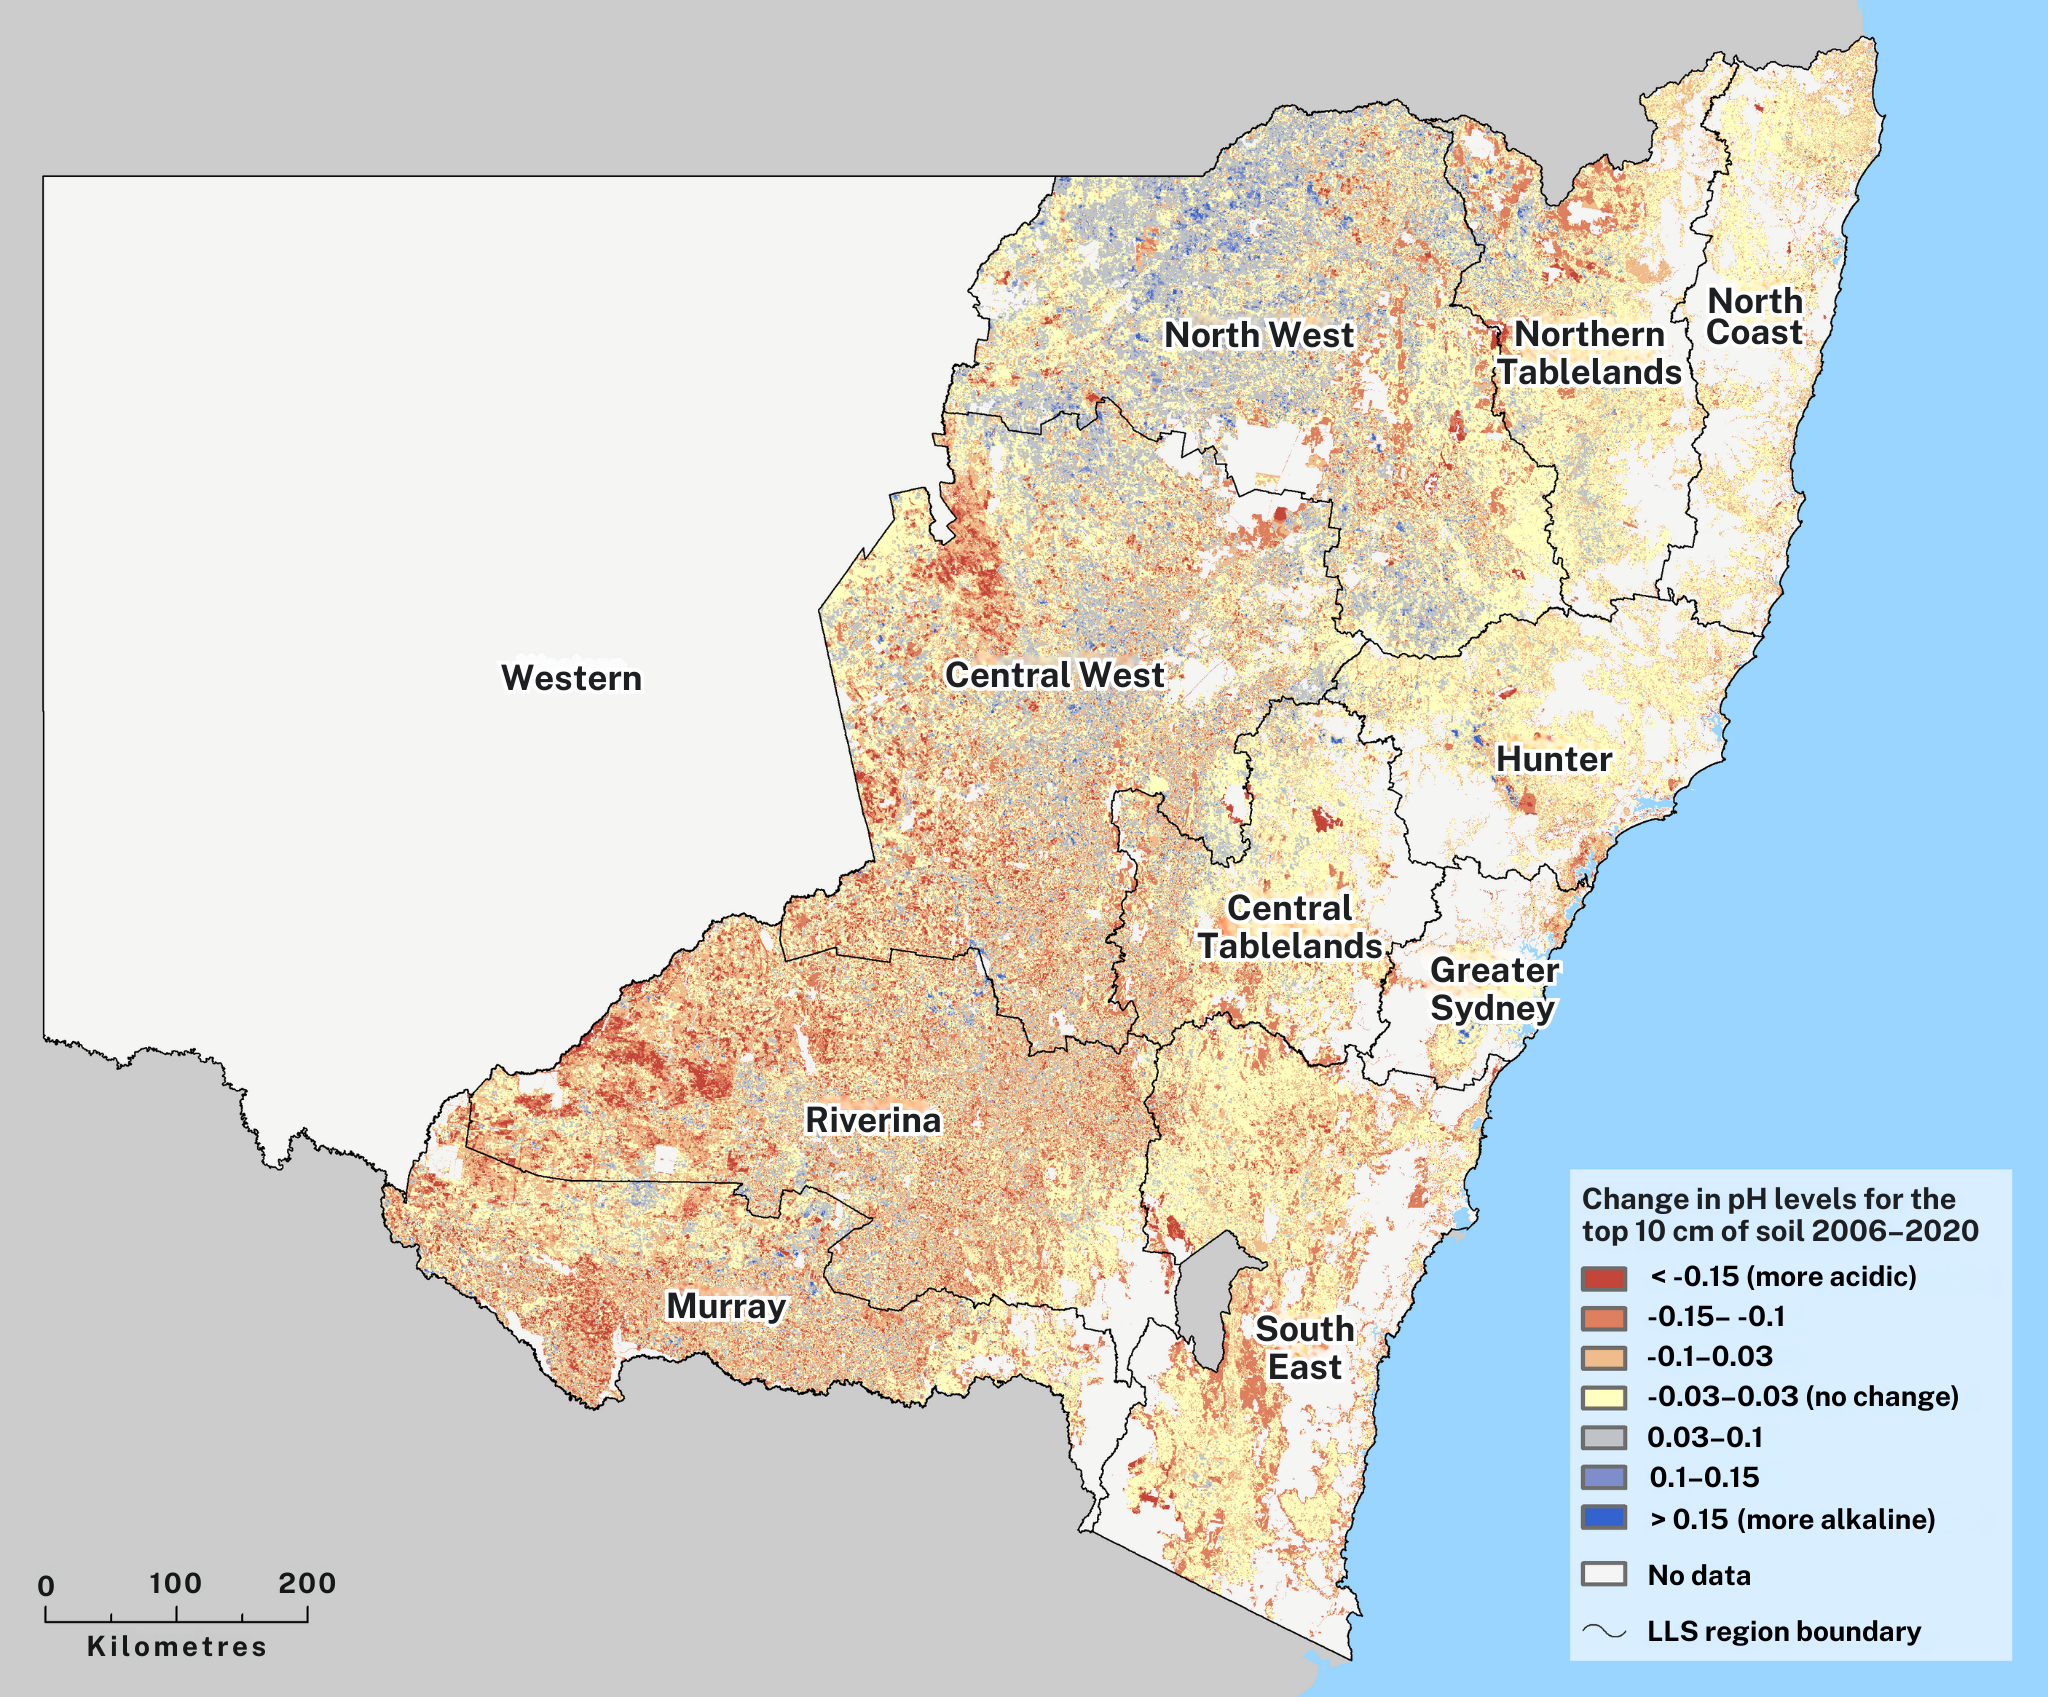
Notes:
Access the interactive version of this map.
All pH measurements refer to laboratory analysis by the CaCl2 method, the standard method for measuring pH in soil in Australia. Soil pH measured in CaCl2 is normally between 0.5 and 0.9 units lower than pH measured in water and more accurately reflects the conditions experienced by plants in soil (NSW Agriculture 2000; Hazelton & Murphy 2016).
Even slight pH decreases can affect crop and pasture growth, especially acid-sensitive crops like canola and lucerne.
Increases in pH levels leading to soil alkalinity of more than 0.1 have been found in some central and northern regions, affecting about 3% of NSW agricultural land.
Areas with very low soil pH that are getting even lower soil pH are of particular concern for acidification, especially where subsoil acidity is present. Subsoil acidity can increase the effects of topsoil acidification, making it harder for plant roots to get essential nutrients and water.
Modelled changes in pH levels between 2006 and 2020 for the top 10 and 30cm of soil are presented in Table L1.6 for all Local Land Services regions in NSW.
The highest average reductions in soil pH levels are in the Riverina and Murray regions, with reductions of 0.05 and 0.04 pH units, respectively.
Table L1.6: Modelled changes in mean pH levels, between 2006 and 2020
| LLS region | Change in pH level (0–10cm) | Change in pH level (0–30cm) |
|---|---|---|
| Central Tablelands | -0.02 | -0.01 |
| Central West | -0.03 | -0.01 |
| Greater Sydney | -0.02 | -0.01 |
| Hunter | -0.02 | -0.01 |
| Murray | -0.04 | -0.02 |
| North Coast | -0.03 | -0.02 |
| North West | -0.01 | 0.00 |
| Northern Tablelands | -0.02 | -0.01 |
| Riverina | -0.05 | -0.02 |
| South East | -0.04 | -0.02 |
| Western | - | - |
| NSW | -0.03 | -0.01 |
Notes:
Changes in pH are between 2006 and 2020.
pH change is modelled only over agricultural lands and excludes the western Local Land Services region. The value for all NSW is not the simple average of the Local Land Services regions, due to their differing areas.
Soil organic carbon
Soil organic carbon is moderate, and available data shows it has been worsening over time.
NSW is projected to experience a reduction in soil organic carbon in the near (2030) and far (2070) future (; ). This means a reduction in soil quality.
High soil organic carbon levels indicate:
- more nutrient availability
- higher biological activity
- better soil physical structure
- better water-holding capacity
- more aeration.
About 530 million tonnes of soil organic carbon, or 12.6% of the original levels, has been lost from the top 30cm of soil since European colonisation (). The greatest losses have been in regularly cropped, high-fertility soils.
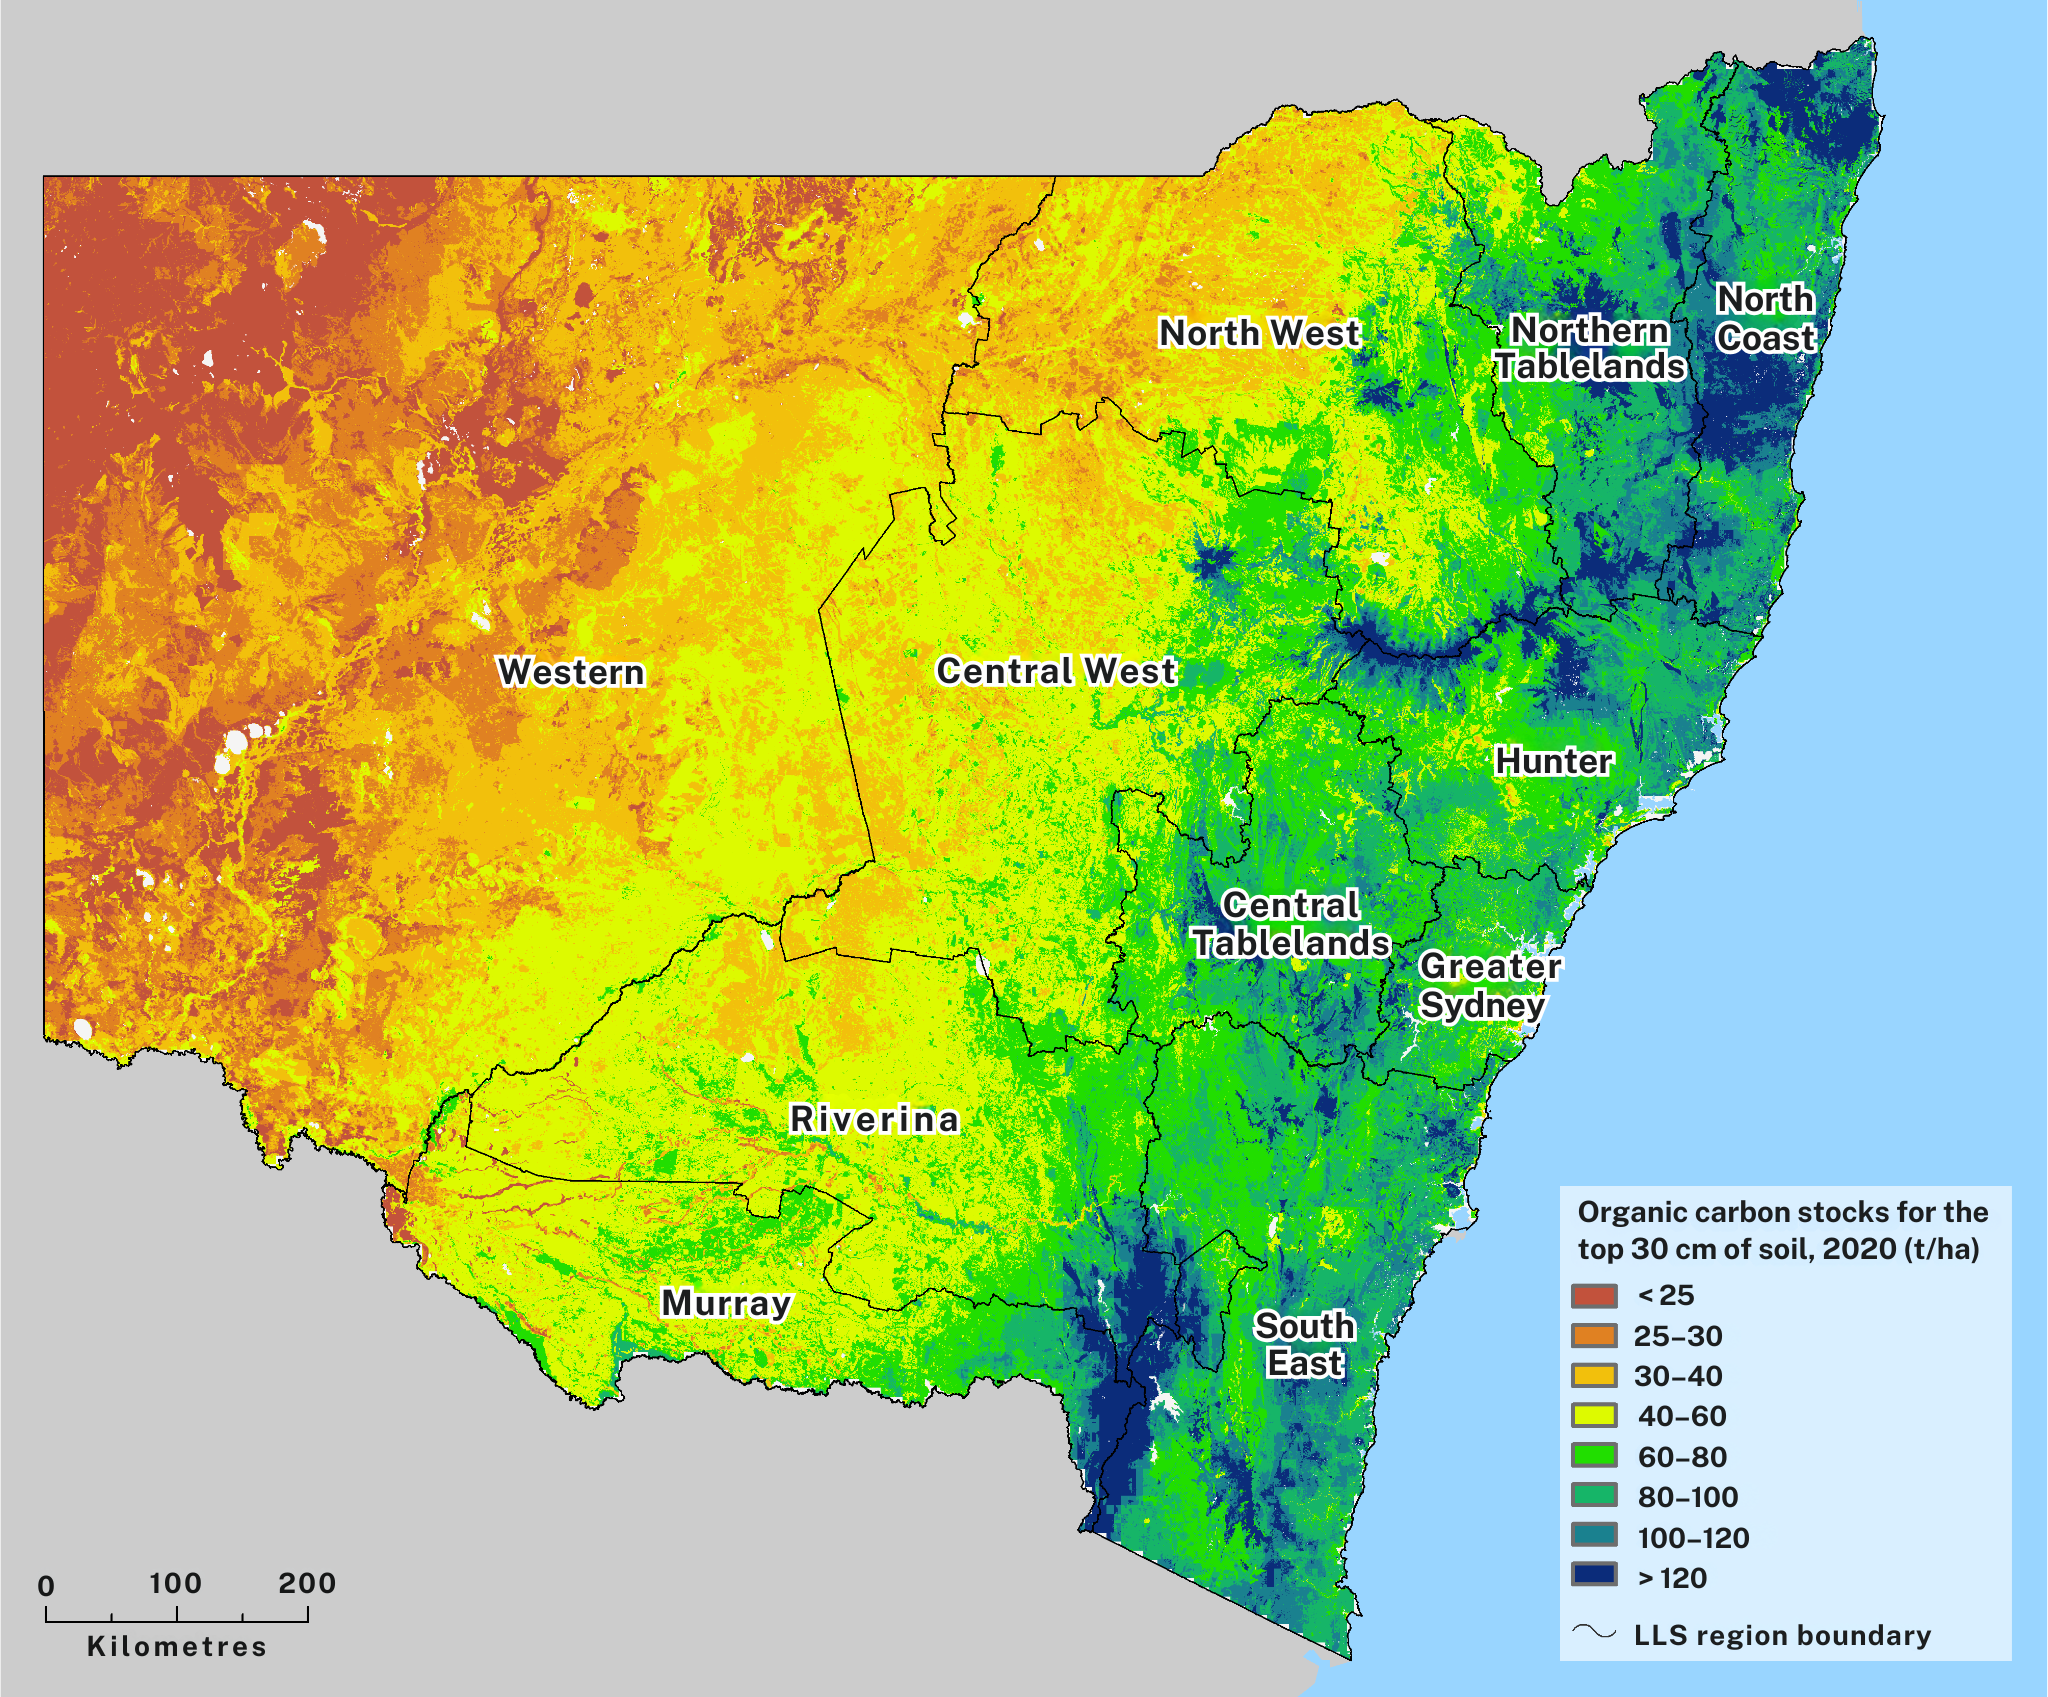
Modelling of organic carbon levels in the top 30cm of soil shows high variation across NSW (see Map L1.5). Lower levels in western regions of the state are due to their drier climate ().
Map L1.5: Soil organic carbon levels in the top 30cm of soil in NSW, 2020
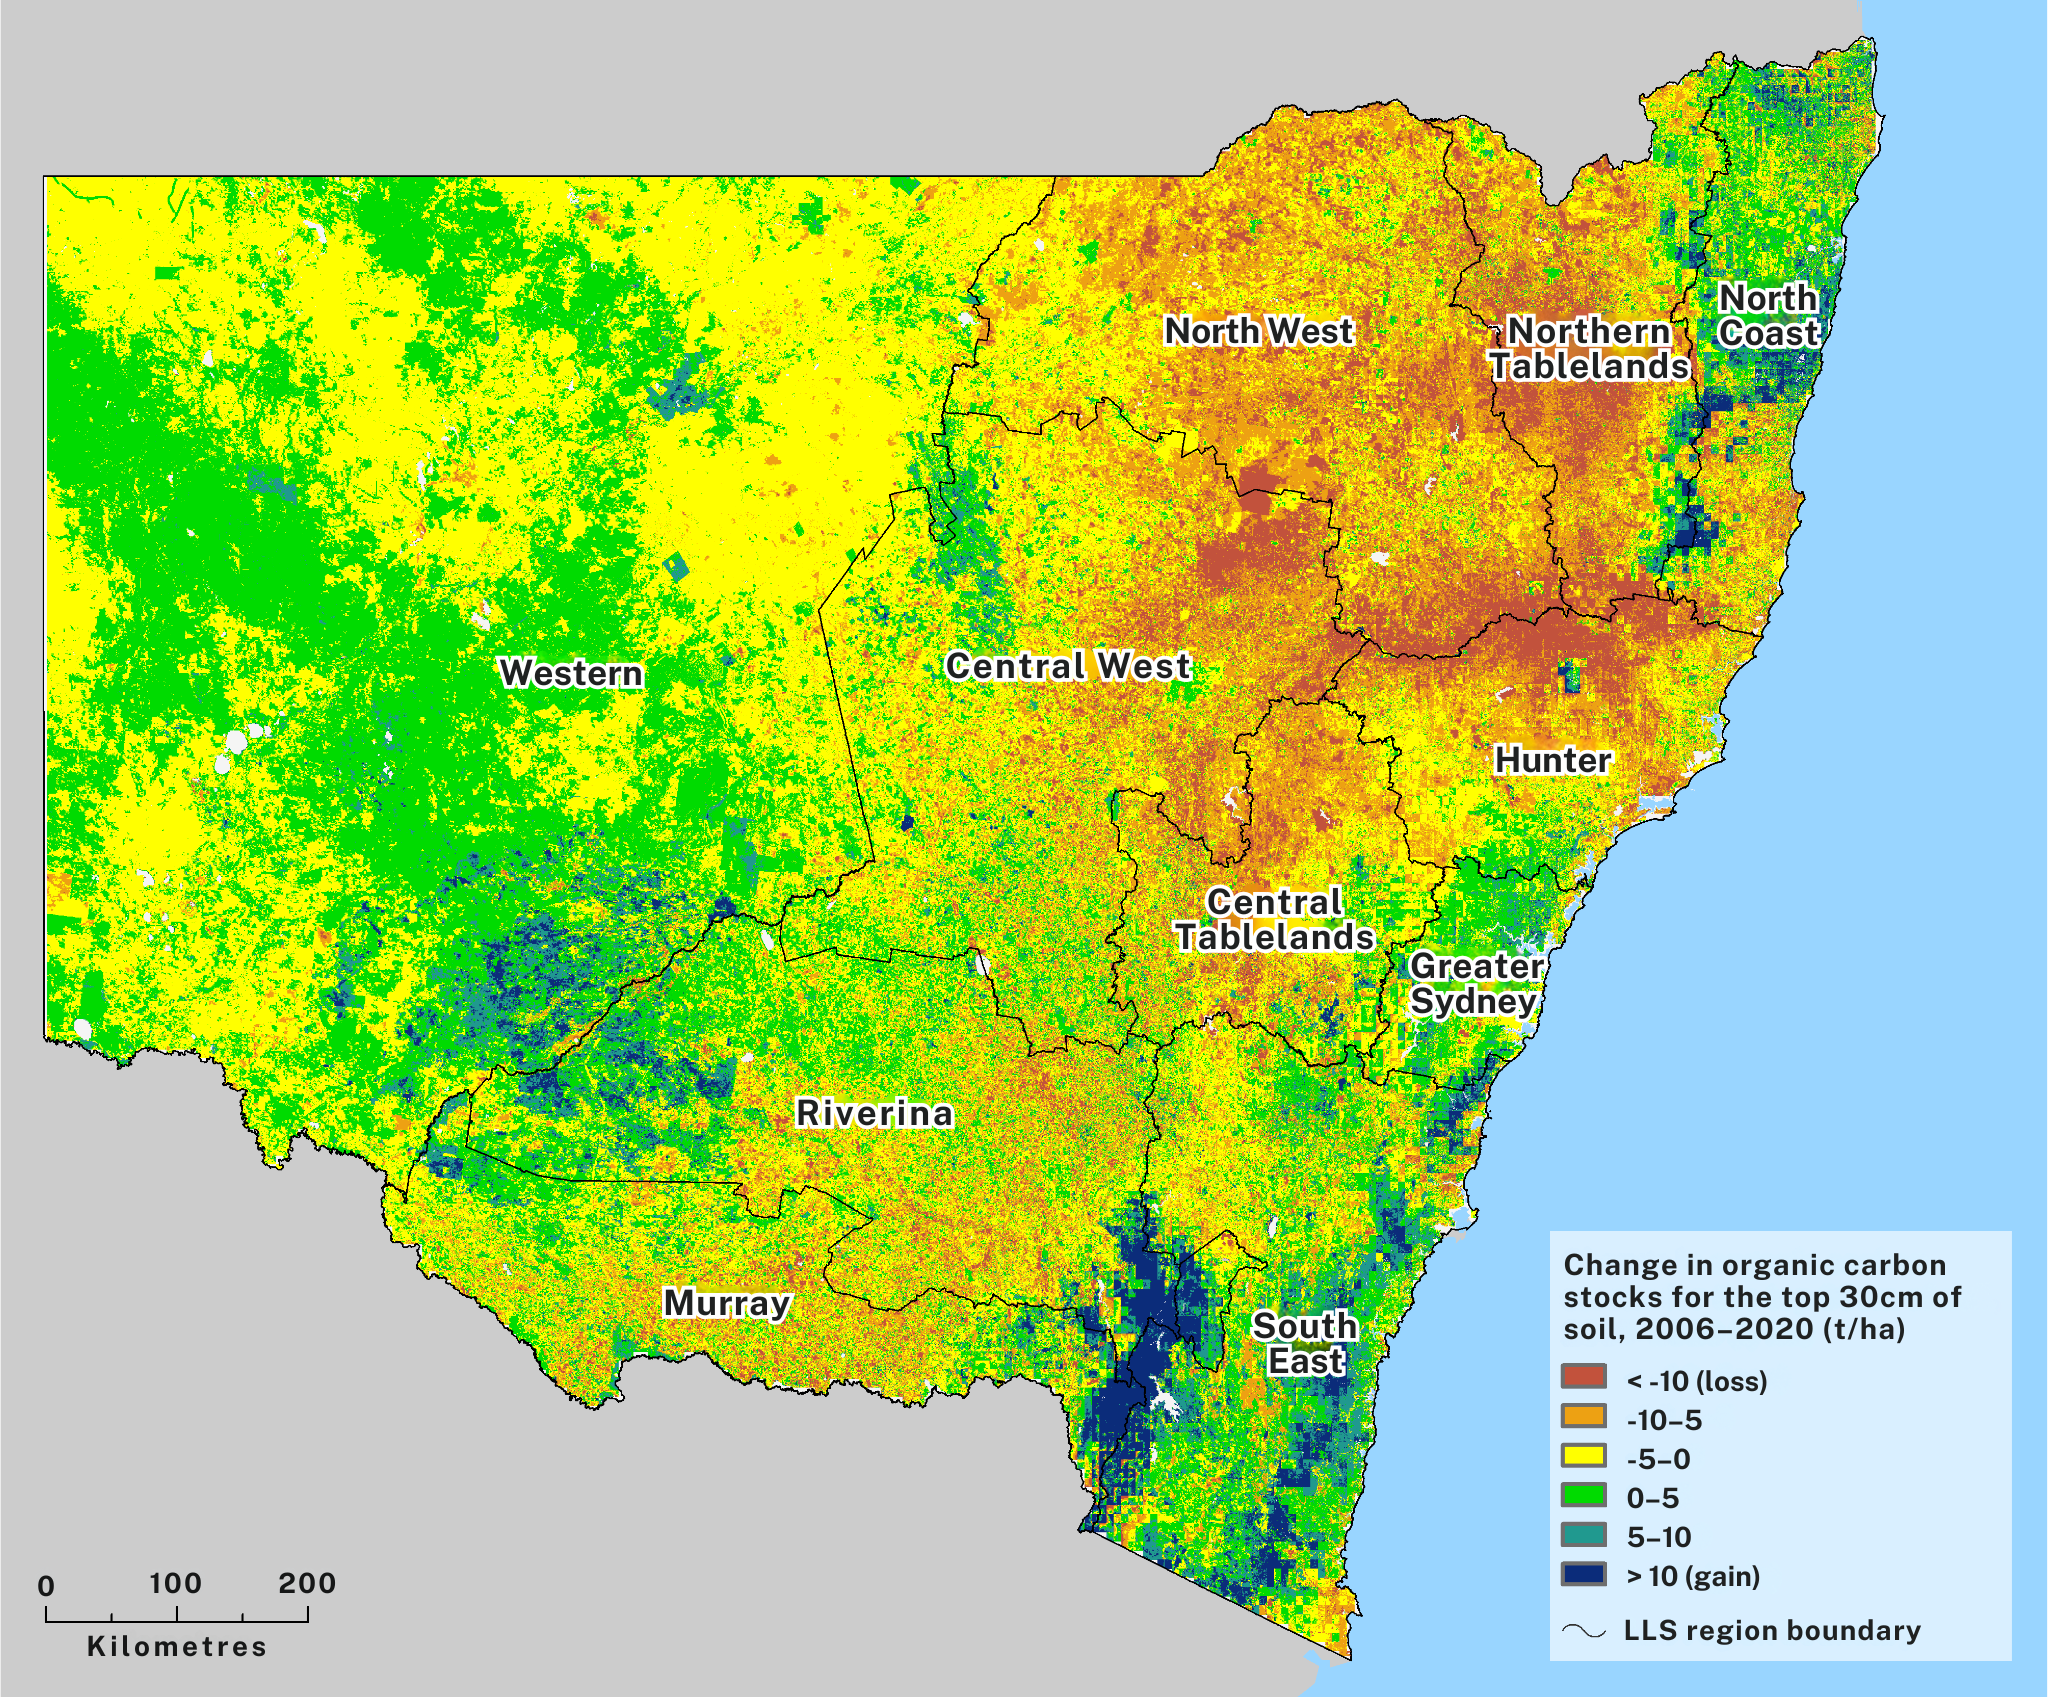
The soil organic carbon condition of soils across NSW is moderate but getting worse (see Map L1.6).
The condition is based on the change in current levels from natural levels before European colonisation. The change in soil organic carbon levels over the 15 years to 2020 was calculated from:
- data on changes in land use and groundcover
- the past 10 years of rainfall and temperature records.
According to modelling in 2021, most of NSW had experienced at least a 2.7 tonnes per hectare (t/ha) decline in soil organic carbon stocks from 2006–20 (see Table L1.7). This is a 3.1% decline.
The largest declines in levels in Local Land Services regions were:
- 6.6t/ha in the North West region
- 6.4t/ha on the Northern Tablelands region
- 6.3t/ha in the Hunter region.
Only the Greater Sydney and North Coast regions have slight increases in soil organic carbon levels.
Map L1.6: Change in NSW soil organic carbon levels, between 2006 and 2020
Land use changes can decrease soil organic carbon levels. A NSW study reported that soil organic carbon levels in the top 30cm of soil were lower on agricultural sites than in areas of native vegetation (). Extreme weather, such as prolonged droughts, also decreases soil organic carbon levels ().
The decline in soil organic carbon levels in NSW is due to:
- drier conditions, with higher temperatures and lower rainfall
- the move to more intensive farming with less vegetation, for example the move from grazing to cropping.
Projections suggest climate change will lead to substantial future losses in soil organic carbon, particularly in highland areas.
Table L1.7: Change in NSW soil organic carbon levels, between 2006 and 2020
| LLS region | Change in soil organic carbon – t/ha* in the top 0–30cm of soil |
|---|---|
| Central Tablelands | -4.8 |
| Central West | -4.0 |
| Greater Sydney | 1.4 |
| Hunter | -6.3 |
| Murray | -1.0 |
| North Coast | 0.89 |
| North West | -6.6 |
| Northern Tablelands | -6.4 |
| Riverina | -0.6 |
| South East | -2.1 |
| Western | 0.0 |
| NSW | -2.7 |
Notes:
Changes in soil organic carbon levels are over the period 2006–20.
The value for all NSW is not the simple average of the Local Land Services regions, due to their differing areas.
*t/ha is tonnes per hectare.
Wind erosion
Wind erosion, like hillslope erosion, has led to extensive soil loss and the decline of soil condition throughout NSW, especially in the drier western regions. Recent wet weather has reduced the level of wind erosion seen during the 2017–20 drought.
Dust in the air is an indicator of wind erosion degrading soils upwind of the area where the dust is falling. Dust activity is measured by the number of hours per year that the average dust concentration exceeds 25 micrograms per cubic metre (µg/m3).
Figure L1.2 plots average dust hours recorded at NSW DustWatch stations, 2007–08 to 2022–23.
See the Community DustWatch program website for additional background and data from 21 individual monitoring stations west of the Great Dividing Range.
Figure L1.2: Average dust hours recorded at NSW DustWatch stations, 2007–08 to 2022–23
Notes:
The red horizontal line is the average of the baseline (2010–11 to 2019–20) and the green line is the average for the reporting period 2020–21 to 2022–23.
Improved land management changes in south-western NSW have reduced wind erosion in cropping areas (). Despite this, drought conditions can exacerbate wind erosion, such as in 2017–20 when an extreme drought with ‘no clear historical precedent’ () led to large areas of the sheep and wheat belt in central NSW being affected by wind erosion.
Salinisation
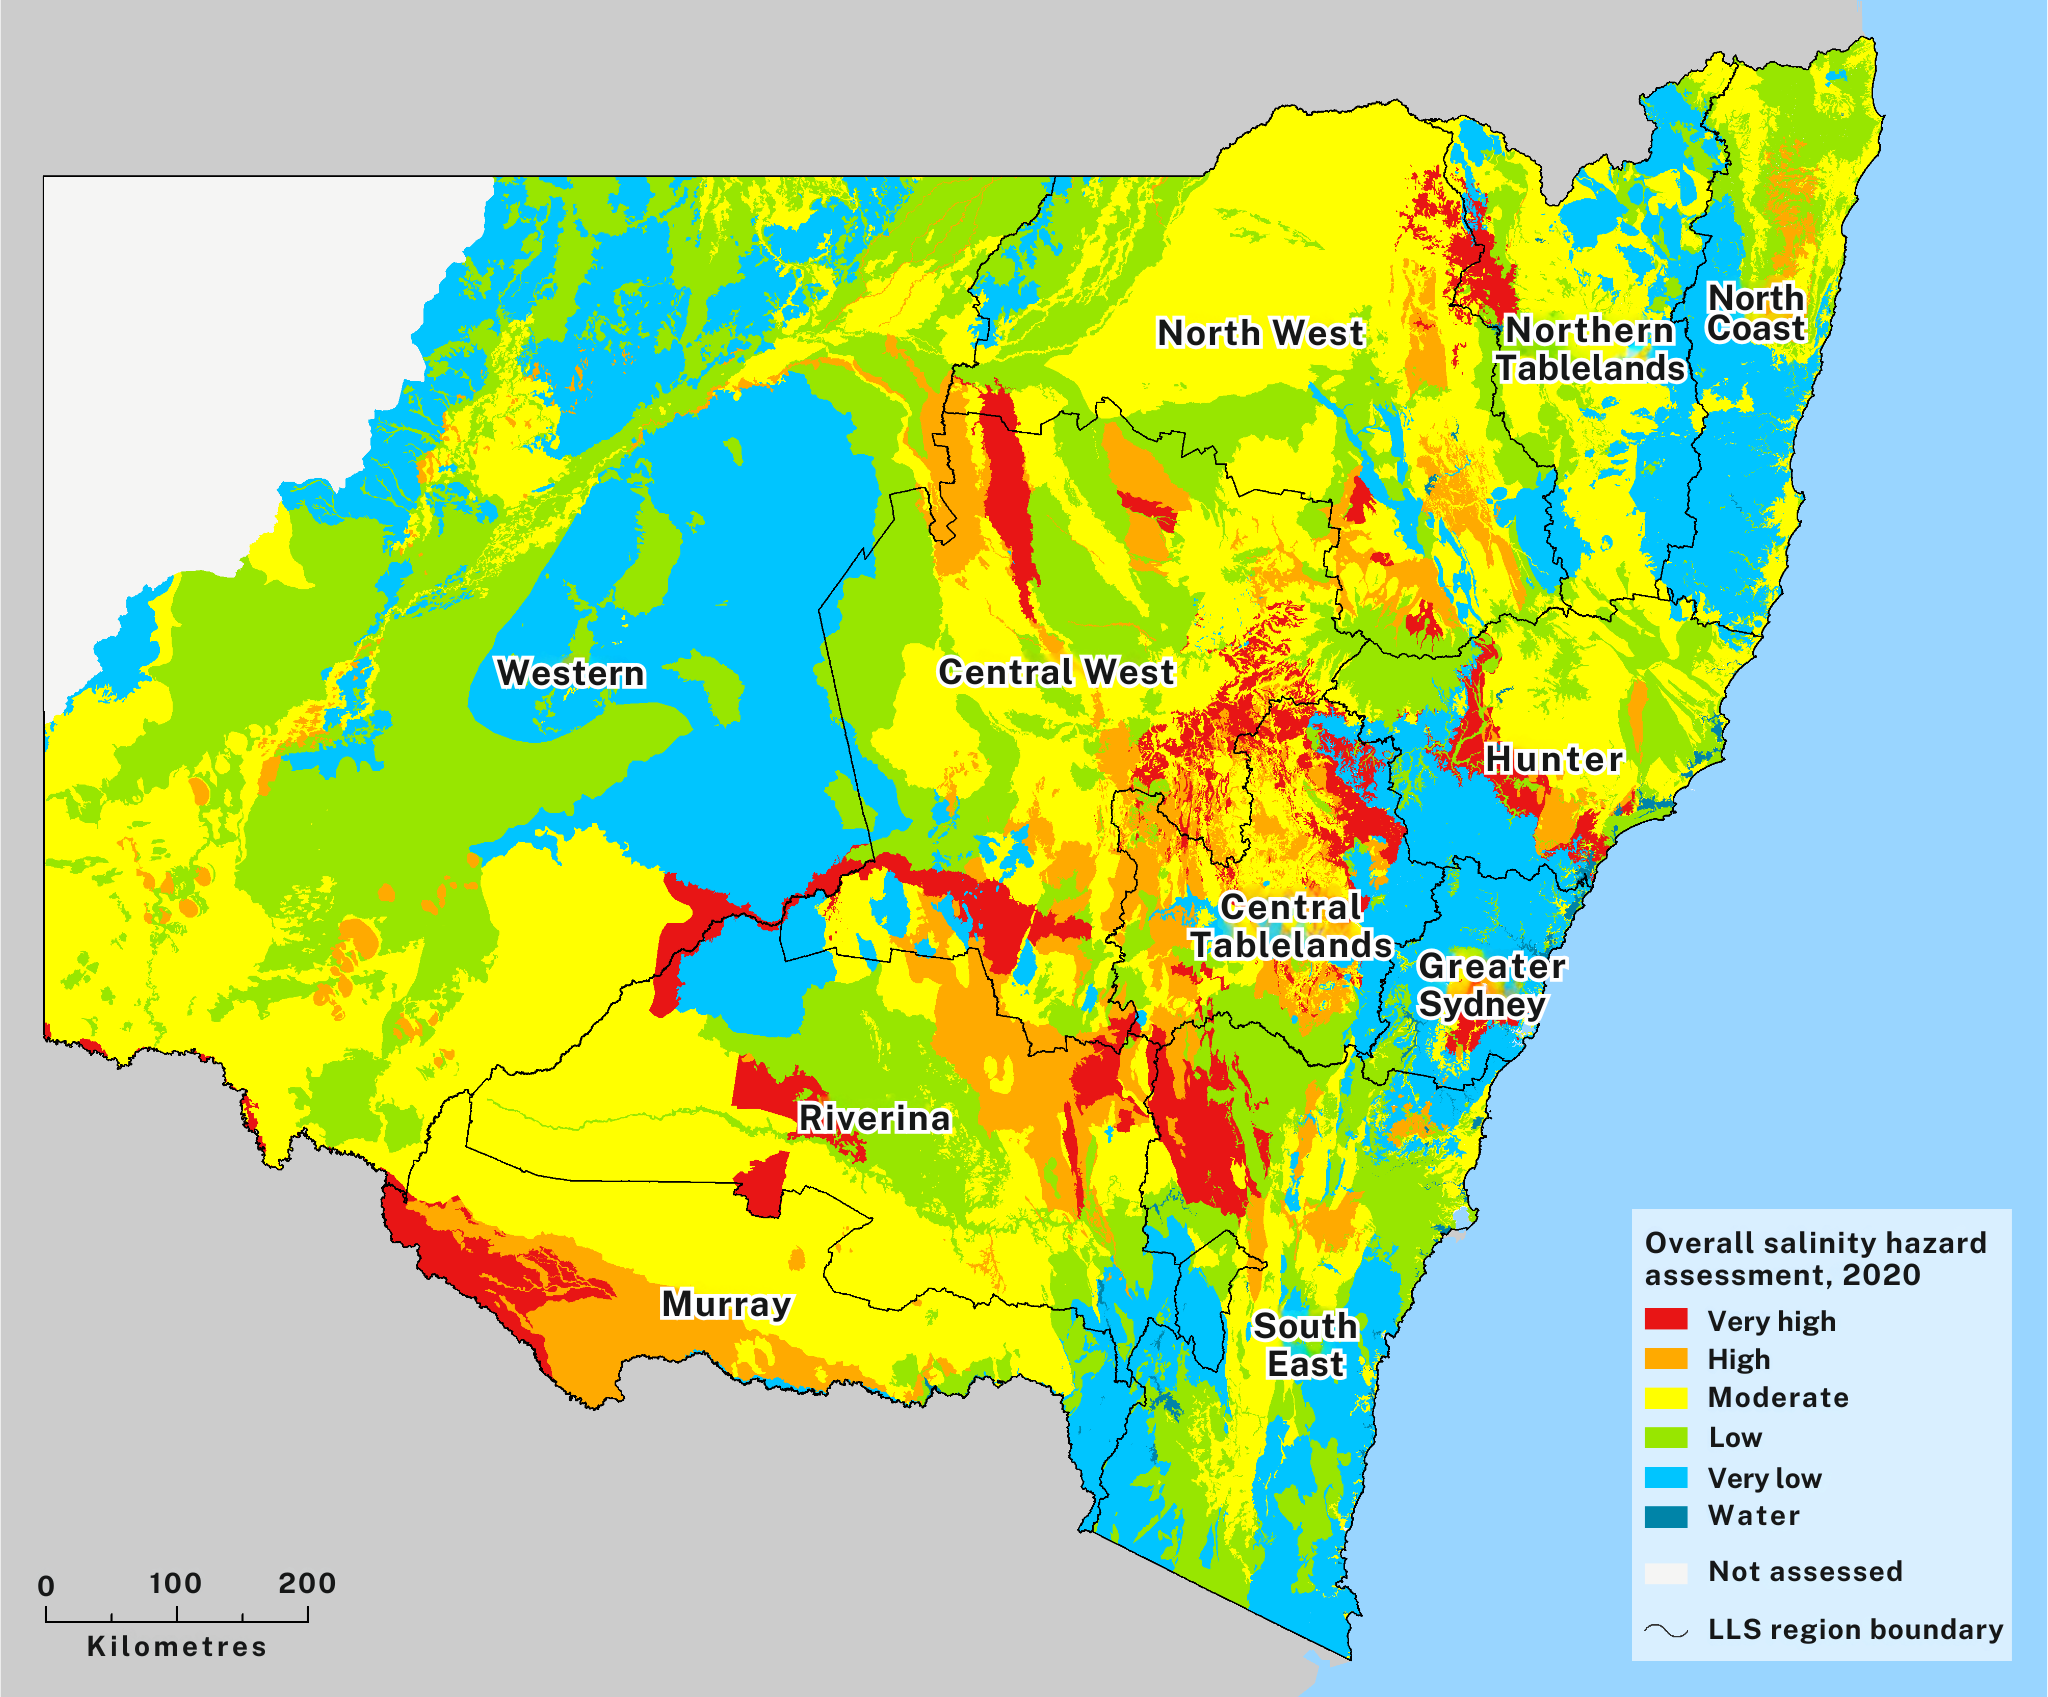
Salinisation, the process of salts being brought to the surface, is currently moderate and stable (see Table L1.1 for process).
A general salinity hazard map for most of NSW has been compiled from:
- salinity hazard assessments of water quality from NSW Water Resource Plans 2017–18
- previous Hydrogeological Landscape hazard assessments from 2008–20
- salinity hazard assessments for catchment action plans in 2012.
Salinity hazard ratings are based on whether salinity is likely to happen and what its impacts might be. Salinity assessments are based on:
- the impacts of salinity on the land
- the impacts of salt concentrations and loads in streams near the land.
The severity of each of these will vary depending on local factors that influence how salt and water move through the landscape of the area affected.
Areas with high or very high salinity hazards cover about 12% of NSW (see Map L1.7). Areas of concern include:
- the Hunter, Greater Sydney and Central West regions
- the Yass and Boorowa areas
- the Mid and Lower Murray and Murrumbidgee irrigation areas.
Map L1.7: Overall salinity hazard assessment for NSW, 2020
In areas with high saline rates, soils can contain excessive sodium ions (sodic soils) which negatively affects soil structure by causing clay particles to disperse. Sodic soils may have poor aggregation, reduced permeability and decreased infiltration rates, resulting in waterlogging and poor plant growth.
NSW Water Resource Plans have assessed areas in the Murray–Darling Basin for salinity hazards. The Murray–Darling Basin Authority keeps a register of salinity credits and debits that records actions that affect salinity in the basin.
Future changes in rainfall patterns and evaporation in all regions () will reduce the balance between:
- agricultural runoff and natural overland flows
- shallow and deep drainage.
These changes will affect the movement and concentration of salts.
See the topic for more information.
Pressures and impacts
Intensive land use and clearing
While land management has improved, the pressure on soil condition continues due to land use changes and increasing intensity of use. There is more need to ensure that soils and land are managed sustainably to handle some disturbance or use. This will help ensure the long-term productive use of NSW soils.
The overuse of cultivation, fertilisation, irrigation and pesticides have historically also contributed to soil functional decline ().
Residential, commercial, and industrial land uses also threaten soil health. Industrial activities can contaminate soil and reduce its capacity to support ecosystems or agriculture. Constructing roads and buildings often results in topsoil removal, degrading soil quality.
Extreme climate and weather events
Climate change will increase soil degradation through wind erosion and associated loss of soil carbon bound up with dust particles (; ).
Climate change may lead to:
- increased risk of extreme weather events, such as drought, bushfires and storms
- broader changes in weather patterns, such as increasing temperatures and fluctuations in rainfall ().
See the topic for more information.
Changed rainfall patterns
While soil management is relatively uncomplicated in normal weather conditions, the unpredictability and variability of severe weather can rapidly reduce the capacity of soils to resist disturbance and stay productive.
Severe weather may result in:
- loss of carbon from the soil, meaning it will be returned to the atmosphere
- depletion of microorganisms and soil fauna
- soil erosion.
One of the measures of soil erosivity is the ability for rainfall to cause erosion, based on rainfall amount and intensity.
While significant uncertainty remains around rainfall projections, it is likely that some parts of NSW will experience an increase in extreme rainfall events, which can affect rainfall erosivity (see the topic).
The projected seasonal changes in rainfall erosivity alone could cause a sevenfold increase in soil loss, even if the total rainfall amount and intensity are the same (). This loss of soil could then affect water quality, agricultural productivity, forestry and biodiversity.
The areas most affected will include mountainous regions of the Great Dividing Range especially in the high-risk Central Coast, North Coast and Hunter regions. To manage erosion risk, it will be important to maintain good groundcover in these areas ().
Bushfires
The effects of fire on soil health relate to fire severity, types of ecosystems on the land and soil properties. While low to moderate intensity fires can improve soil fertility, structure and organic carbon, severe fires can damage soil health due to:
- loss of nutrients and organic matter ()
- soil erosion following decreased ground cover
- microbes in the soil decreasing or changing, affecting nutrient cycling and decomposition
- altered soil pH
- loss of native vegetation and invasion by weeds.
Soil health improved during the 2020–22 period as there were fewer bushfires due to high rainfall and mild temperatures associated with La Niña conditions.
Climate change projections suggest that severe fire weather conditions will increase across most ecosystems, including in NSW (). If this results in increased fire activity, this will damage soil health and increase erosion ().
See the topic for more information.
Invasive species
Invasive plant and animal species can lead to soil erosion and compaction, reduced nutrient cycling and microbial activity.
- Invasive weeds like lantana and African olive grow densely, often forming an impenetrable mass of vegetation. Their shallow root systems and ability to release chemicals that stop growth of native vegetation mean they spread fast.
- European rabbit digging behaviour and grazing can lead to soil erosion and hillslope erosion, deplete native vegetation, degrade ecosystems and damage habitat for native plants and animals.
- Feral pigs root and dig into the soil in search of food which can expose bare soil. They can also create new openings in the ground, making it easier for weeds to spread.
- Feral horses, particularly in Australia’s alpine regions like Kosciuszko National Park, contribute to soil erosion, compaction and degradation, which can significantly affect vegetation, water flow and overall ecosystem health.
See the and topics for more information.
Responses
Agricultural land use
The Local Land Services Agricultural Services Framework 2021–26 aims to increase agricultural productivity in a sustainable way that:
- enhances farm natural assets without deteriorating natural assets including soils
- manages risks associated with climate change and market disruption.
Through the framework, Local Land Services helps landholders to:
- assess soil health and take measures to improve it by controlling erosion, reducing sediment loss and increasing ground cover, and other safeguards, such as maintaining riparian (where water meets land) buffers
- maximise the water bearing properties of soils and factors impacting water use efficiency
- understand soil nutrient interactions, capabilities and constraints
- plan fertiliser investment and land management strategies.
The Farming Forward Project, initiated through the framework, aims to boost farm productivity, resilience and sustainability. Local Land Services tests soils to:
- improve soil health
- manage soil constraints
- match nutrient requirements to production goals
- manage soil moisture
- optimise pasture and crop growth and yield.
Protecting soils during drought
Local Land Services leads the Saving Our Soils During Drought project. This is a federally funded project delivered in partnership with six farming system groups, the Southern NSW Drought Hub and the Soil Knowledge Network.
The project helps farmers improve land management by:
- increasing and improving their drought resilient land management practices
- strengthening collaboration between farmers and other land managers
- demonstrating sustainable land management practices for improving drought resilience.
Various programs contribute to achieving project metrics (see Table L1.8).
Table L1.8 Key Local Land Services metrics for improving soil condition through the Saving our Soils During Drought project
| Metric | Total area of land (hectares) (2021–22 to 2023–24) | Top contributing programs |
|---|---|---|
| Area (in hectares) of land managed for improved soil condition | 492,596 |
|
| Area (in hectares) of land managed for improved agricultural production | 2,104,648 |
|
Notes:
To find your Local Land Services region, visit this map. Select your region to explore projects and programs.
Regenerative agriculture
Regenerative agriculture focuses on restoring soil health, improving biodiversity and improving ecosystem resilience. Soil health improvement strategies emphasise practices that rebuild soil organic matter and promote natural processes, such as reduced tillage to minimise soil disturbance and rotational grazing ().
This approach aims to regenerate the land, leading to better water retention, increased carbon sequestration (as a carbon sink) and enhanced productivity.
Urban development and infrastructure
Water Sensitive Urban Design principles can help minimise the impacts of sealed urban areas on waterways and water-dependent ecosystems. These principles include:
- managing water runoff, pollution and salinity
- rehabilitating and maintaining riverbank and wetland ecosystems
- using natural features such as biofiltration and permeable surfaces to improve water quality.
Properly managed water sensitive urban design aims to develop clean stormwater infrastructure and a functioning urban ecosystem. Implementing such design helps to retain wildlife corridors and benefit soil and water health.
National Soil Strategy
The Australian Government’s National Soil Strategy, released in May 2021, sets out how Australia will manage and improve its soil over the next 20 years.
The National Soil Action Plan 2023–2028 sits under the strategy. The NSW Department of Primary Industries will work with other NSW agencies on actions to:
- use innovation and the latest science to improve soil health
- improve knowledge of sustainable soils and good soil management.
Fire and soil health
Following the 2020 NSW Bushfire Inquiry, the National Parks and Wildlife Service is investigating the effects of ‘cooler’ fires - hazard reduction burns and cultural burns - on soil health. The project will report on:
- the effects of hazard reduction burns on 21 sites in NSW national parks and reserves
- soil properties before and after hazard reduction burns.
The Applied Bushfire Science Program is addressing key recommendations from the 2020 NSW Bushfire Inquiry relating to ecosystems, recognition of Aboriginal cultural knowledge and impacts of fire on Aboriginal cultural values.
As part of the program, the NSW Department of Climate Change, Energy, the Environment and Water (DCCEEW) is establishing a long-term monitoring network in south-eastern NSW. Sites will be monitored for several factors, including soil health before and after bushfires, hazard reduction burns and cultural burns.
DCCEEW and LLS are also working with Aboriginal knowledge holders to understand fire impacts on cultural values and empower Aboriginal peoples' input to the fire planning process.
Additional responses
Other responses for managing and improving soil condition are as follows.
- The National Committee on Soil and Terrain advises on soil and land assessment standards and policy. The committee has published national protocols for monitoring soil acidification and soil organic carbon.
- The NSW Community DustWatch program has been monitoring the extent and magnitude of dust pollution across NSW for the past 13 years.
- NSW Government agencies lead the national assessment of wind erosion and the use of remote-sensing to assess the extent of groundcover.
- The Department of Primary Industries and Regional Development soil research and development program develops, assesses and promotes technologies and management systems that improve soil quality and protect it from degradation.
- The NSW Natural Resources Commission has identified baselines, drivers and trends for soil stability and health in forest catchments across the NSW Regional Forest Agreement areas.
- The Department of Primary Industries and Regional Development provides an information series on microbes, nematodes, bacteria and fungi for landholders who wish to enrich soil nutrients for natural ecosystems or agriculture.
- Local Land Services have provided a fungi guide for landholders in the Central Tablelands and Central West regions, with 96 species from hundreds, possibly thousands, that grow in the diverse habitats of these regions.
Pest animals and weeds
National Parks and Wildlife Service is responsible for managing national parks and nature reserves for the protection and conservation of biodiversity in NSW. This includes the control of pest animals and weeds that affect soils within national parks. The Australian Government’s Australian Pest Management Strategy 2017–2027 outlines measures for controlling invasive species while considering both environmental and cultural factors.
See the and topics for more information.
Future opportunities
Modelling of soil condition in NSW
Further and systematic monitoring of soil condition would improve our understanding of current condition and change in NSW landscapes and soils and also improve the ability to anticipate or react to developing issues caused by changes in environmental conditions or alterations in land management practice.
The adoption of a universally agreed definition of soil health has had limited success (). Across NSW there is no consistent monitoring of physical, chemical and biological factors that relate to soil health, apart from the federal government’s National Soil Action Plan.
Recent localised studies have highlighted the value of:
- native tree planting (specifically Acacia pendula and Eucalyptus camaldulensis) to increase soil microbial activity and nutrient content, particularly in the upper soil layers and under the tree canopy ()
- fungi and bacteria in breaking down complex, resistant carbon sources like ryegrass litter, especially during drought ().
Landscape Function Analysis
Landscape Function Analysis can be a useful tool for assessing and monitoring the health and functionality of landscapes, especially in arid and semi-arid environments (). This method focuses on evaluating essential ecological functions of landscapes, such as capturing and retaining resources like water and nutrients. The analysis can be useful to assess effectiveness of land management practices and to develop strategies to enhance ecosystem resilience.
Soil ecosystems
Soil microbial ecosystems are key in maintaining soil health as well as dependant ecosystems, such as fauna and flora. Therefore, quantifying the importance of these interactions and developing metrics that include microbial communities and functions in setting soil and biodiversity indicators for the state of environment reporting will be key in the future. Potential for impacts of existing contaminants from industrial, urban and pesticide use in considering soil ecosystem health are also key to ensure soil and health and resilience is maintained.
Fungi
Australia's unique environmental conditions and ancient soils offer a promising opportunity to enhance our understanding of soil fungi including symbiotic mycorrhizal fungi, which play crucial roles in plant nutrient uptake, soil health and ecosystem functions ().
Despite their global significance and presence across diverse ecosystems, Australian fungal ecology is poorly understood, particularly biogeographical distribution and adaptation to local conditions. Understanding soil fungi, and the soil microbiome is essential for improving conservation, restoration and sustainable agricultural practices in the face of environmental changes.
Acid sulfate soils
There are opportunities to explore this area further. Improved mapping techniques, including remote sensing methods such as LiDAR (Light Detection and Ranging), will improve our understanding of acid sulfate soil extent.
Additional research on acid sulfate soils could focus on the impacts of extreme drought and subsequent rewetting on soil acidification and sulfuric material formation (). The Millennium Drought (2007–10) in the Lower Murray River demonstrated how deep oxidation of sulfides and formation of acid sulfate soils occurred in both irrigated areas and natural wetlands.
Understanding how water table management, such as through irrigation and drainage, affects the development of deep sulfuric materials and their persistence can help in developing strategies to mitigate long-term soil degradation and manage water resources more effectively.