Summary
While most soils are in a moderate condition, some parts of the State have suffered a greater decline in condition than others and display a significant loss in their ability to deliver ecosystem services.
Much of the change in soil condition has occurred over longer timeframes, largely reflecting historical losses due to the lack of knowledge earlier about managing soils sustainably in Australian conditions.
More recently, the increasing intensity of land use, climate variability and extreme weather events are greater risk factors in maintaining soil condition.
On a statewide level, the increasing acidification of agricultural soils due to the intensification of land use continues to be the land degradation issue that contributes most to ongoing declines in soil condition and productivity across NSW.
Other factors such as decline in soil organic carbon, salinisation and loss of topsoil due to hillslope and wind erosion are still of concern, but appear to be stable or decreasing in impact.
New conservation farming practices, such as maintenance of groundcover vegetation and reduced tillage, have helped to control erosion and maintain soil condition. The extent to which these practices improve the management of organic carbon levels and prevent acidification is less clear.
Related topics: Climate Change | Native Vegetation
NSW indicators
| Indicator and status | Environmental trend |
Information reliability |
|
|---|---|---|---|
| Soil pH (acidification) |
|
Getting worse | ✔✔ |
| Organic carbon |
|
Stable | ✔✔ |
| Hillslope erosion |
|
Getting better | ✔✔ |
| Wind erosion |
|
Getting better | ✔✔ |
| Salinisation |
|
Stable | ✔✔ |
Notes:
Terms and symbols used above are defined in How to use the report.
Context
Soils make a significant contribution to the economic prosperity and ecological integrity of the NSW environment. Healthy soils deliver essential ecosystem services, including:
- nutrient transformation and cycling
- water infiltration and filtering
- climate regulation through carbon storage and cycling
- providing habitat for biota
- supporting natural ecosystems and
- enabling farming for food and resources.
Soil is essentially a non-renewable resource, as its formation is an extremely slow process that is beyond human timeframes (Bui et al. 2010; DOA 2014; Stockmann et al. 2014). Therefore, to maintain productivity and ecosystem services, soils must be managed sustainably to prevent them becoming degraded.
The consequences of most types of soil degradation, such as soil loss from accelerated erosion, dryland salinity and subsoil acidity, are long-term and often irreversible, or, and costly to reverse. While some other forms of degradation, such as nutrient decline and surface soil acidification may be remediated if addressed early, restoration is often expensive (Lockwood et al. 2003). Applying best management practices can prevent or even reverse some lesser degradation processes in rural production landscapes.
Status and Trends
Introduction
This topic describes changes in soil condition that have occurred over the past 10–15 years. It refers to six characteristics of soil condition that provide a useful description of the status and trends in soil health and land management across NSW. These soil characteristics are:
- soil pH, particularly acidification, (the lower the pH of the soil, the higher its acidity)
- soil organic carbon (SOC)
- hillslope erosion
- wind erosion
- salinisation
- acid sulfate soils (ASS).
There is a close relationship between the characteristics of soil condition and the degradation processes that result in a decline in soil ecosystem services and damage to the broader environment, as described in Table 10.1.
Table 10.1: Characteristics of soil condition and associated processes causing land degradation
| Soil characteristic | Degradation process | Characteristics of the degradation processes |
|---|---|---|
| Soil pH | Acidification | Soil pH is an important chemical characteristic of soil health. Most plants and crops grow best in soils that are slightly acidic to slightly alkaline. Both strongly acidic and strongly alkaline conditions affect plant growth, but acidification is the main process of soil degradation. Acidification is generally caused by intensified land management with the associated leaching of soil nutrients and the use of acidifying nitrogen-based fertilisers. |
| Soil organic carbon | Loss of organic carbon | The level of organic carbon is an important determinant of soil biological health, that promotes recycling of soil nutrients and improves soil structure. A decline in organic carbon in soils is generally due to vegetation clearing and changes in land management, leading to reduced replenishment of organic matter and greater losses to the atmosphere. |
| Hillslope erosion | Loss of topsoil | Topsoil is the soil layer that supports most plant growth as it contains most of the nutrients and organic matter. Its structure supports root development, and the uptake of nutrients and water. Removing the topsoil harms the health of vegetation and encourages erosion. Hillslope erosion, including sheet and rill erosion, is caused by rain splash and diffuse water flows during heavy rain, with soils and their nutrients flowing into waterways, where they affect water quality and aquatic ecosystems. |
| Wind erosion | Loss of topsoil | Wind erosion is caused by strong winds in dry conditions. Many soils have eroded in the past to the extent that the loss of topsoil has substantially impacted on productivity. Some of these areas are recovering naturally, but others require active reclamation. Wind erosion is a serious threat when soils are bare, or the groundcover falls below 50%. Reduction in groundcover is caused by poor growing conditions, clearing, overgrazing, cultivation or burning. |
| Soil salinity | Salinisation | Soil salinity is the accumulation of salt on or near the ground surface due to rising water tables. It is caused by land use practices that alter the hydrological balance of the landscape such as vegetation clearing, poor drainage or excessive irrigation of crops or pastures, particularly with poor quality water. Soil salinity has impacts on land and surface water quality. An excessive level of salt in soil is detrimental to plant growth and ecosystem processes. |
| Acid sulfate soils | Acidic water contamination | Acid sulfate soils develop in aquatic and estuarine environments containing pyrites (iron sulfide). The exposure of pyrite to oxygen through activities such as drainage, excavation and dredging leads to the generation of sulfuric acid. The soils are also often highly saline. Thus, disturbance of these soils and the release of acid solutions can cause severe problems, including degradation or loss of aquatic ecosystems and adjoining vegetation, and corrosion of building foundations and underground services. |
The last consistent statewide assessment of soil condition and the extent of sustainable land management was carried out in 2008–09 through the NSW Monitoring, Evaluation and Reporting Strategy program. The final results of this assessment were reported in OEH (2014) and summarised in SoE 2015 (EPA 2015).
It found that soil condition in NSW was generally moderate. However, 74% of NSW was subject to at least one issue of some concern, with different regions associated with different soil condition issues. These outcomes demonstrated the need to manage soils sustainably, with land use practices appropriate for, and adapted to, specific sites.
The approach adopted in this report builds on the broad-scale information collected in the previous assessment (OEH 2014). Additional data has been derived from ongoing assessment programs, such as Community DustWatch, as well as satellite derived groundcover mapping and updated land use data.
Soil pH (acidification)
Naturally occurring acidic soils are widespread over much of NSW. Acidification induced by agricultural activity exacerbates natural soil acidity and can affect the productivity of soils. The level of soil pH (acidity) is measured as the decline in pH relative to the natural pH level. This is moderate on a statewide basis, but there are significant areas where soil pH is poor. There is a statewide trend towards increasing acidification, with associated implications for agriculture.
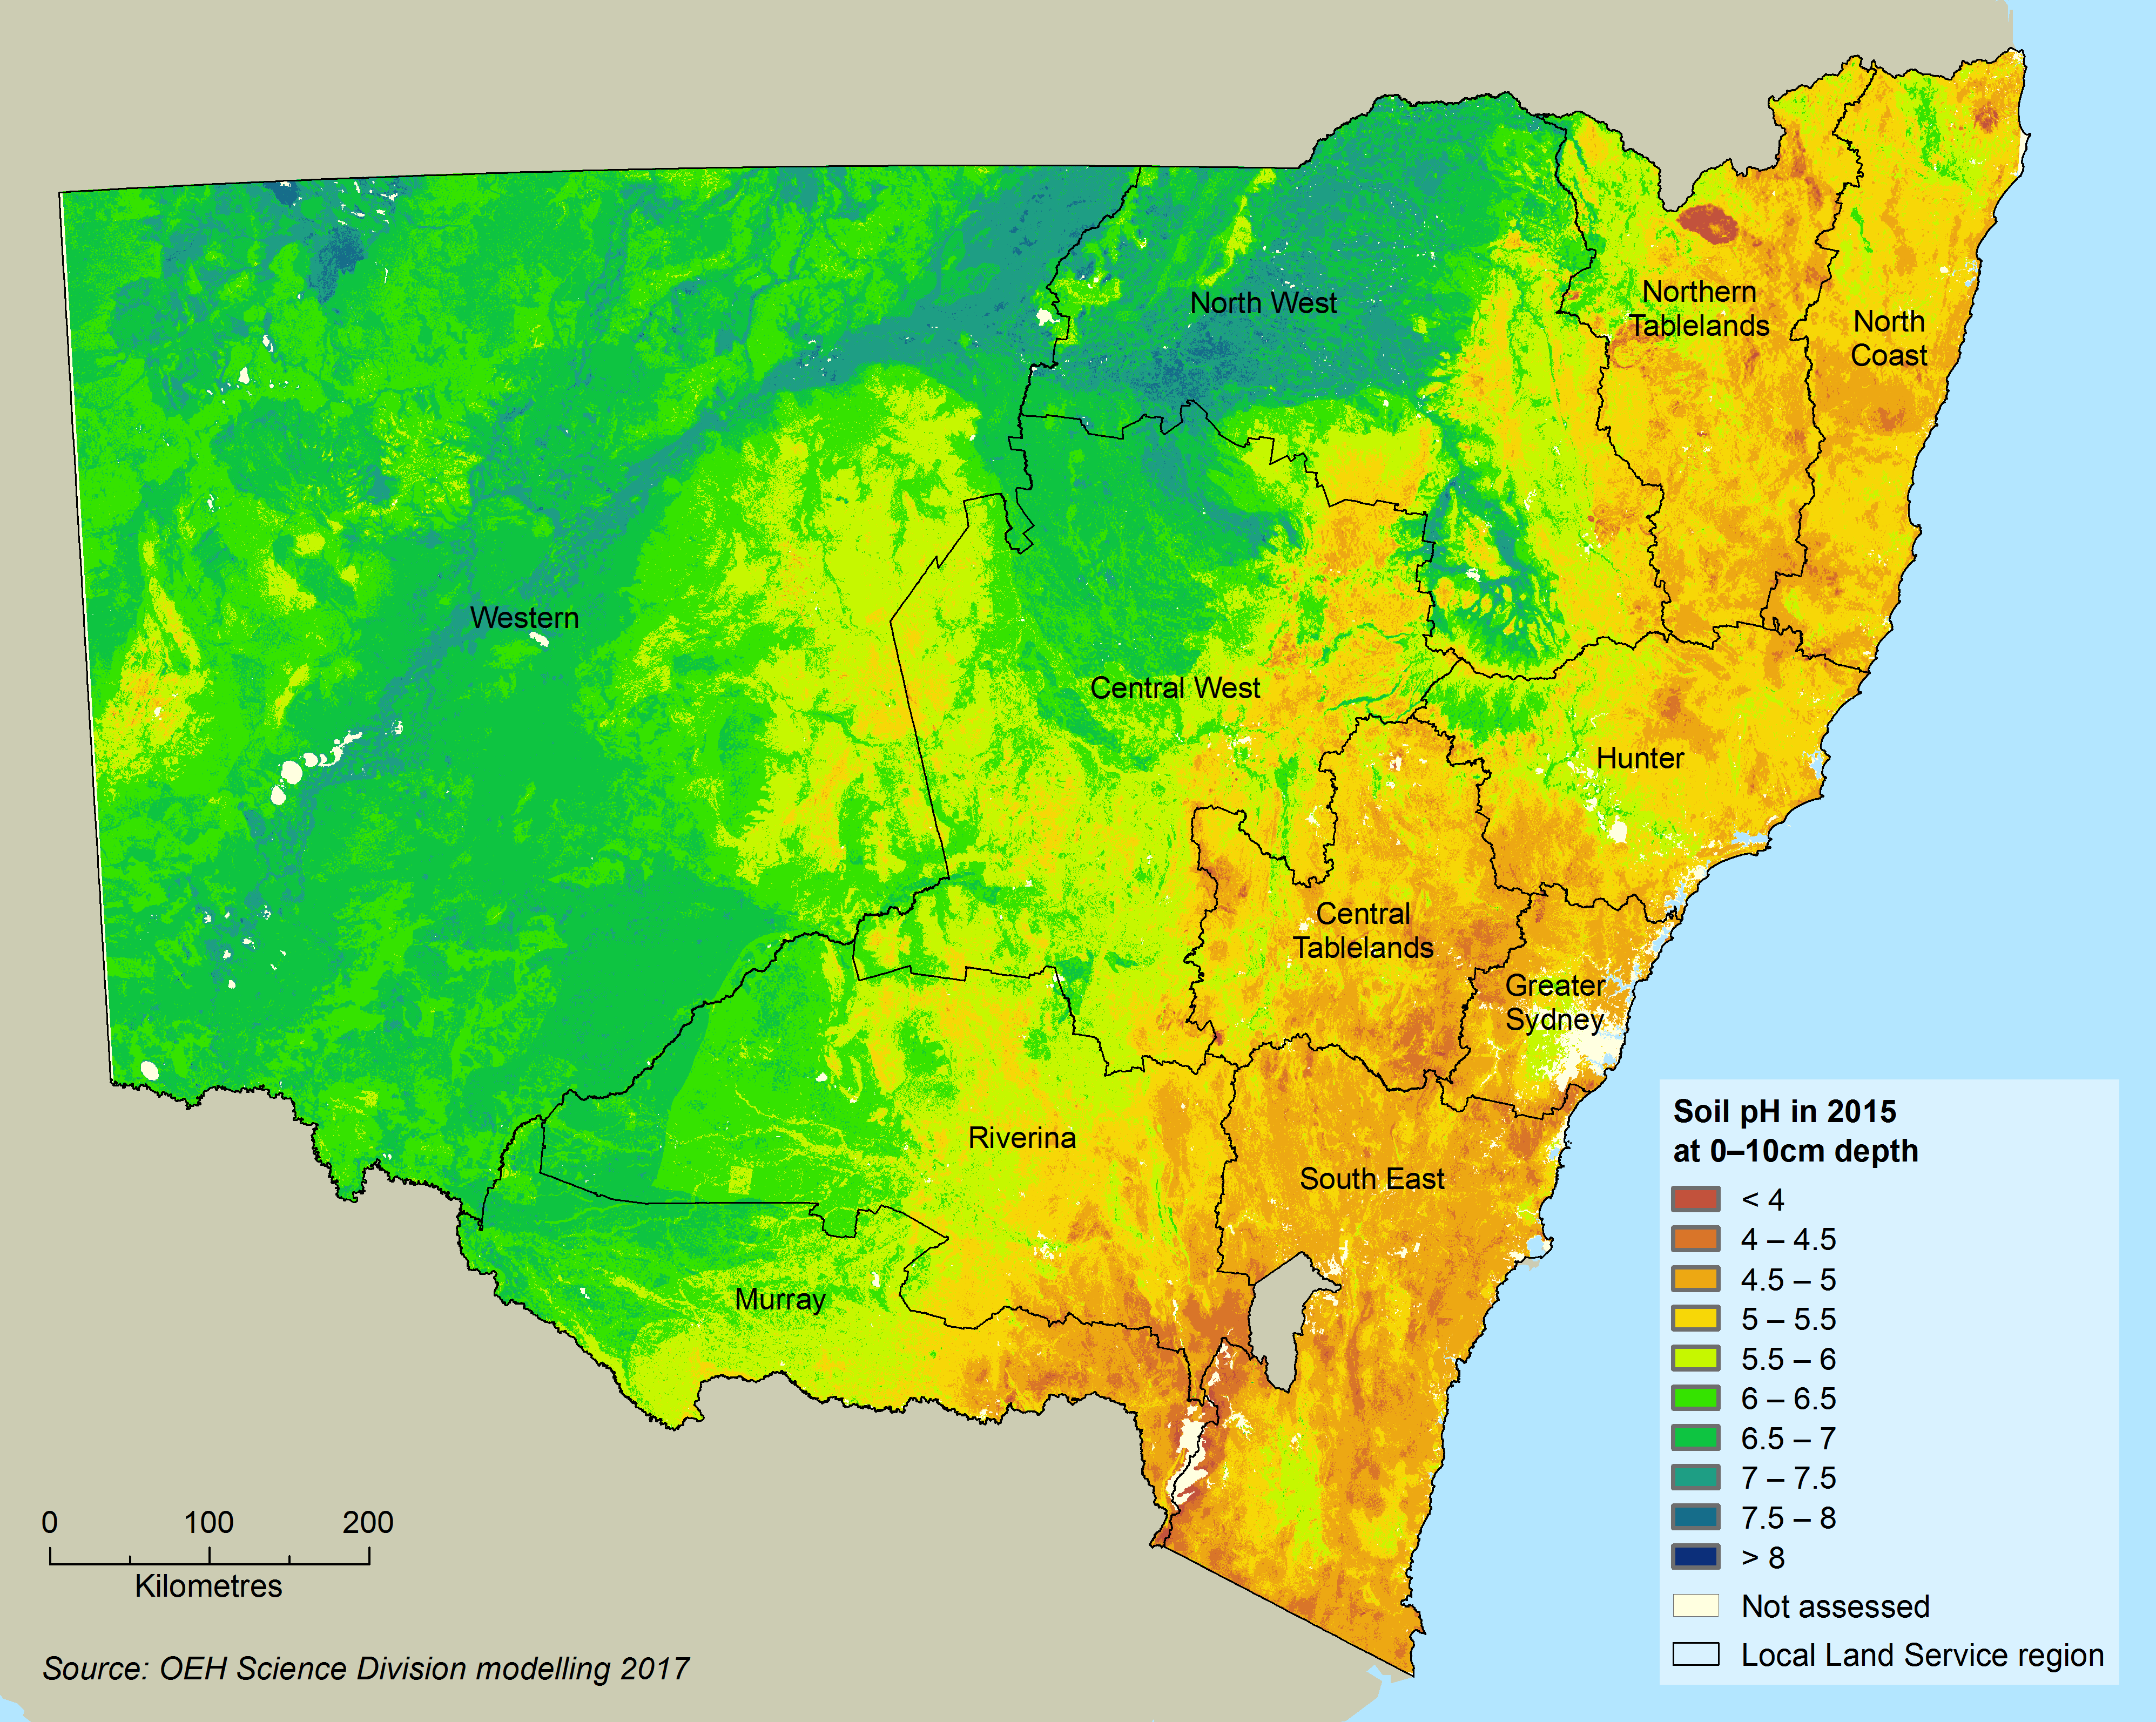
Current pH levels in the top 10 centimetres of soil are displayed in Map 10.1. These were derived from modelling using a similar methodology to that described in OEH (2017).
The map displays many areas of low pH (high acidity), particularly in the eastern and central tablelands regions, tending towards more alkaline conditions in the drier western regions of the State. Acidic conditions inhibit the growth of many agricultural crops, particularly when pH falls below 4.5 (Hazelton and Murphy 2007).
Map 10.1: pH levels in the top 10 centimetres of soils in NSW, 2017
The change in pH levels in the top 10 centimetres of soil over the past 10 years (2005–2015) was also modelled for all agricultural areas of NSW (i.e. all land excluding nature conservation reserves and production forests). This modelling incorporated changes in land use, groundcover and 40 years of climate data, but did not consider lime application due to lack of suitable data. The results are presented in Map 10.2.
The map reveals a weak overall trend to more acidic soils, particularly in southern NSW.
Map 10.2: Change in pH levels for the top 10 centimetres of soil for the period 2005–15 and areas of acidification risk
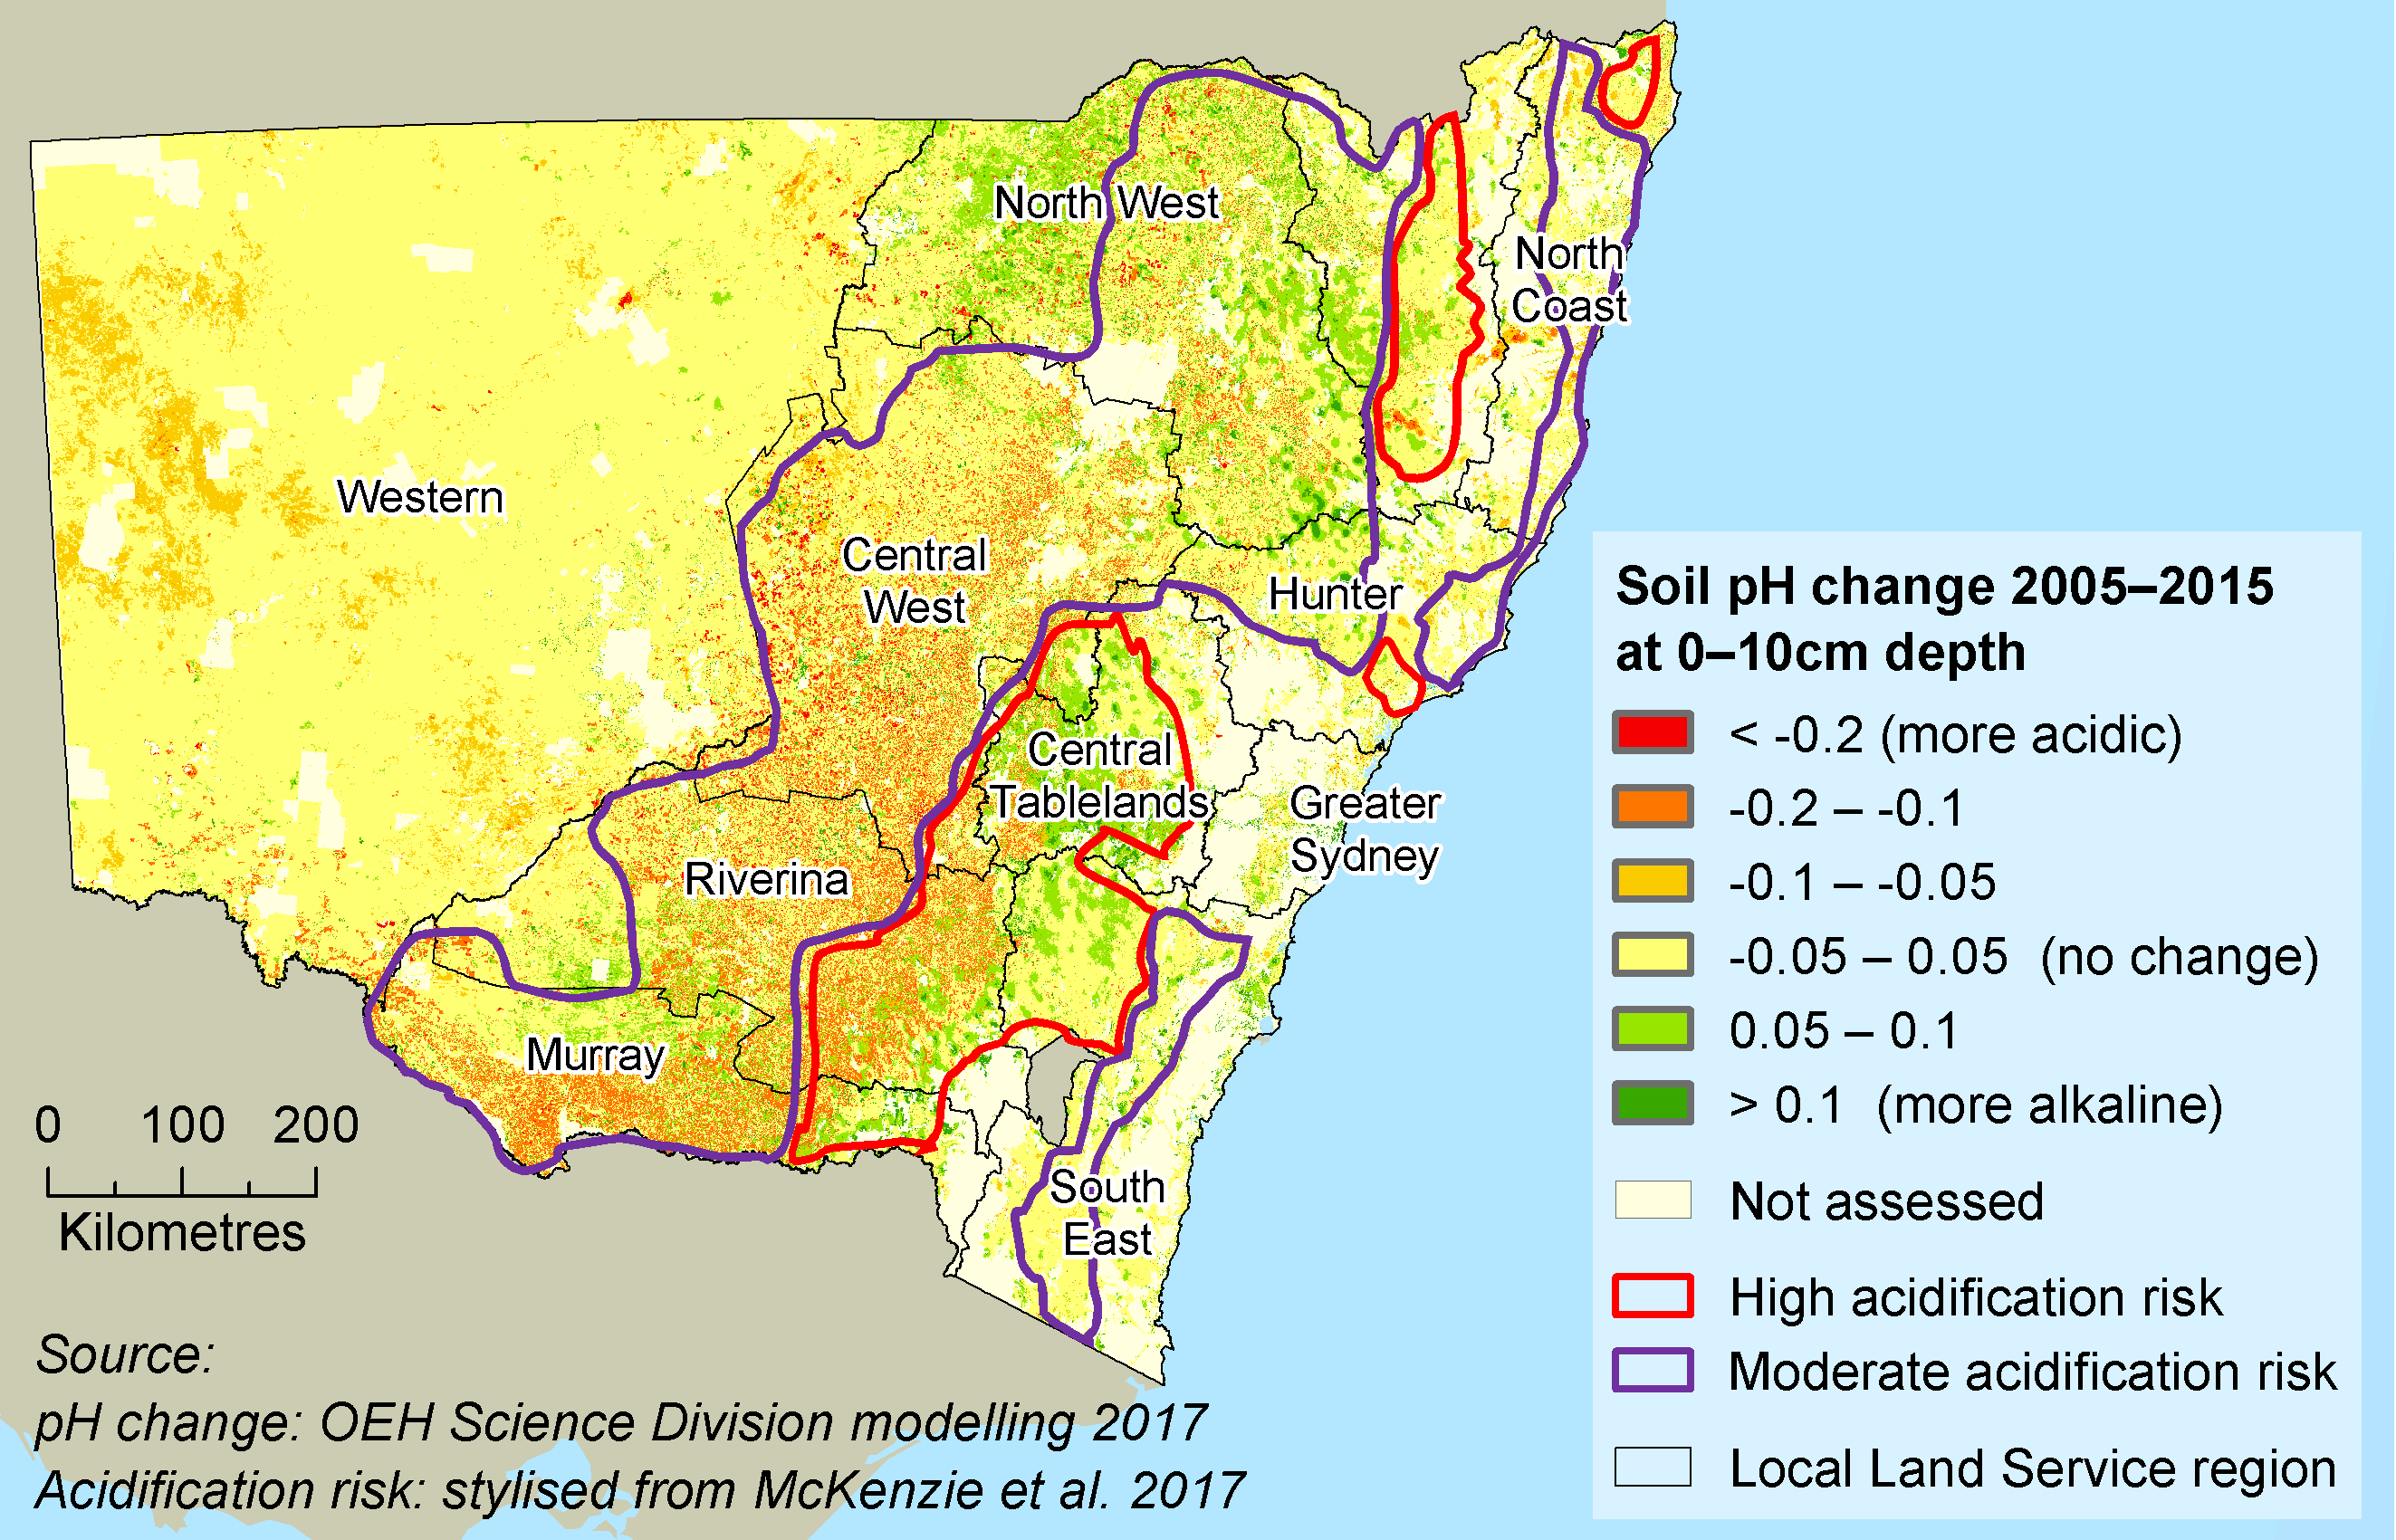
The modelling suggests that about 11% of the State’s agricultural land is becoming more acidic with declines of more than 0.05 pH units. The trend towards acidification is most evident in the Central West, Riverina and Murray Local Land Services (LLS) regions, with decreases in pH levels of as much as 0.2 pH units in many locations. Even minor declines in pH can harm crop and pasture growth, especially when pH levels are already critically low. This is particularly the case with acid sensitive crops and pastures.
Slight increases in pH levels leading to increased soil alkalinity of more than 0.05 pH units are also indicated in some central and northern regions, affecting about 6.9% of the State’s agricultural land.
Mean changes in pH levels for the top 10 and top 30 centimetres of soil are presented in Table 10.2 for all LLS regions in NSW. The highest average decline occurs in the Central West LLS region, with changes of -0.03 pH units in both soil depths.
Table 10.2: Recently modelled changes in mean pH levels, soil organic carbon and hillslope erosion by region
| LLS Region | pH level (0-10 cm) |
pH level (0-30 cm) |
Soil organic carbon - t/ha (0-30 cm) |
Hillslope erosion (% change) |
|---|---|---|---|---|
| Central Tablelands | 0.03 | 0.04 | -0.69 | -25.04 |
| Central West | -0.03 | -0.03 | 0.28 | 5.02 |
| Greater Sydney | 0.02 | 0.01 | 0.06 | -26.13 |
| Hunter | 0.01 | 0.00 | -0.19 | 21.10 |
| Murray | -0.01 | 0.01 | -0.41 | -39.54 |
| North Coast | -0.01 | -0.02 | 0.64 | -13.25 |
| North West | 0.02 | 0.03 | -0.61 | -17.99 |
| Northern Tablelands | 0.02 | 0.03 | -0.39 | -33.32 |
| Riverina | -0.02 | -0.01 | -0.10 | -38.08 |
| South East | 0.02 | 0.02 | -0.18 | -20.24 |
| Western | -0.01 | -0.02 | 0.60 | -32.48 |
| NSW | -0.01 | -0.01 | 0.14 | -13.51 |
Notes:
Changes in pH and soil organic carbon are over the period 2005–15.
Hillslope erosion percentage change is from 2015–17 relative to the average of the previous 15 years.
Negative figures for hillslope erosion describe reduced erosion levels.
The value for all NSW is not the simple average of the LLS regions, due to their differing areas.
The trend in pH change from 2005–2015 that is described above and shown in Map 10.2, should be considered in conjunction with data on current pH levels as shown in Map 10.1. Areas with very low pH coinciding with further declines in pH are locations of particular concern for acidification. McKenzie et al. (2017) mapped acidification risk, that is, the level of threat from further decreases in pH across Australia. Stylised areas of acidification risk in NSW as identified by McKenzie et al. 2017 are also displayed on Map 10.2. This analysis was based on current acidity, buffering capacity and land management pressures.
- approximately 20% of modified agricultural land (i.e. excluding rangelands) in the northern, central and southern tablelands and south-western slopes of NSW, was at high risk of serious acidification
- a further 60% of modified agricultural land was at medium risk
- seven of the 11 LLS regions had widespread acidification risk which threatens the long-term viability of agricultural businesses if left untreated.
The overlap between the areas of declining pH over the past 10 years, identified earlier, and high acidification risk, occurs over much of the Central West, Riverina and Murray LLS regions. The 2016 National SoE report (Metcalfe and Bui 2017), also reveals widespread areas across NSW with poor soil acidification, particularly in the agricultural lands of southern NSW.
Although slight when averaged across regions, the trend towards increasing acidity modelled throughout the NSW central agricultural belt over the past decade is especially a matter for management concern where those areas coincide with areas of high acidification risk.
The trend towards higher acidification associated with agriculture has been widely reported recently across NSW and Australia (Fenton and Helyar 2007; McKenzie et al. 2017).
The main reasons for increased acidification in soils used for agriculture are:
- an increase in the intensity of land use over the past 10 years, with more improved pastures and an expansion of cropping lands
- the greater removal of organic matter from the soil
- more use of nitrogenous fertilisers.
Organic carbon
The condition of soil organic carbon (SOC) content in soils across NSW is moderate, based on the extent of change in current stocks relative to natural (pre-European) stocks and the associated loss of soil quality and function. The trend for this indicator is broadly stable across NSW.
Table 10.2 displays the average levels of change in SOC by LLS region across NSW, with an overall increase of 0.14 tonnes per hectare.
Increasing SOC is associated with improved soil condition as it contributes to many desirable processes such as:
- high biological activity
- nutrient availability
- soil physical structure
- water-holding capacity and aeration (McKenzie & Dixon 2006; Baldock et al. 2012; Murphy 2015)
- offsetting atmospheric carbon levels and mitigating climate change (Wilson et al. 2011; Baldock et al. 2012).
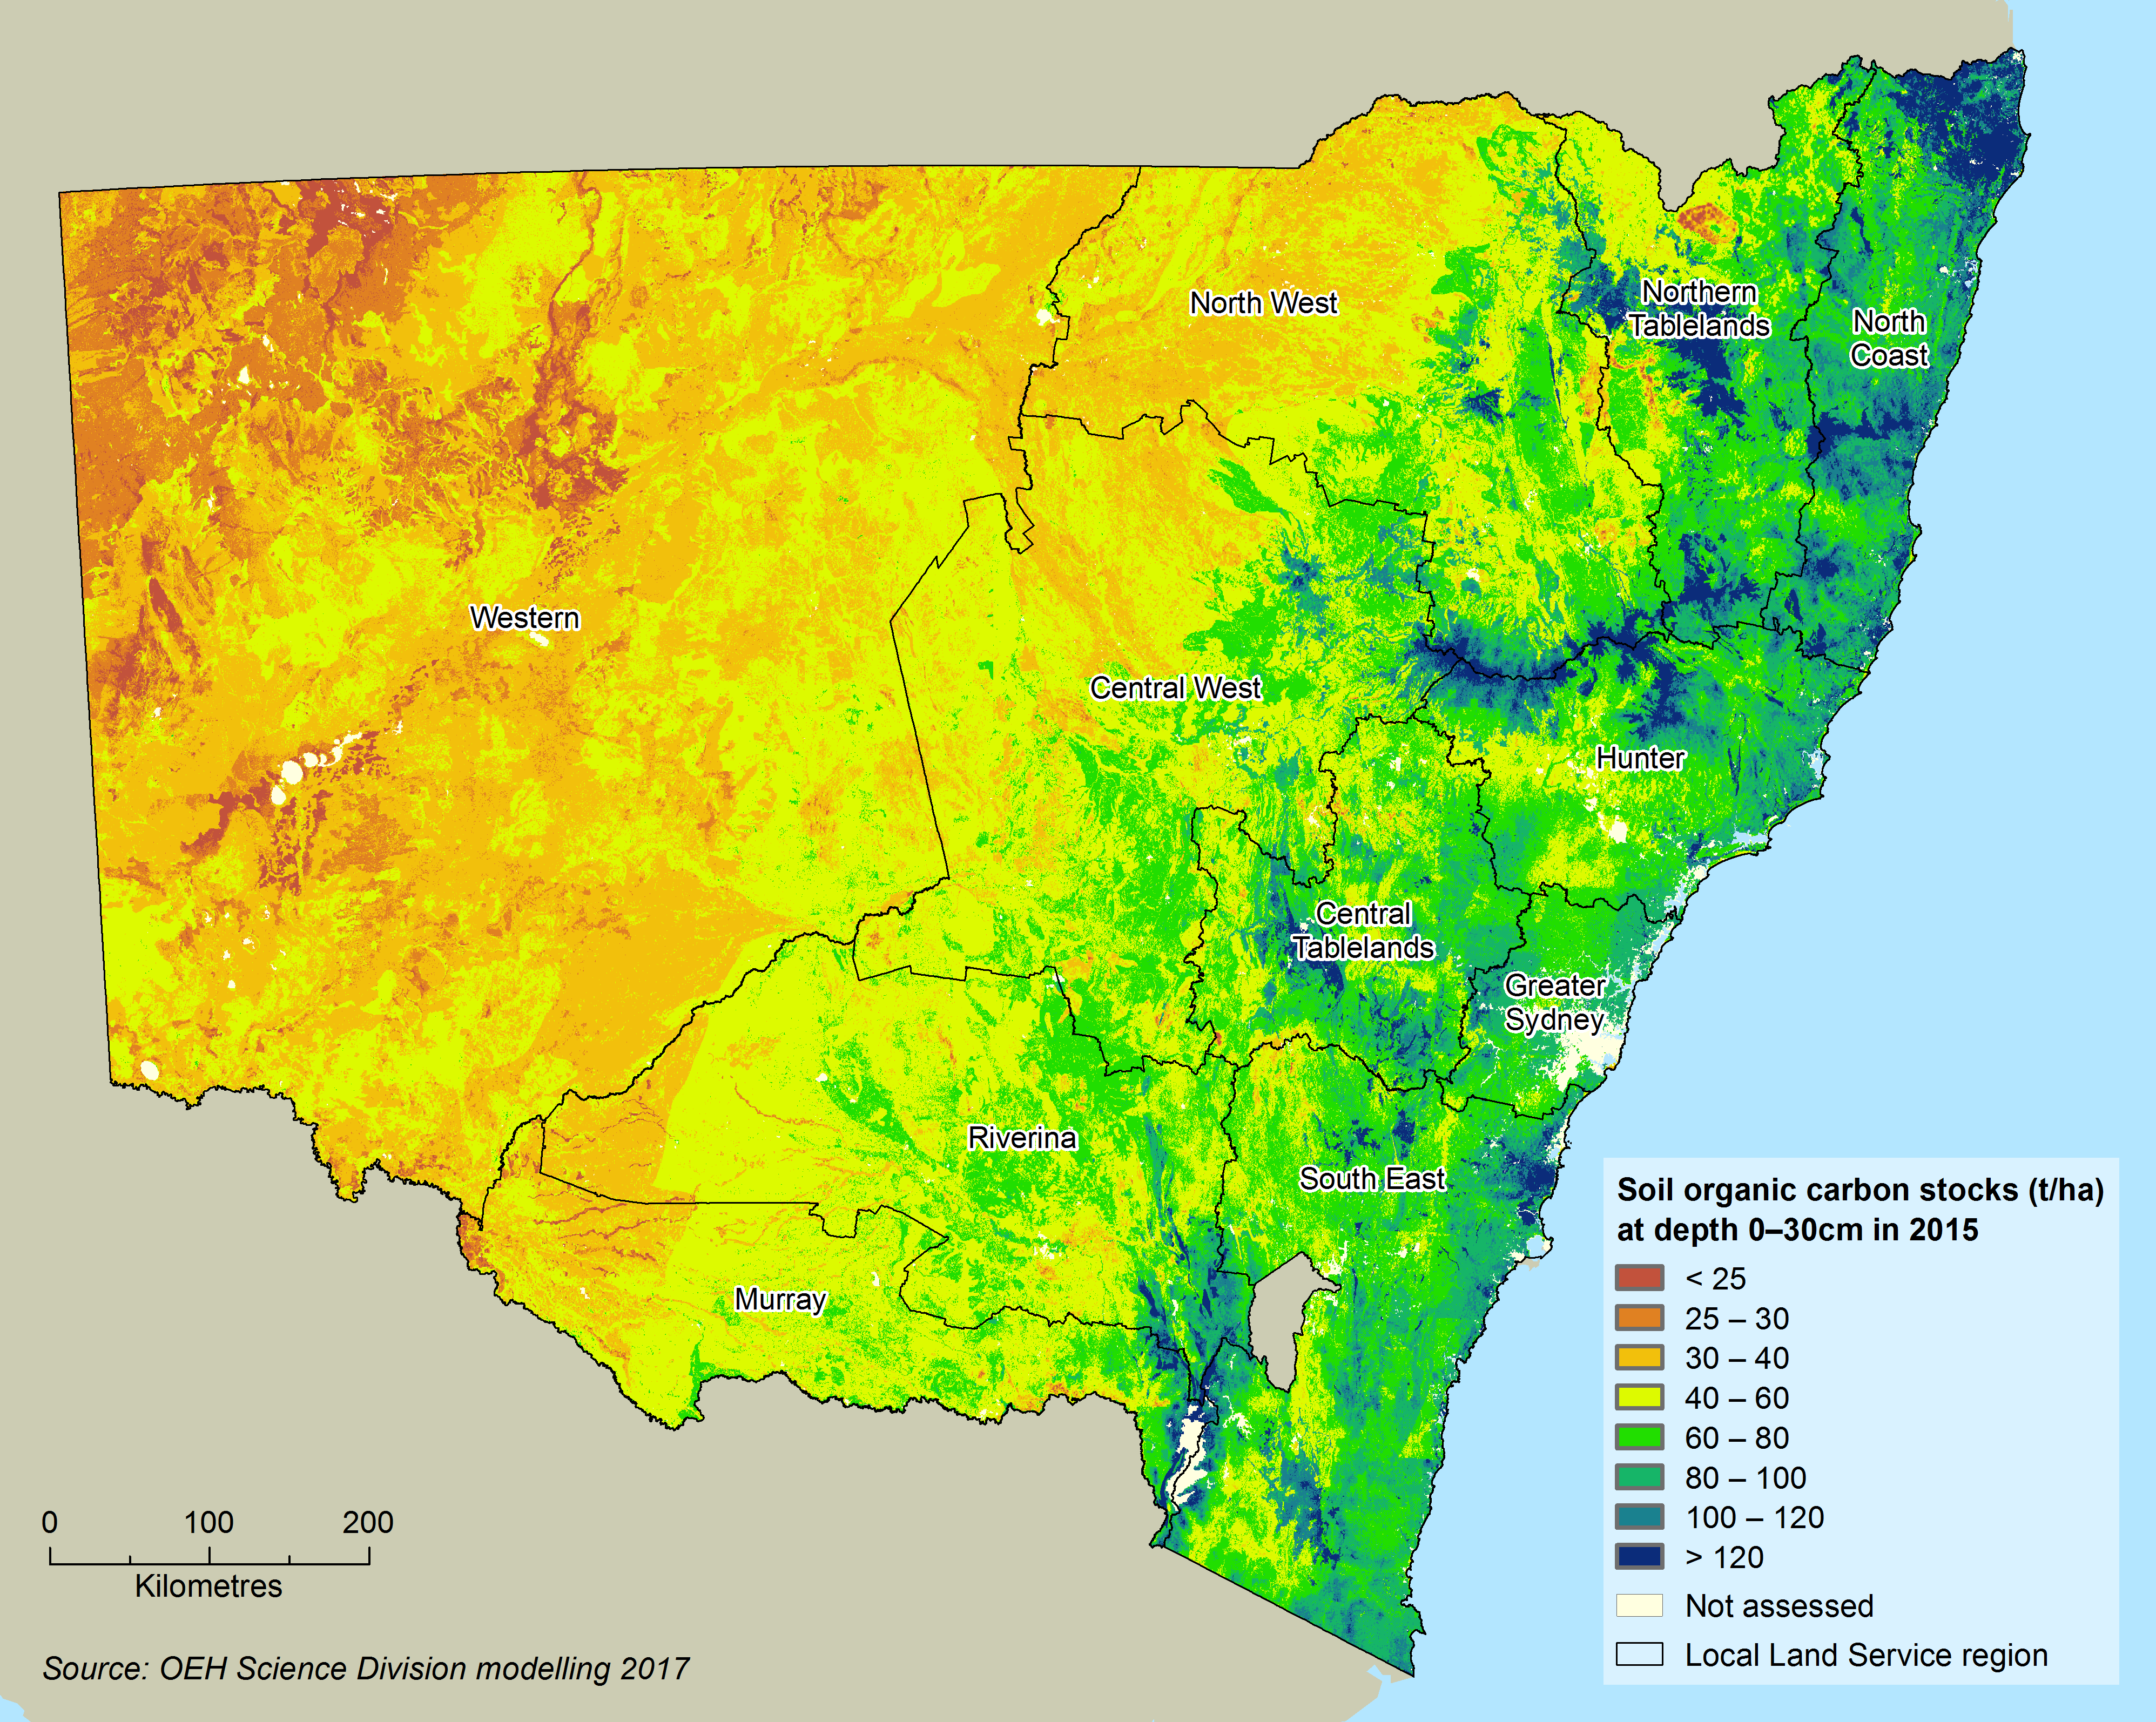
Current SOC stocks for the top 30 centimetres of soil across NSW were derived through spatial modelling of soils using the methodology described in OEH 2017. The results are displayed in Map 10.3. SOC stocks vary across NSW, with generally lower levels in western regions of the State, primarily due to the drier climate (Gray et al. 2015b).
Map 10.3: Soil organic carbon stocks for the top 30 centimetres of soil across NSW in 2017
The change in SOC levels over the 10 years 2005–15 was also derived through modelling based on data for changes in land use, groundcover and the past 40 years of climate data. The results are presented in Map 10.4.
Map 10.4: Change in NSW soil organic carbon stocks, 2005–15
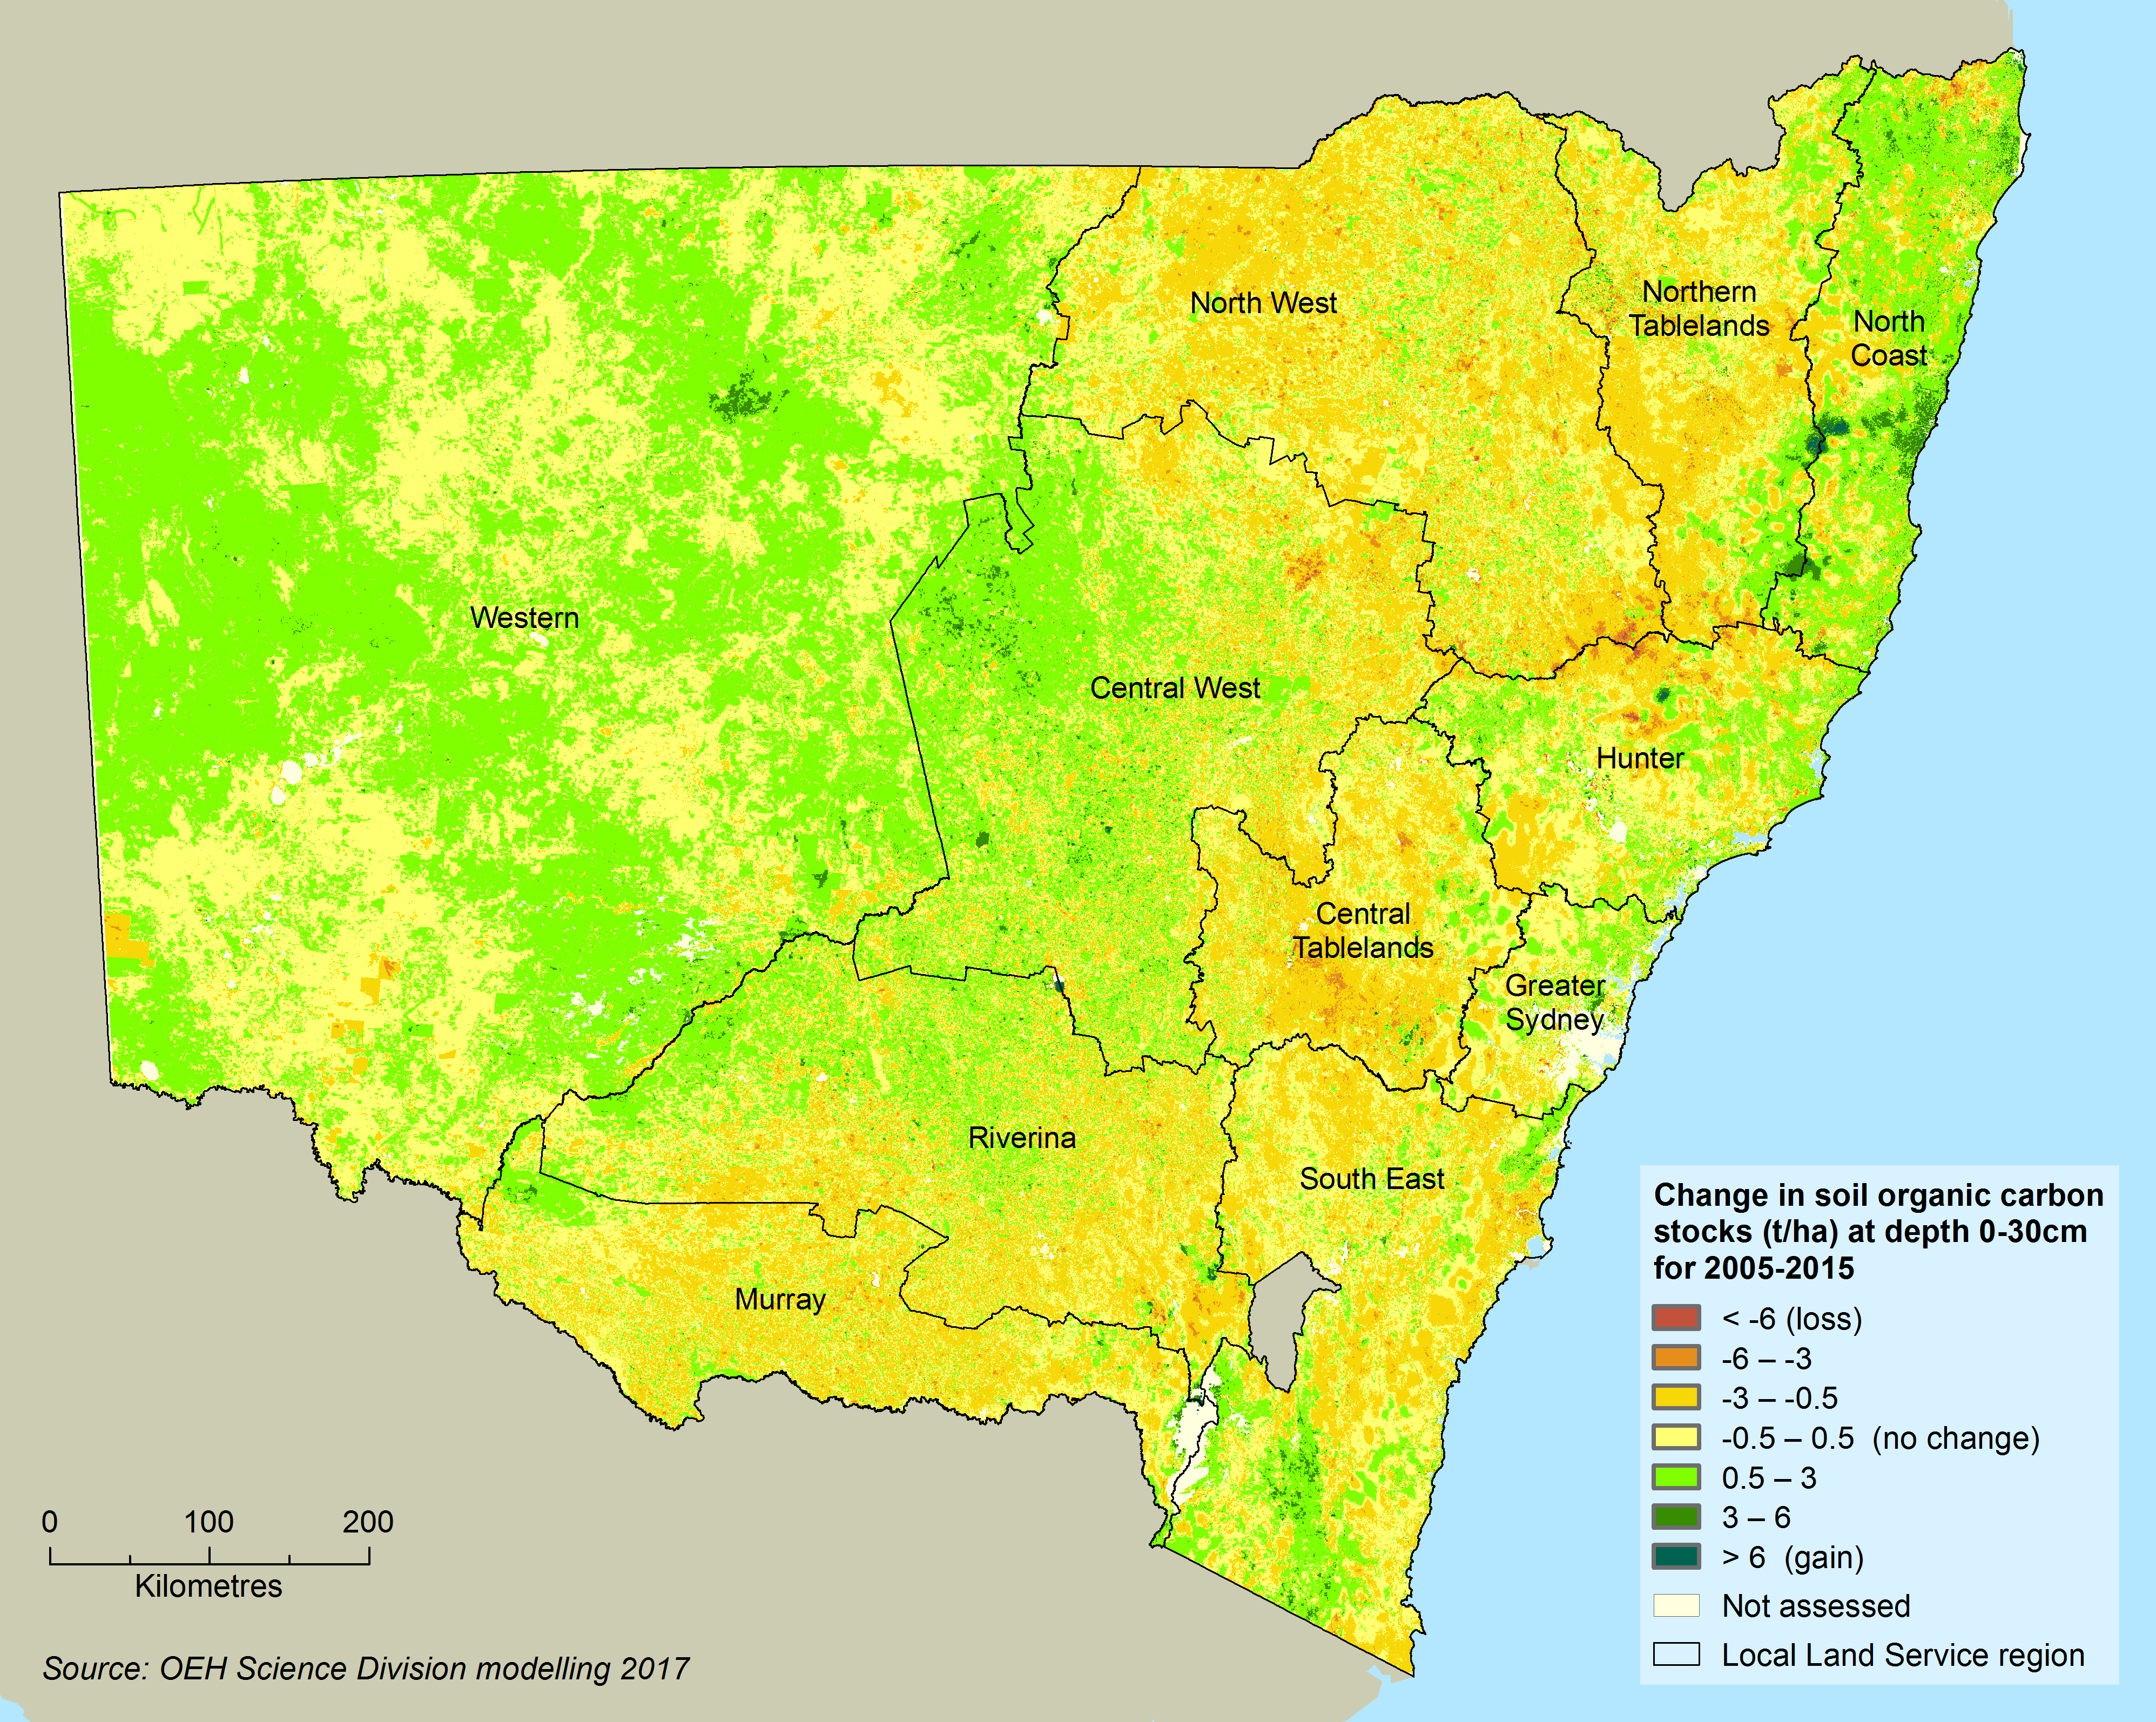
In Map 10.4 and Table 10.2, increases in SOC levels are shown in the Western, Central West and North Coast LLS regions, with increases of up 0.64 tonnes per hectare indicated for the North Coast region. The increase in much of the Central West and Western regions is attributed to improved land management practices, including increased levels of vegetative groundcover.
However, declines in SoC levels were identified for most other regions, with losses up to -0.7 tonnes per hectare in the Central Tablelands LLS region. At many specific locations, the gains or losses of SOC are three tonnes per hectare or more.
The modelled declines in SOC stocks over much of the State are consistent with declines since pre-European times that were recently modelled by Gray et al. (2015a). Those previous results suggest that 530 million tonnes of SOC, or 12.6% of the original stocks, have been lost from the top 30 centimetres of soils across NSW, since European settlement.
The extent of SOC decline is strongly affected by land use, with the greatest decline of 44.3 tonnes per hectare, or a 50% loss, occurring under regular cropping of high fertility clay soil in cool and moist conditions.
Under projected climate change scenarios, the greatest loss of SOC will also occur in cool, moist areas with native vegetation on high fertility clay soils, so these are the areas of highest potential when designing carbon sequestration programs.
Hillslope erosion
Historically, hillslope erosion has contributed to extensive soil loss and the associated decline in ecosystem function, but hillslope erosion has decreased across NSW due to improved land management. The condition of hillslope erosion is now moderate across the State, although some problem areas remain. The trend is towards further reduction of impacts on soil and land condition from hillslope erosion.
The average annual rate of hillslope erosion across NSW for the period 2000–14, was derived by modelling based on the Revised Universal Soil Loss Equation (Renard et al. 1997; Yang et al. 2017) and is shown in Map 10.5.
Map 10.5: Annual mean hillslope erosion 2000–14
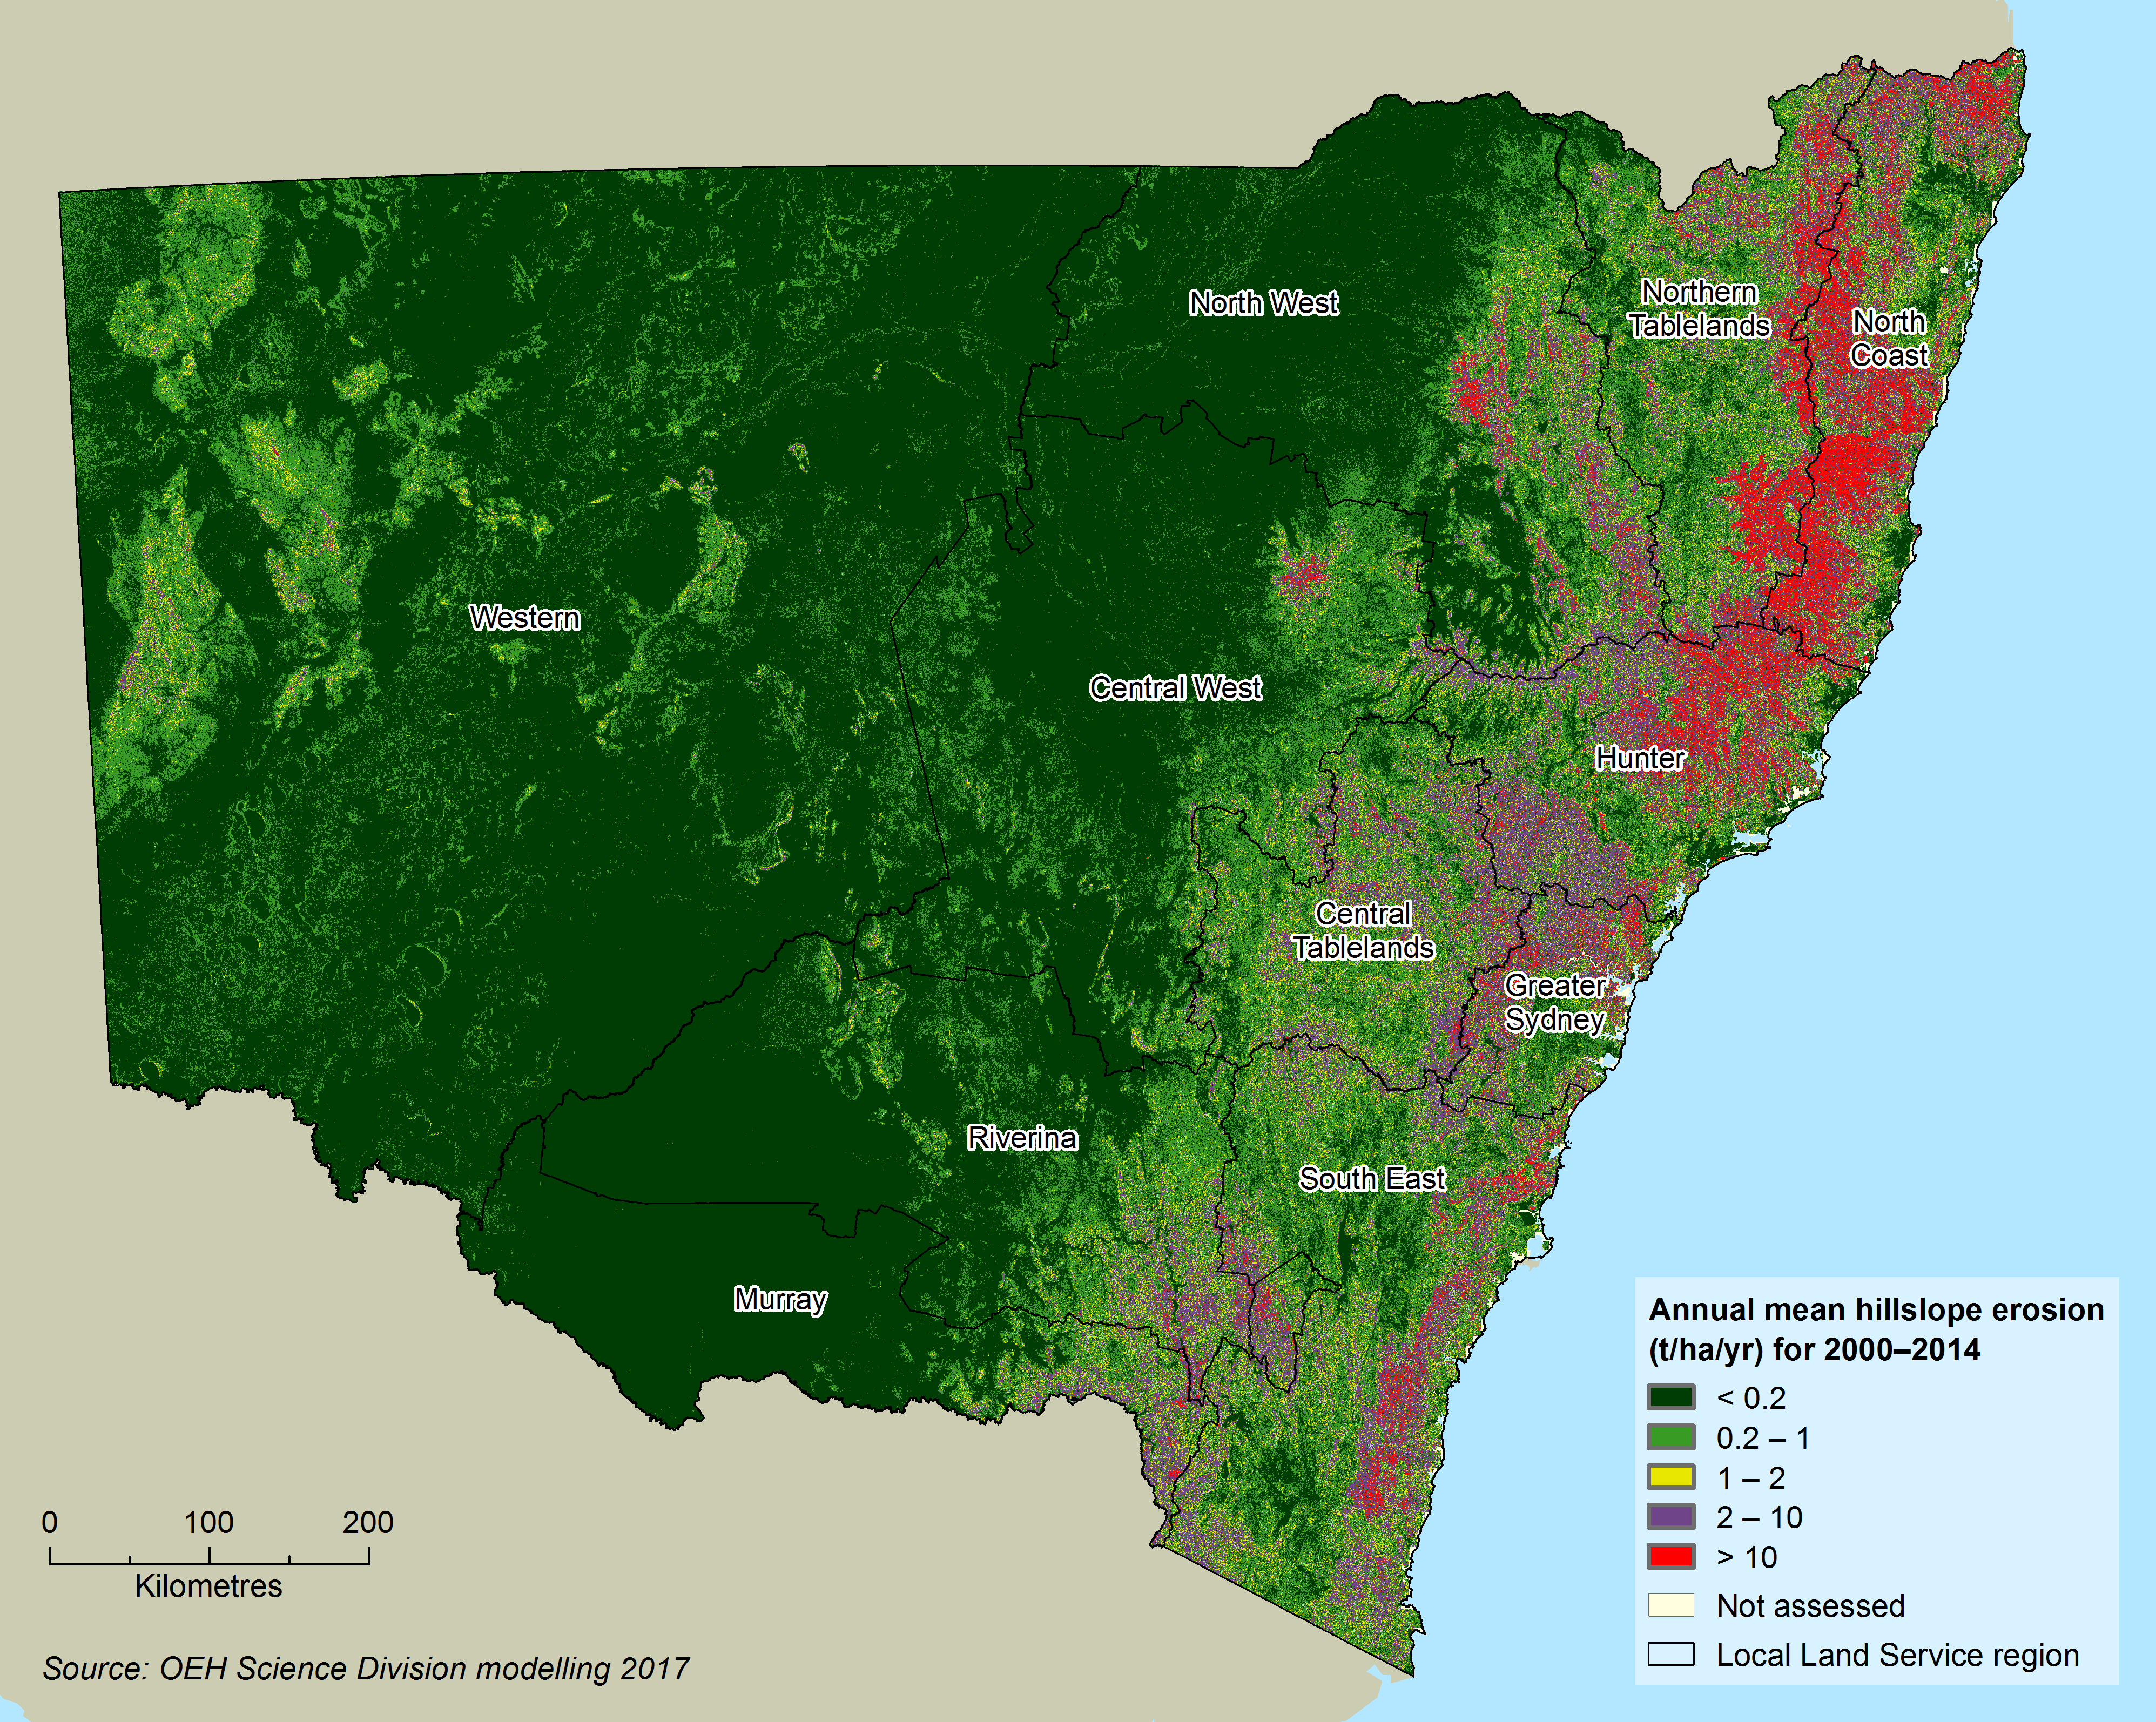
The areas of highest erosion are the North Coast, Hunter and Greater Sydney LLS regions. The Western region has the lowest levels due to its flat terrain. Erosion rates range from 0.12 tonnes per hectare per year in the Western region to 5.57 tonnes per hectare per year in the North Coast region, differing by a factor of 46.
The yearly averages for rates of hillslope erosion between 2000 and 2017 across NSW are presented in Figure 10.1, which shows:
- the average erosion rate for the three years 2015–17 was 0.73 tonnes per hectare per year
- the average hillslope erosion rate for the previous 15 years 2000–14 was 0.87 tonnes per hectare per year
- hillslope erosion over the past three years of data decreased by 16% compared to the average for the previous 15 years.
The reduction is largely due to a slight increase in the level of groundcover of about 3% and a moderate decrease in the intensity of erosive rainfall (about 21%) over 2015–17.
The percentage change by LLS region is shown in Table 10.2 above.
Figure 10.1: Hillslope erosion in NSW 2000–17
There is great variation in hillslope erosion rates between seasons, as well as years. Summer is the season with the lowest groundcover levels and highest rainfall erosivity, thus the highest hillslope erosion risk. Based on average monthly erosion rates between 2000 and 2017, the risk of hillslope erosion in February is about 10 times higher than in July. The variation in average annual hillslope erosion rates is 2.46 times.
Hillslope erosion also varies greatly according to land use. Hillslope erosion rates for different land uses in tonnes per hectare per year are:
- mining (19.29)
- horticulture (3.33)
- nature conservation (3.09)
- grazing modified pastures (0.73)
- grazing native vegetation (0.32)
- cropping (0.12)
- irrigated cropping (0.03).
Erosion rates can be explained by the associated groundcover and terrain factors. In nature conservation areas such as national parks, the relatively high rate is attributable to the steep ground parks often occupy and the impact of bushfires. The relatively low erosion rates in cropping areas are due to the flat terrain and effective erosion control through conservation farming techniques.
Wind erosion
Wind erosion, like hillslope erosion, has historically contributed to extensive soil loss and the decline of soil condition throughout NSW, primarily in the drier western regions. However, in recent decades rates of wind erosion have reduced due to improved land management practices. The condition of wind erosion is currently considered to be moderate to good across NSW. The current trend is for reducing impacts on soil and land condition from wind erosion.
Dust activity is an indicator of wind erosion. If there is dust in the air, the soil is being degraded in regions further up-wind. Dust activity (measured in hours), is defined by the number of hours per year when the average dust concentration is more than 25µg/m3. Monitoring data is available from the DustWatch Program which has 20 sites west of the Great Dividing Range, with 10 years of records.
Dust activity tends to be related to season, with summer having the highest levels of dust activity. For this reason, yearly wind erosion data is presented for the 12 months July to June.
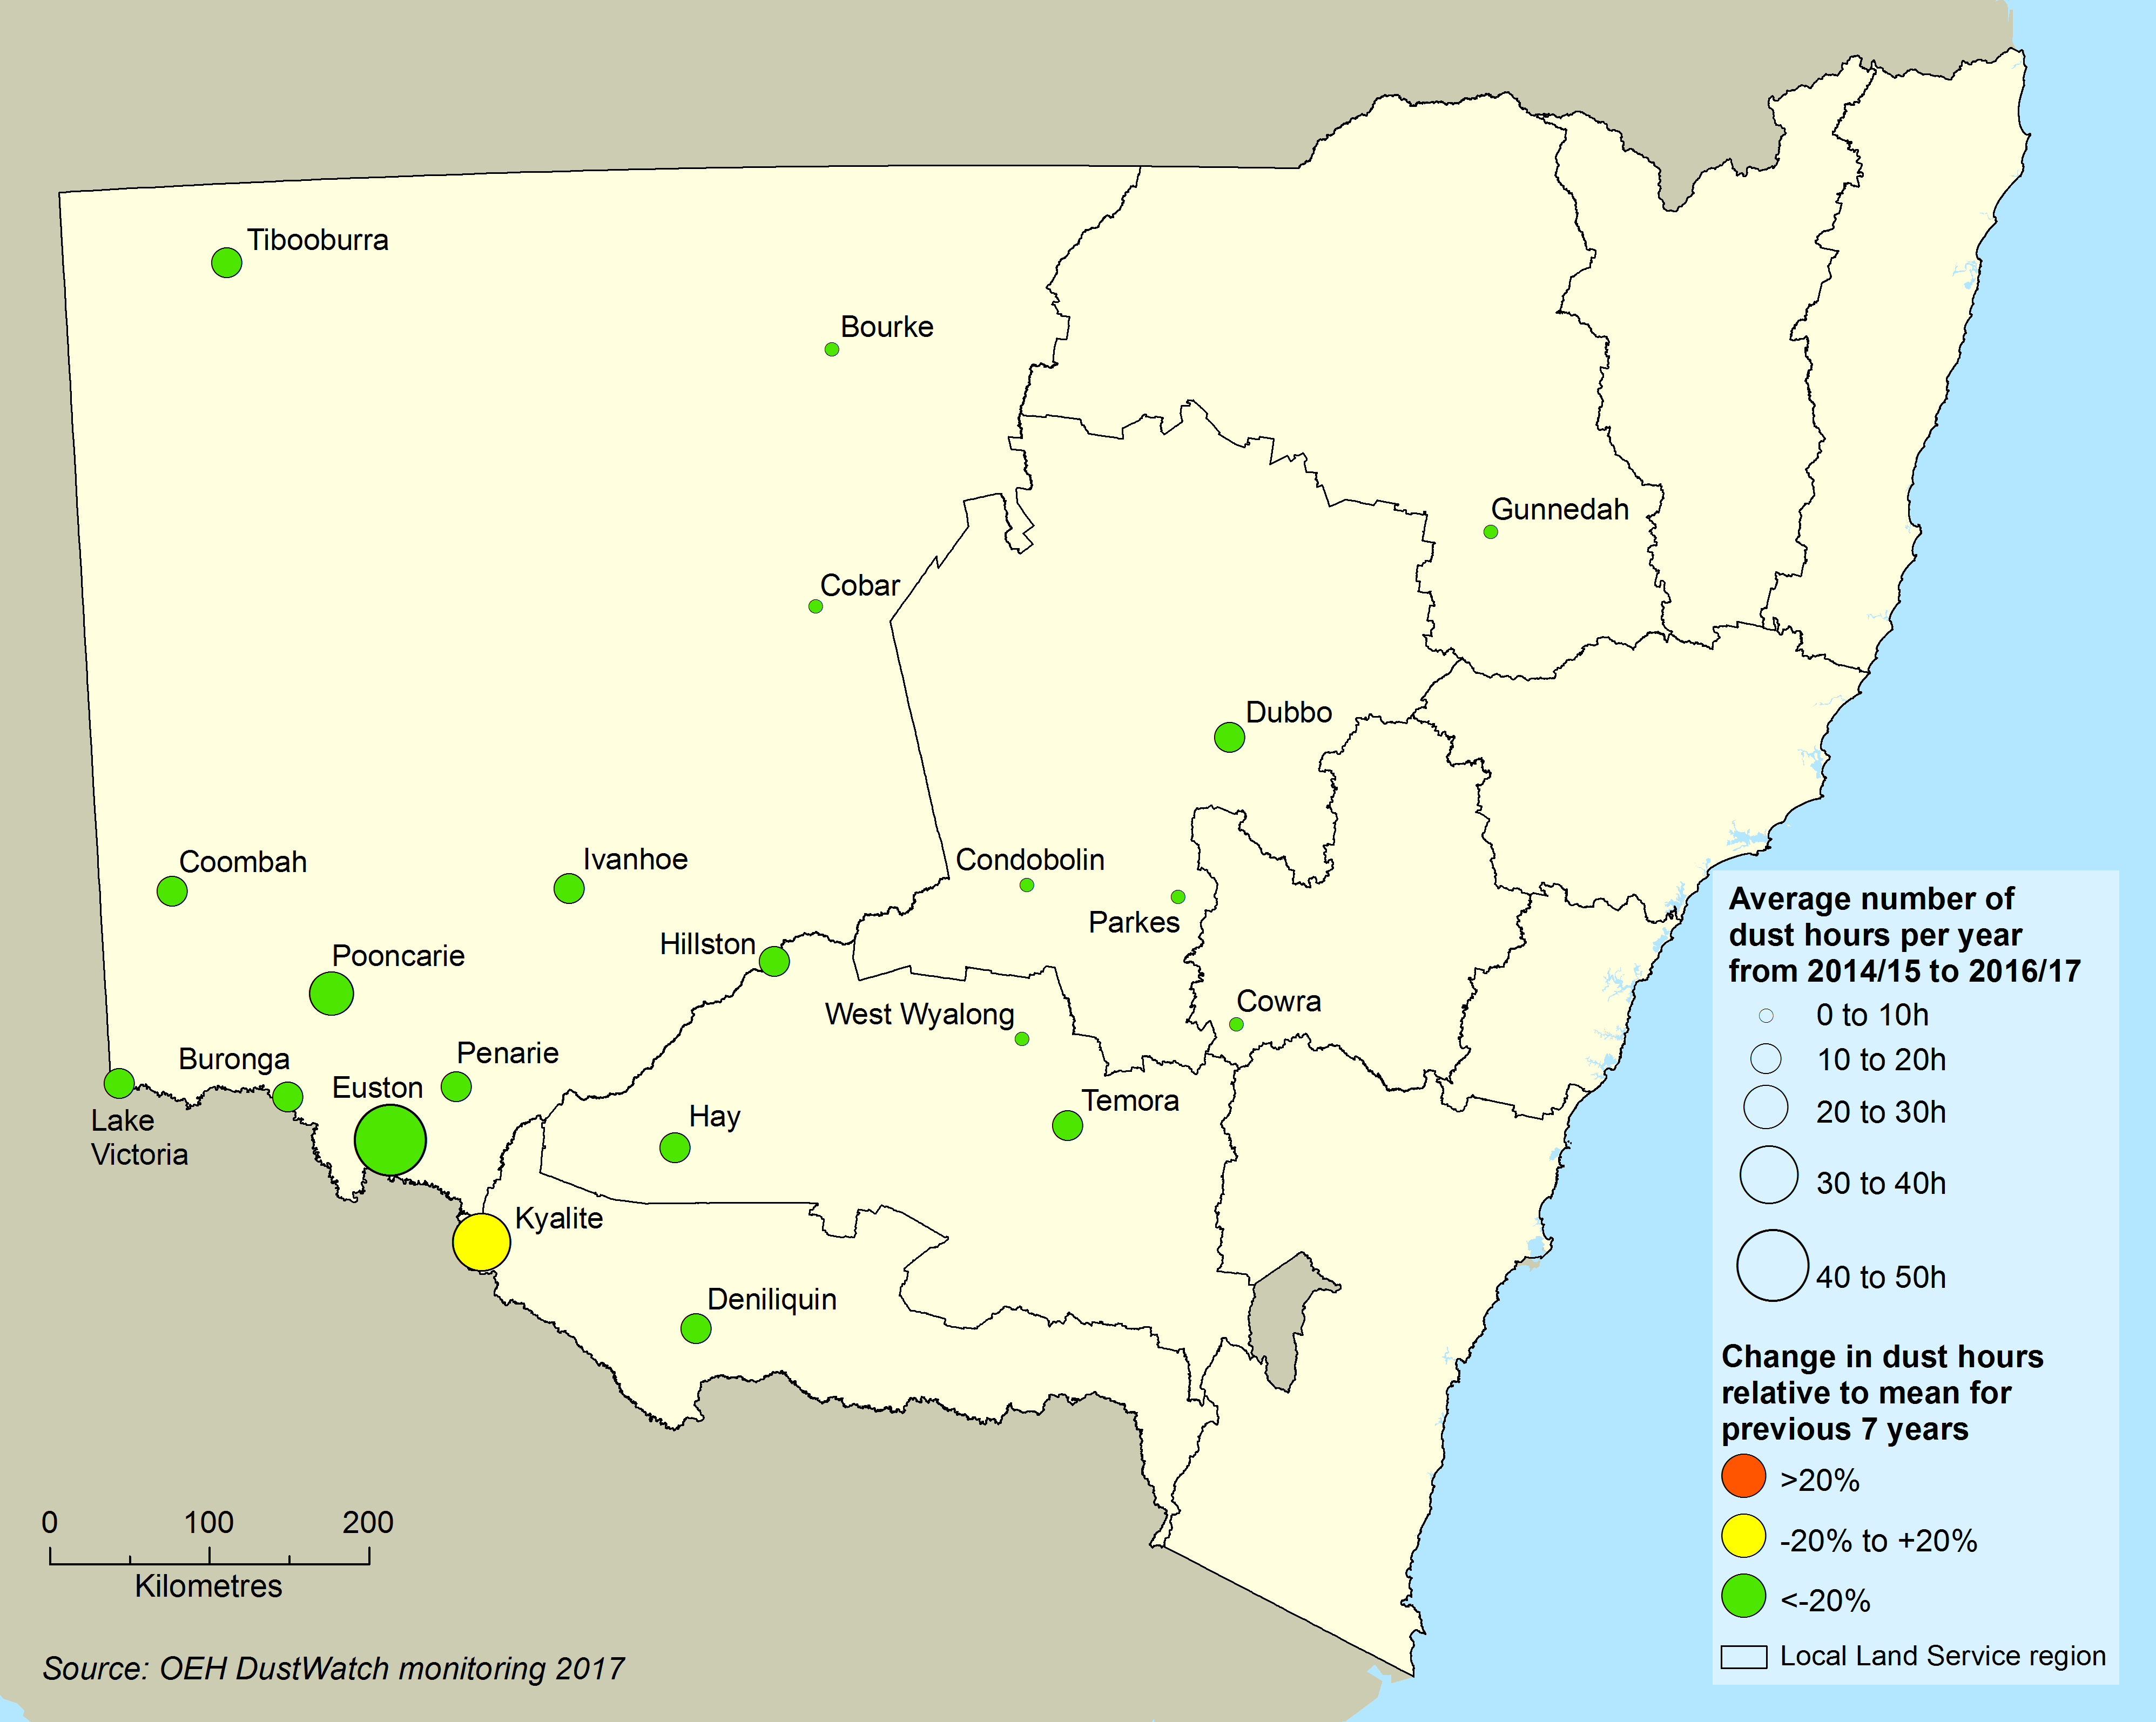
Map 10.6 displays the average number of dust hours per year (size of circle) for the three years 2014–15 to 2016–17. It also shows the change in dust hours (colour of circle) for those years, compared to the previous seven years (2007–08 to 2013–14).
Map 10.6: Status and change in the average number of dust hours for the three-year period from 2014–15 to 2016–17 compared to the 7-year mean (2007–08 to 2013–14)
Notes:
Status (size of circle) and trend (colour of circle) for change in the average number of dust hours per year between 2014–15 to 2016–17. Trends are:
- red: more than 20% increase above the seven-year mean (2007–08 to 2013–14)
- yellow: less than 20% change (increase or decrease) from the seven-year mean
- green: more than 20% decrease below the seven-year mean.
Between 2014–15 and 2016–17, rainfall was approximately average. Dust activity for this period was 67% lower than the average for the previous seven years (2007–08 to 2013–14). Since this data was compiled, conditions have become drier and dust levels have increased slightly, but not to the levels of 2007–08 to 2013–14. Results across the monitoring sites reveal:
- between 2007–08 and 2013–14, Tibooburra was the driest and dustiest place in the State with 99 hours of dust
- from 2014–15 to 2016–17, the three dustiest places were Euston, Kyalite and Pooncarie, each with more than 20 hours of dust
- over the same period Tibooburra, with lower rainfall, only experienced 19 hours of dust.
This implies that land management activities, rather than climate variability, are the main factor in lower groundcover levels at the three dustiest sites, leading to wind erosion.
Dry years result in less soil moisture, making it harder for land managers to maintain groundcover above 50%, the level required for effective control of wind erosion. Land management practices like over-grazing, cultivation and the burning of crop residues reduce ground cover and increase the risk of erosion. Therefore, the level of ground cover is a good predictor of wind erosion that reflects the effects of climate and land management.
Figure 10.2 shows the average area with less than 50% groundcover within 50 kilometres of each of the 20 DustWatch sites.
Figure 10.2: Average area with less than 50% groundcover within 50 kilometres of each DustWatch site from 2007–08 to 2016–17
Notes:
Horizontal bars are averages for the seven years 2007–8 to 2013–14 and latest three-year period 2014–15 to 2016–17 respectively.
Figure 10.2 shows the area of less than 50% groundcover has decreased from 12% to 4% in the last three years, attributed to improved groundcover management.
Salinity
Salinity remains a land degradation issue of some concern across NSW, with detrimental impacts on agriculture and infrastructure. Soils in several regions throughout the State are subject to high salinity risk, which is influenced by prevailing climatic conditions. The condition of salinity is currently considered to be moderate, with a predominantly stable trend.
There has been no recent quantitative assessment of soil salinity in NSW. However, from salinity hazard assessments for the water quality component of NSW Water Resource Plans (2017–18), together with previous Hydrogeological Landscape (HGL) hazard assessments (2008–17) and salinity hazard assessments for catchment action plans (2012), a generalised, qualitative salinity hazard map for most of NSW can be compiled.
Overall salinity hazard ratings are based on the likelihood that salinity will occur and its potential impact. Assessments consider both the on-site impacts of salinity on the land, and the off-site impacts in streams of salt concentrations and loads. The severity of each of these will vary depending on local factors that influence how salt and water move through the landscape. The distribution of salinity hazard across NSW is shown in Map 10.7.
Map 10.7: Overall salinity hazard assessment for NSW, 2017
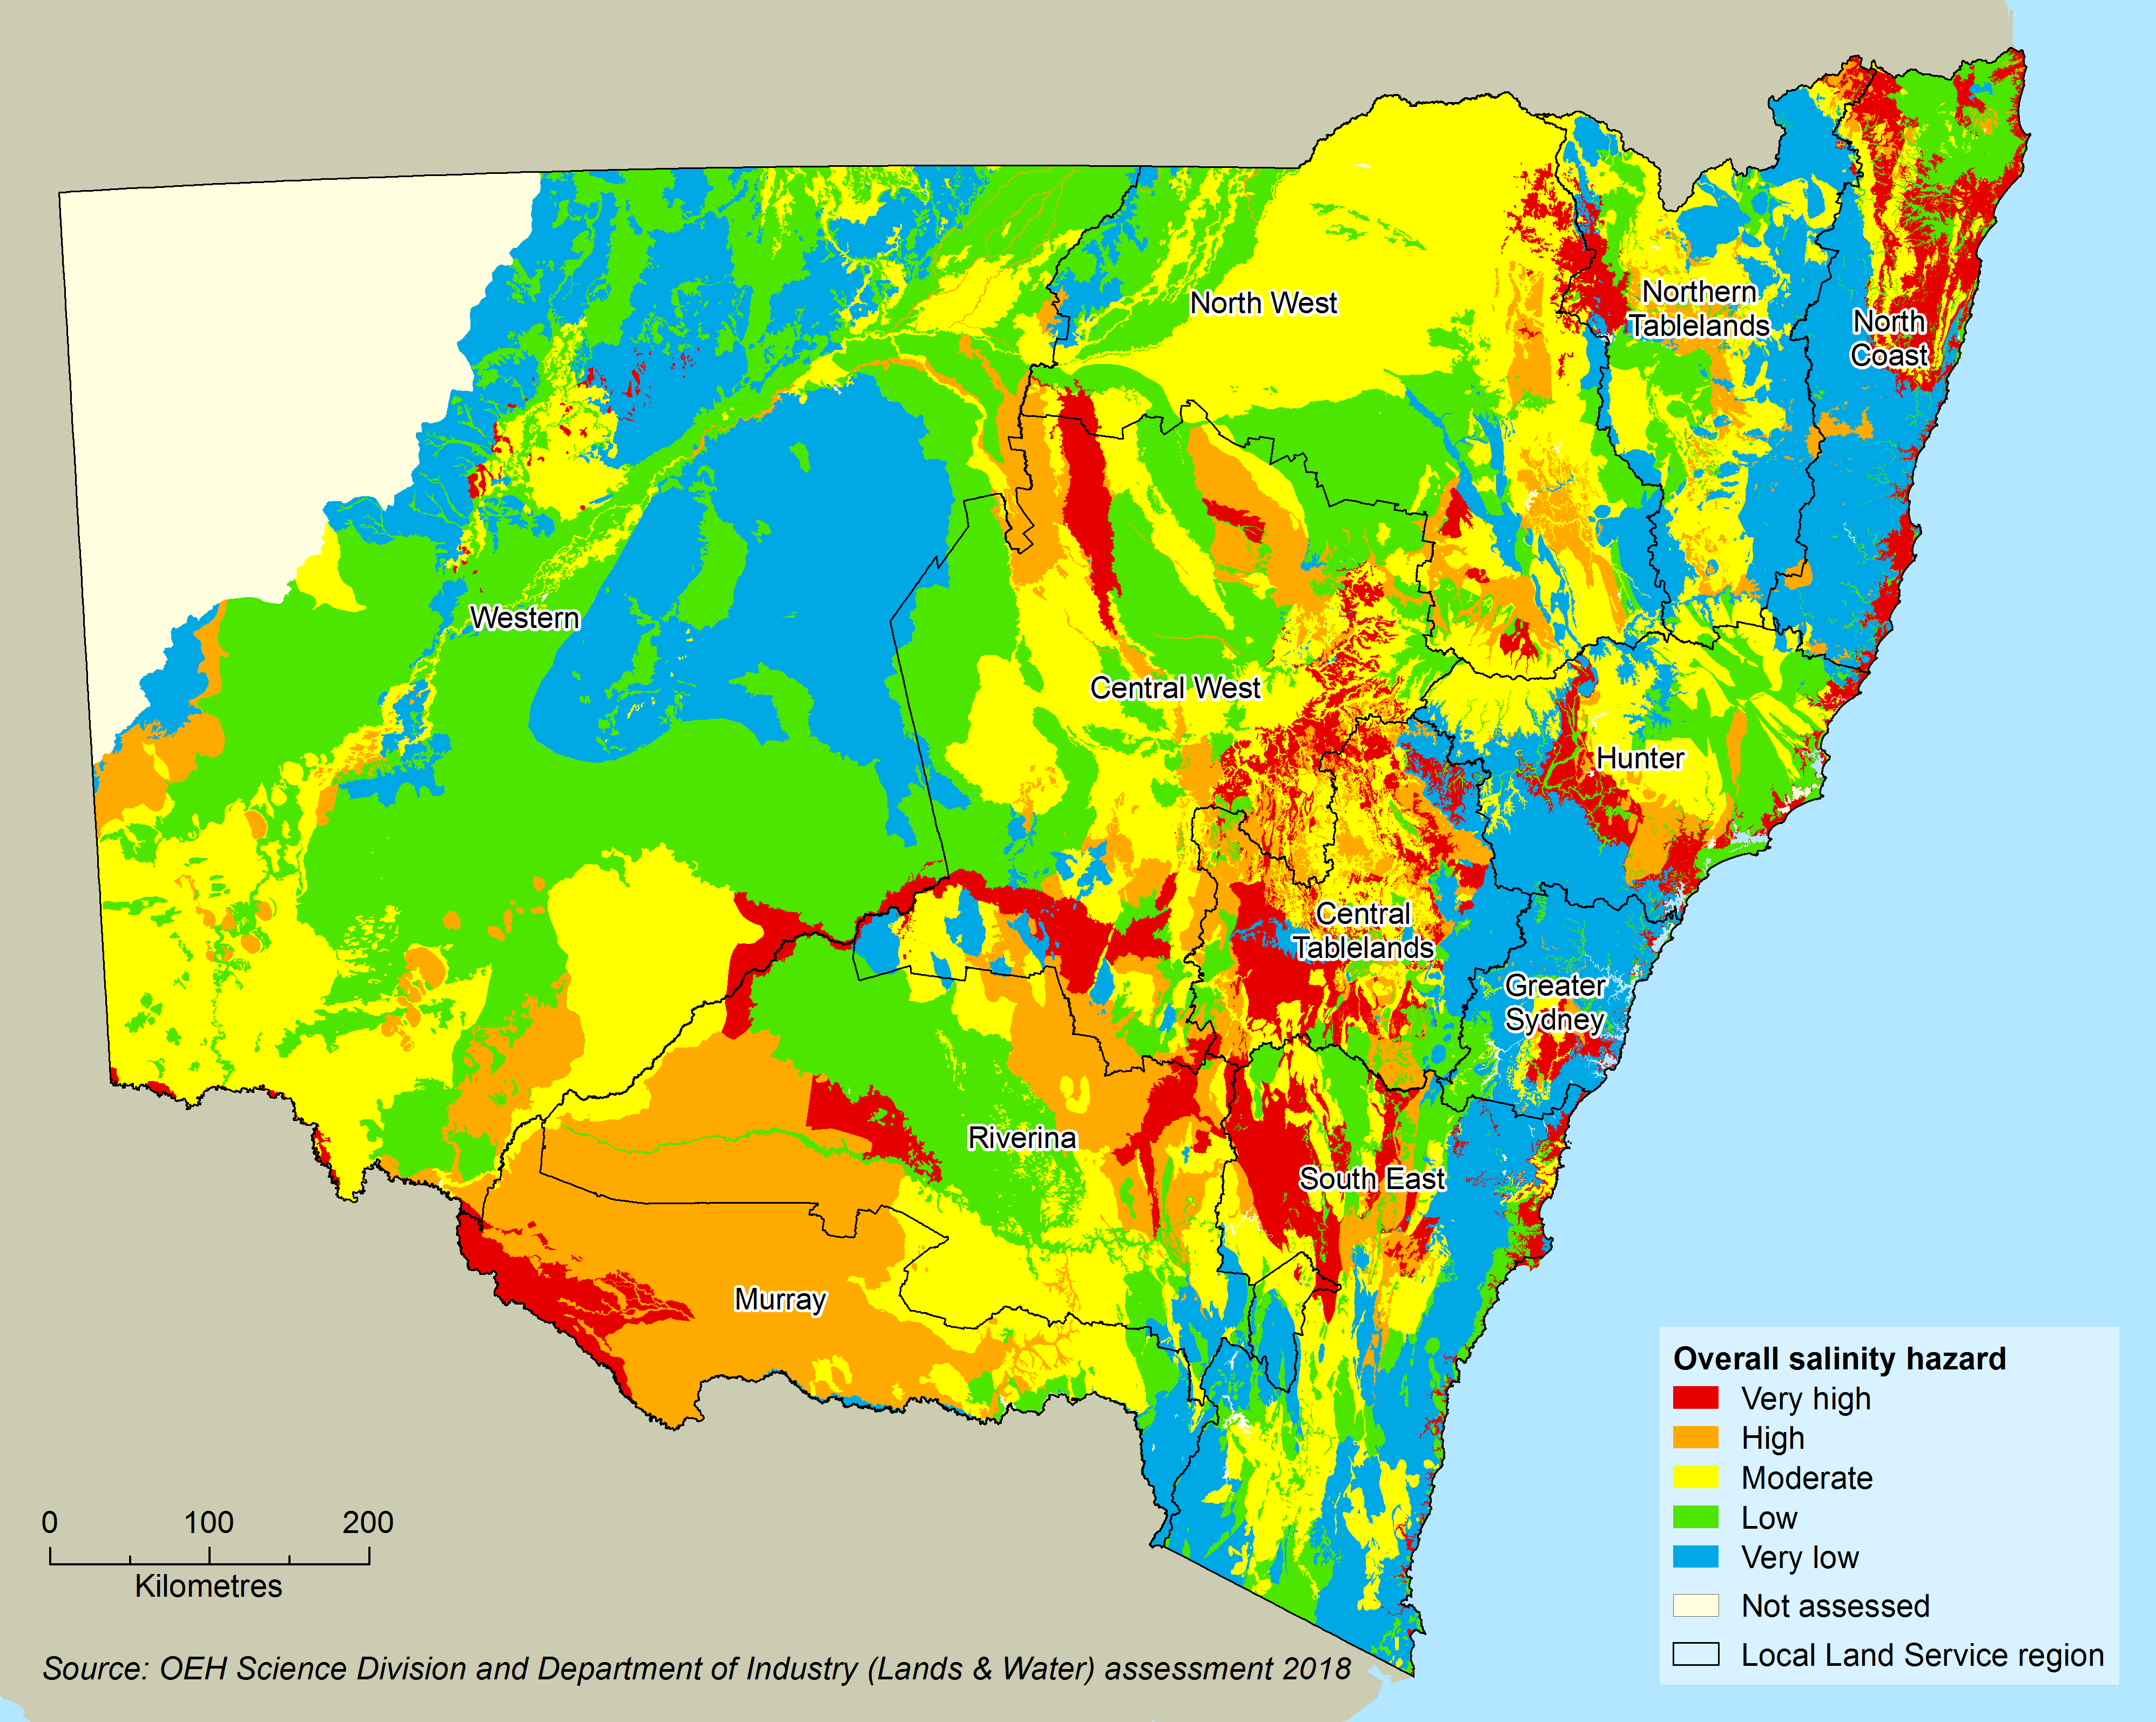
Approximately 10% of NSW contains landscapes where areas of high or very high salinity hazard may occur. Areas of concern are:
- the North Coast, Hunter and Central West regions
- the Greater Sydney, Yass and Boorowa regions
- the lower Murray, Murrumbidgee and Murray-Darling valleys.
Significant impacts on land and local infrastructure may occur in high hazard areas, as well as streams in the catchment area.
Salinity has not been recognised as an issue by land management groups in the north-west of the State where little assessment work has been conducted. However, the area that falls within the Murray-Darling Basin (MDB) is currently being assessed for NSW Water Resource Plans. The Murray–Darling Basin Authority also maintains a register of salinity credits and debits to keep account of actions that affect salinity in the MDB.
Future changes in rainfall and evaporation in all regions (DECCW 2010; Littleboy et al. 2015) will affect the balance between runoff and overland flows, and shallow drainage and deep drainage. These changes will affect the mobilisation and concentration of salts. Impacts on soil salinity are likely to be complex and difficult to predict. Whether salinity will increase or decrease in particular areas will depend on local factors.
Acid sulfate soil
Acid sulfate soils (ASS) are soils containing pyrites (iron sulphide). The exposure of such soils to the air where previously they were covered by water, through excavation or water drainage projects, has caused serious environmental impacts throughout NSW, particularly in coastal areas. With improved understanding and land management practices, such as shallower drainage channels, the severity of this issue has decreased.
The extent of ASS over NSW coastal lands is presented in the NSW ASS Risk Maps. The most recent assessment of NSW coastal ASS, carried out in 2009 and reported in OEH (2014), found the overall condition of ASS soils was moderate. However, 23% of the sites assessed were poor or worse.
Since then, ongoing remediation of problem areas has improved the condition of these soils. Of the 28 ASS hotspots identified, remediation works have now been carried out in 21 (75%). See the ‘Responses’ section for more details.
It is now known that areas of high ASS soils also occur in NSW inland river valleys (MDBA 2011). For example, Tulau and Morand (2012) found 30 of the 60 sites (50%) examined along the banks of the Edward–Wakool River system were sulfidic and prone to the release of acidic solutions into the riverine environment.
Pressures
Unsustainable land management and land use
When European settlers first arrived in Australia they adopted traditional farming practices that had been developed for different soil and climate conditions in a different part of the world. Much of the soil degradation in NSW is historic in nature and had occurred before an understanding developed of how to manage soils sustainably in Australian conditions.
The development of modern land management systems such as conservation farming, pasture rotation and no-tillage, together with better maintenance of groundcover, have largely halted, and in some cases reversed, the decline in soil condition. However, there is still some way to go before best practice land management is being implemented consistently across the State.
While land management practices have generally improved, the pressure on soil condition continues due to the increasing intensity of land use across NSW. There is, therefore, a greater need to ensure that soils and land are managed sustainably and within their inherent physical capacity – i.e. according to their capability to handle a specific level of disturbance or use.
As part of the NSW Monitoring, Evaluation and Reporting Strategy program 2008–09, an assessment was made of the extent to which soils were being managed within their capability, described in (OEH 2014) and summarised in the 2015 SoE Report (EPA 2015).
The pressure on soil condition from different types of land uses across NSW and the levels of soil disturbance associated with them, is represented by the land disturbance index (LDI). This system assigns land use to one of six classes, from 1 for undisturbed land such as native vegetation reserves to 6 for intense cropping land (Gray et al 2015c; based on NCST 2009). Map 10.8 presents the change in LDI from approximately 2003–13, based on land use information collected by the NSW Government.
Map 10.8: Change in land disturbance index, approximately from 2003–2013
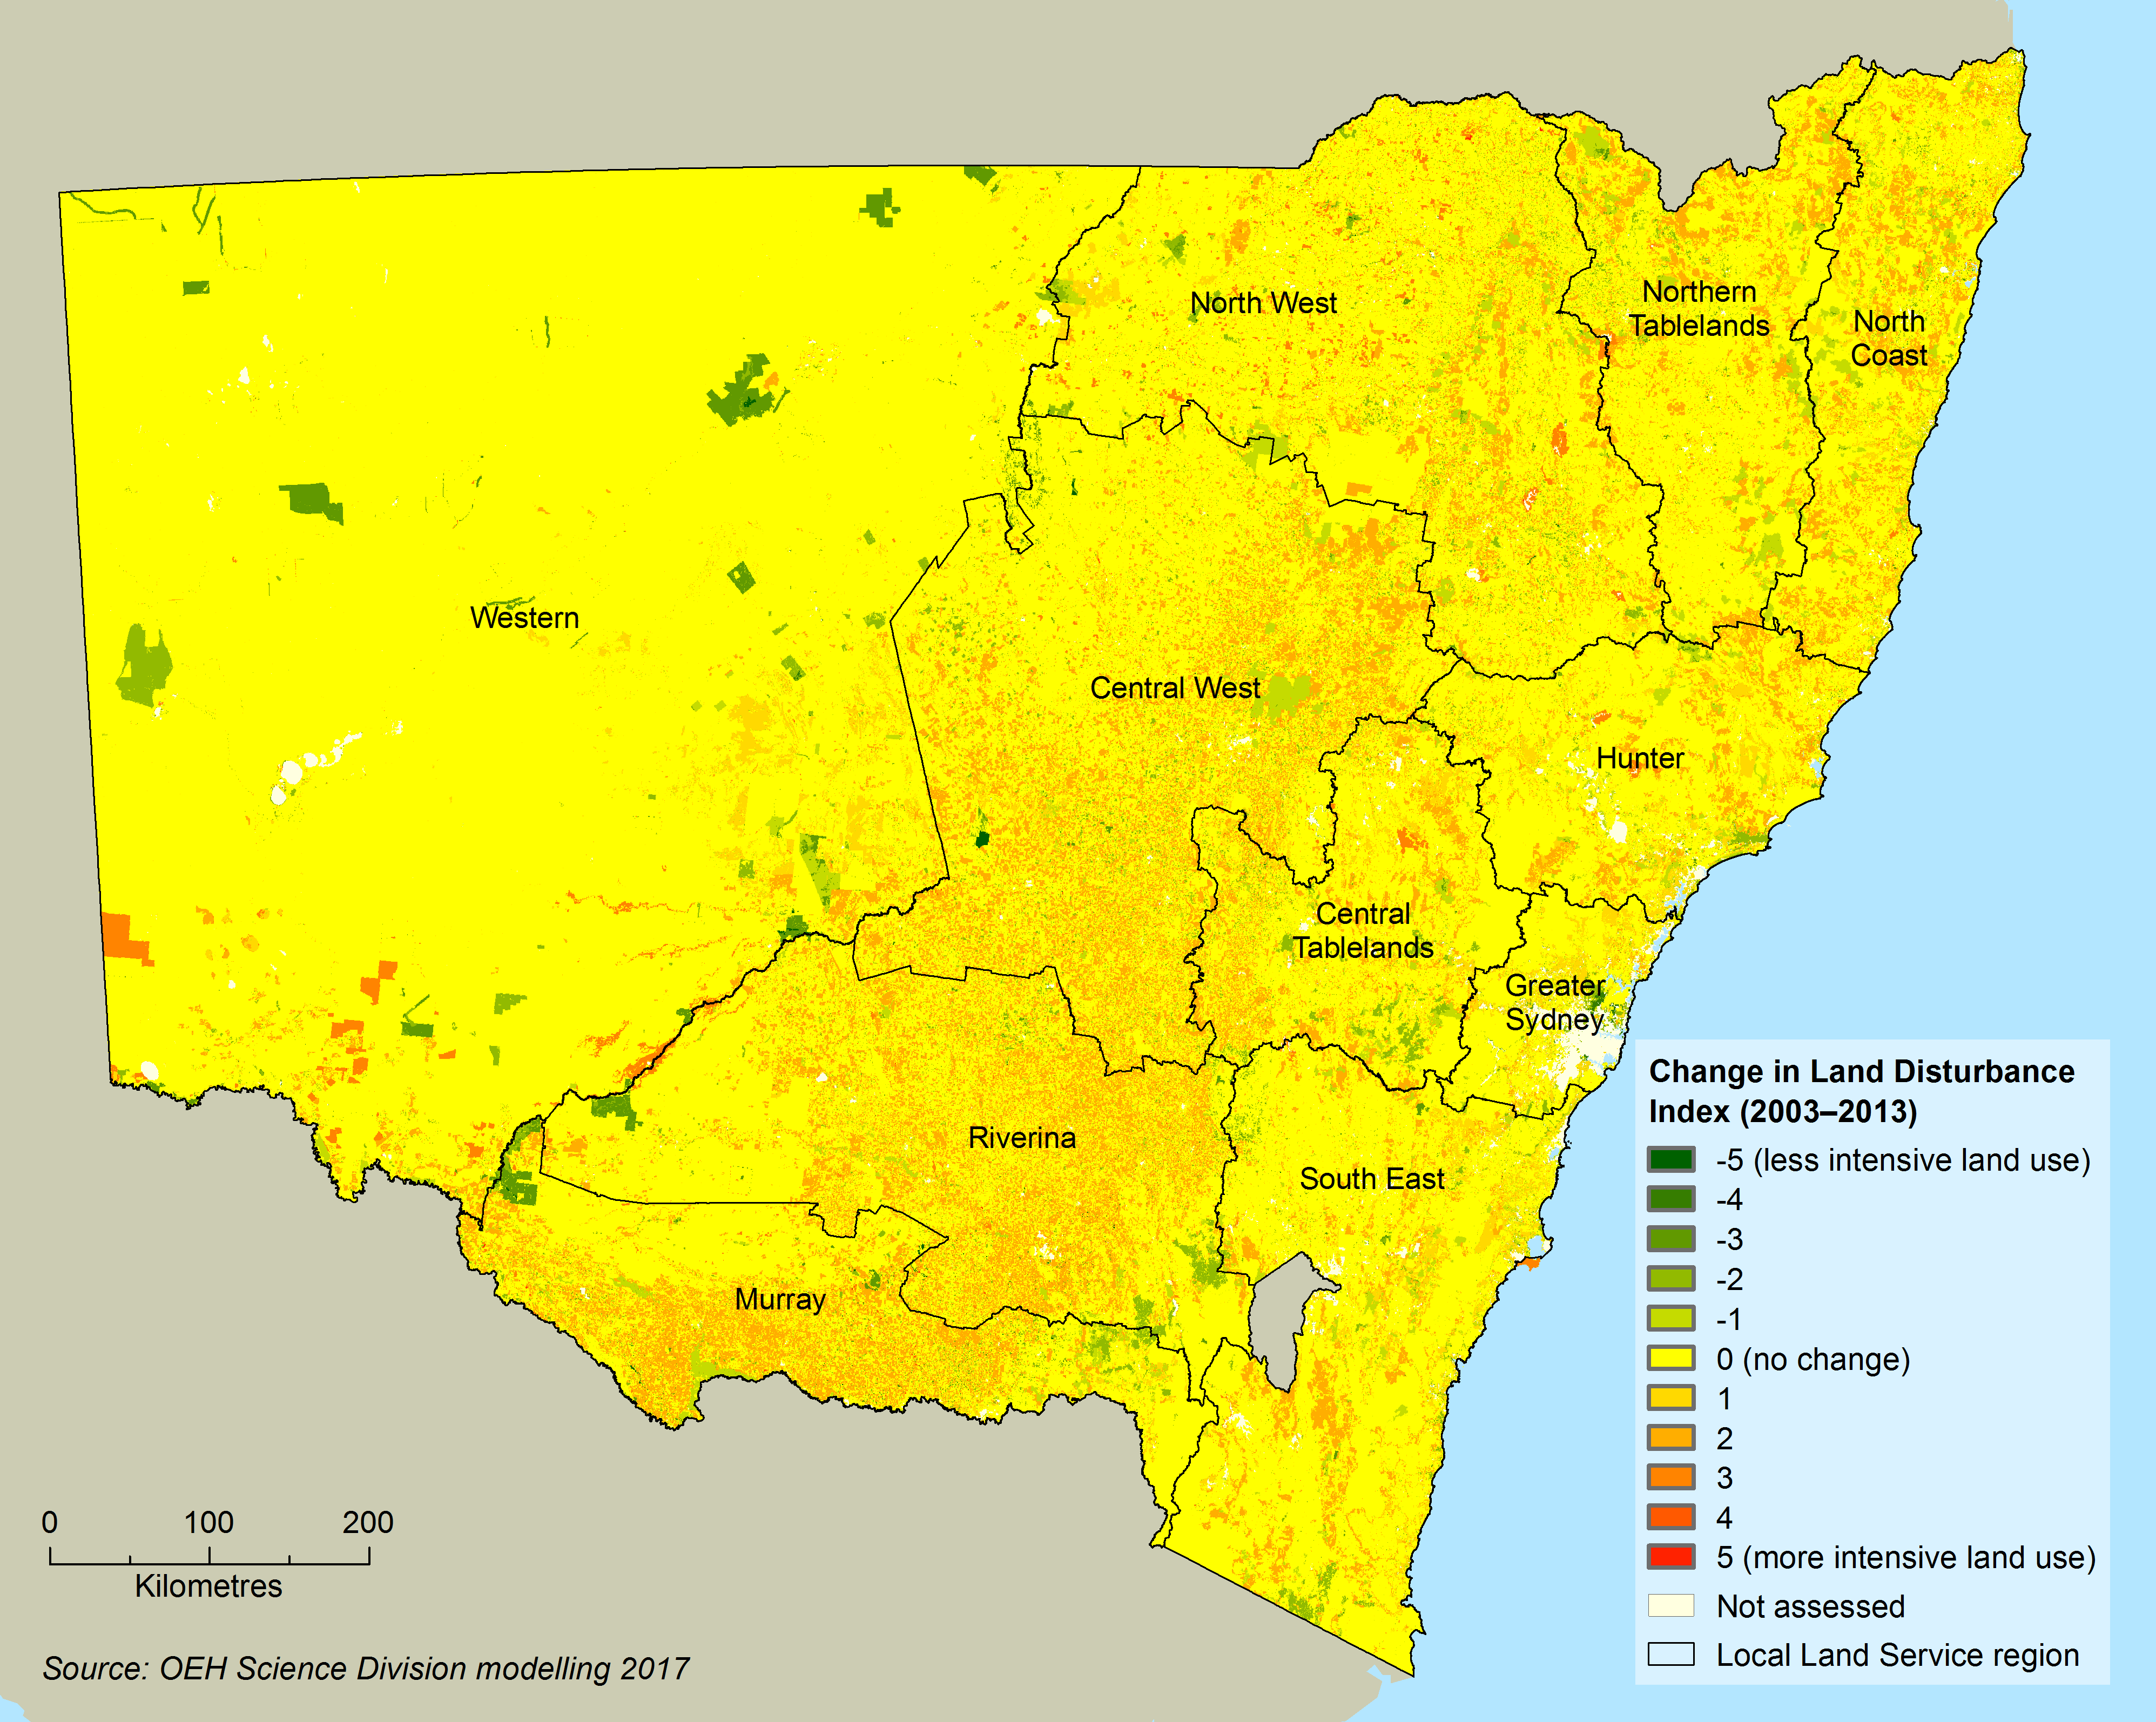
An overall trend towards more intensive land use over recent years is revealed by the map, with a statewide increase in the LDI of 0.20 units (see Table 10.3).
Table 10.3: Change in land disturbance index (LDI) from approximately 2003-2013, by LLS region
| Local Land Service region | Change in land disturbance index (units) |
|---|---|
| Central Tablelands | 0.29 |
| Central West | 0.40 |
| Greater Sydney | 0.08 |
| Hunter | 0.27 |
| Murray | 0.40 |
| North Coast | 0.35 |
| North West | 0.23 |
| Northern Tablelands | 0.27 |
| Riverina | 0.45 |
| South East | 0.20 |
| Western | 0.01 |
| NSW | 0.20 |
The LLS regions with the largest average increases are the Riverina, Central West and Murray (0.45, 0.40 and 0.40 units respectively). Many locations throughout the State, particularly in these three LLS regions have an increase of two LDI units, which for example, represents a change in land use from predominantly pasture to predominantly cropping.
However, some areas, particularly in the Western region, have changed to less intensive land uses, shown by the deep green in Map 10.8. These may, for example, reflect a change in land use from pastural lands to a protected conservation area. While a change in land management has occurred, a change in site conditions may not be evident immediately.
Although land use intensity may be increasing slightly across the State, as revealed by Map 10.8 and Table 10.3, land management practices may be improving simultaneously in many regions, to compensate.
For example, the Western region has a long history of wind erosion. The National Landcare Program and Catchment Action NSW have invested in changing land management practices on farms in this region, resulting in a 50% increase of sites with best management practices, from 16% in 2003, to 66% in 2016, as shown in Figure 10.3.
Figure 10.3: Trend in best management practices in the south-west of the Western LLS region, 2003–2016
Climate change
While soil may be managed sustainably with little risk of degradation during normal weather patterns, the unpredictability and variability of severe weather events can lead to conditions where the soil’s capacity to cope is suddenly exceeded, leading to loss of soil condition and degradation.
Climate change is expected to lead to more extreme weather events and generally drier conditions across much of NSW (Baldock et al. 2012; OEH 2015). This will increase the challenge in managing for weather variability and weather extremes such as high erosivity rainfall events, increased fire and drought. A changing climate will require a rethink of the way that soils and land are currently managed by geographic locations. Without adjustments, it is possible that land may be used beyond its capability.
Climate change will also increase the risk of some soil degradation hazards, particularly wind erosion and loss of soil carbon (Rengel 2011). For more information on the effects of climate change see the Climate Change topic of this report.
Changed population and settlement patterns
Rising population in urban areas and increased demand for food at various levels – local, regional, national and international, is leading to an intensification in the use of productive land and greater risk of soil degradation. At the urban fringe, highly productive land is coming under growing development pressure, while population loss from rural areas reduces the capacity to manage land effectively (see DECCW 2009).
Economic factors
Economic factors such as declining farm profitability, or poor international trading conditions, including surplus stocks of resources or high foreign exchange rates (as occurred in the recent past), may lead to the intensifying of land uses and production activities in order to maintain viability, which may not be sustainable over the longer term.
Increasing fuel prices and competition for essential resources like water and fertilisers are other significant factors that pose challenges for managing the land sustainably (Cribb 2010).
Responses
Legislation and policy
The Soil Conservation Act 1938 provides for the conservation of soil and water resources and the mitigation of erosion. Through this Act the Soil Conservation Service was established, a NSW Government-owned soil conservation and environmental consulting business.
The Local Land Services Act 2013 (amended in 2016) regulates the clearing of native vegetation on rural lands while the Biodiversity Conservation Act 2016 (BC Act) promotes conservation on private land. These laws aim to achieve a balance between land use and biodiversity conservation in NSW.
Clearing of native vegetation in urban areas and land zoned for environmental protection is regulated by State Environmental Planning Policy (Vegetation in Non-Rural Areas) 2017 (the Vegetation SEPP) as well as some provisions in the BC Act that provide for the biodiversity offsets scheme. For more information see the Native Vegetation topic.
The current approach to soil management in NSW is to consider soils as part of a broader approach to natural resource management rather than as a standalone issue (Webb et al. 2015). Specific policies for sustainable soil management in NSW include:
- the State Environmental Planning Policy (Rural Lands) 2008
- the Policy for Sustainable Agriculture in NSW (NSW Agriculture 1998).
Programs
Landcare and other on-ground initiatives
Landcare is a community network that contributes to the integrated management of natural resources at the grass-roots level across NSW, including improved soil management and land remediation.
There are presently about 3,000 Landcare groups in NSW, who are working to:
- reduce soil and streambank erosion
- control weeds
- revegetate river banks, farmland and other public lands.
Landcare groups also promote the sustainable use of soils through education and community awareness programs.
The NSW Government currently funds the Landcare program, including the NSW Local Landcare Coordinator Initiative, a four-year program running through to June 2019. This initiative involves 72 local Landcare Coordinators working with 34 organisations across NSW to build the capacity of the Landcare movement to achieve its goals of:
- improving natural resources
- encouraging sustainable agriculture
- empowering the community to improve their local environment.
Local Land Services work with local communities, including Landcare groups and landholders, to develop strategies and programs to improve natural resource management and sustainable land use across NSW.
Catchment Action NSW is a NSW Government-funded program to deliver natural resource management priorities in the State, usually in conjunction with the National Landcare program. One high-level outcome is to protect or rehabilitate soils to support ecosystem services. This program is continuing in 2018–19.
Phase two of the National Landcare Program commenced in the second half of 2018.
The Emissions Reduction Fund (ERF) operates under the Carbon Farming Initiative Amendment Act 2014. The ERF provides funding through a reverse auction mechanism to enable land managers to be financially rewarded for sequestering carbon. The first round of auctions in early 2015 resulted in 47 million tonnes of CO2-e abatement (28 million tonnes of CO2-equivalent gases being contracted for sequestration and 19 million tonnes by other means).
Advisory bodies and instruments
The Natural Resources Commission provides independent advice to the NSW Government on how to most effectively manage natural resources to maintain production and conservation. It works with the State’s regional communities and other stakeholders to improve or maintain the health and productivity of landscapes across NSW.
The Australian Soil Network oversees soil research and development strategies and their implementation throughout Australia. It comprises representatives from Rural Research and Development Corporations, government agencies, CSIRO, the University sector, and is currently co-chaired by the NSW Government (Department of Primary Industries).
The National Committee on Soil and Terrain coordinates and provides advice on soil and land assessment standards and policy. National protocols for monitoring soil acidification and soil carbon have been published (Grealish et al. 2011).
The National Committee for Acid Sulfate Soils (NatCASS) is assisting the Commonwealth Department of Agriculture and Water Resources to develop guidelines on acid sulfate soil management issues that are not being adequately addressed in some jurisdictions, including:
- the clean-up of groundwater in areas of acid sulfate soils
- dredging of sulfidic sediments
- managing monosulfidic black ooze accumulations.
NatCASS is also completing a Code of Practice for the re-use of ASS materials that are excavated and removed from development sites, and NSW is actively represented. Guidelines for the identification and management of inland ASS were developed through the National Water Quality Management Strategy (NWQMS) (Baldwin 2011)
The management of salinity throughout NSW is guided by NSW Water Resource Plans in combination with the Hydrogeological Landscape program.
Research, development and data collection
The National Soil Research, Development and Extension Strategy (DoA 2014) aims to conduct research that meets the needs of farmers and primary producers and provide information promoting sustainable soil use and management.
The NSW Office of Environment and Heritage (OEH) collects data on soil and land management processes, conducts surveys and maintains NSW soil data through eSPADE.
The NSW Department of Primary Industries (DPI Agriculture) has a large research and development program that develops technologies and management systems to:
- maintain and enhance the physical, chemical and biological productivity of soils
- protect soil resources,
- build resilience and reduce environmental impacts.
It works in partnership with Local Land Services and private stakeholders to ensure research and development findings are delivered to industry.
Monitoring programs
The performance monitoring system of the Soil Health Evidence Based Assessment (SHEBA) program (formerly SoilWatch) is applied in many regions of NSW. It complements and supplements other surveillance monitoring.
The cross-agency collaborative Community DustWatch program has been monitoring the extent and magnitude of dust events across NSW for the past 10 years. NSW Government agencies also lead the national assessment of wind erosion (Leys et al. 2016) and the use of remote sensing to assess the extent of groundcover.
Under Phase 2 of the National Landcare Program, groundcover will be a key reporting indicator, with the reporting methods developed in NSW being proposed for use nationally.
References
References for Soil Condition
Baldock JA, Wheeler I, McKenzie N & McBratney A 2012, ‘Soils and climate change: Potential impacts on carbon stocks and greenhouse gas emissions, and future research for Australian agriculture’, Crop and Pasture Science, 63, pp. 269–83 [dx.doi.org/10.1071/CP11170]
Baldwin D 2011, National guidance for the management of acid sulfate soils in inland aquatic ecosystems, Commonwealth Government, CSIRO, Canberra, EP101559
Bui EN, Hancock GJ, Chappell A & Gregory LJ 2010, Evaluation of tolerable erosion rates and time to critical topsoil loss in Australia, CSIRO, Canberra [nrmonline.nrm.gov.au/catalog/mql:2237]
Cribb J 2010, The Coming Famine: The global food crisis and what we can do to avoid it, University of California Press, Berkeley, California [https://www.ucpress.edu/book.php?isbn=9780520271234]
DECCW 2009, NSW State of the Environment Report 2009, Department of Environment, Climate Change and Water, Sydney [www.epa.nsw.gov.au/soe/soe2009]
DECCW 2010, NSW Climate Impact Profile: The impacts of climate change on the biophysical environment of New South Wales, Department of Environment, Climate Change and Water, Sydney [http://climatechange.environment.nsw.gov.au/Impacts-of-climate-change/2010-NSW-climate-impact-reporting]
DoA 2014, The National Soil Research, Development and Extension Strategy: Securing Australia’s soil for profitable industries and healthy landscapes, Commonwealth Department of Agriculture , Canberra [www.agriculture.gov.au/ag-farm-food/natural-resources/soils/national_soil_rd_and_e_strategy]
EPA 2015, NSW State of the Environment 2015, Environment Protection Authority, Sydney [www.epa.nsw.gov.au/about-us/publications-and-reports/state-of-the-environment/state-of-the-environment-2015]
Fenton G & Helyar KR 2007, ‘Soil acidification’, in Charman PEV & Murphy BW (eds), Soils: Their Properties and Management, Oxford University Press, Melbourne
Gray JM, Bishop TFA & Smith PL 2015a, ‘Digital mapping of pre-European soil carbon stocks and decline since clearing over New South Wales, Australia’, Soil Research 54 (1), pp. 49–63 [www.publish.csiro.au/view/journals/dsp_journals_pip_abstract_scholar1.cfm?nid=84&pip=SR14307]
Gray JM, Bishop TFA & Wilson BR 2015b, ‘Factors controlling soil organic carbon stocks with depth in eastern Australia’, Soil Science Society of America Journal 79, pp. 1,741–51 [https://dl.sciencesocieties.org/publications/sssaj/pdfs/79/6/1741 (PDF 1.1MB)]
Gray JM, Bishop TFA & Yang X 2015c, ‘Pragmatic models for the prediction and digital mapping of soil properties in eastern Australia’, Soil Research, 53, pp. 24–42 [www.publish.csiro.au/sr/pdf/SR13306 (PDF 2.2MB)]
Grealish G, Clifford D, Wilson P & Ringrose-Voase A 2011, National Soil Condition Monitoring for soil pH and soil carbon: Objectives, design, protocols, governance and reporting, a CSIRO Land and Water Science Report for Caring for our Country [http://www.clw.csiro.au/aclep/documents/CLW_Science_Report_0511.pdf (PDF 1.9MB)]
Hazelton P & Murphy BW 2007, Interpreting Soil Test Results. What do all the numbers mean?, CSIRO Publishing, Melbourne
Leys J, Heidenreich S, Koen T & Colson I 2016, DustWatch Network and Roadside Survey 2016, Report for contract WN00732, NSW Government, Local Land Services (Western), Sydney [http://western.lls.nsw.gov.au/__data/assets/pdf_file/0009/684963/Updated-DustWatch-Network-and-Roadside-Survey.pdf (PDF 0.6MB)]
Littleboy M, Young J & Raman J 2015, Climate change impacts on surface runoff and recharge to groundwater, Office of Environment & Heritage, Sydney [http://climatechange.environment.nsw.gov.au/Impacts-of-climate-change/Water-resources/Groundwater-recharge-and-surface-runoff]
Lockwood P, Wilson BR, Daniel H & Jones M 2003, Soil Acidification and Natural Resource Management: Directions for the Future, commissioned report for the NSW Acid Soil Action Program, Wagga Wagga [www.researchgate.net/publication/236736946]
McKenzie NJ & Dixon J 2006, Monitoring Soil Condition across Australia: Recommendations from the Expert Panels, National Land and Water Resources Audit, Canberra
McKenzie NJ, Hairsine PB, Gregory LJ, Austin J, Baldock JA, Webb MJ, Mewett J, Cresswell HP, Welti N & Thomas M 2017, Priorities for improving soil condition across Australia’s agricultural landscapes, Report prepared for the Australian Government Department of Agriculture and Water Resources, CSIRO, Canberra [https://publications.csiro.au/rpr/pub?pid=csiro:EP177962]
MDBA 2011, Acid Sulfate Soils in the Murray–Darling Basin, Murray Darling Basin Authority, Canberra [www.mdba.gov.au/sites/default/files/pubs/Acid-sulfate-soils-in-the-MDB.pdf (PDF 8.8MB)]
Metcalfe DJ & Bui EN 2017, Australia: State of the Environment 2016: Land, Independent report to the Australian Government Minister for the Environment and Energy, Australian Government Department of the Environment and Energy, Canberra [https://soe.environment.gov.au/sites/g/files/net806/f/soe2016-land-final-web.pdf?v=1492063205 (PDF 6.4MB)]
Murphy BW 2015, ‘Impact of soil organic matter on soil properties: A review with emphasis on Australian soils’, Soil Research 53, pp. 605–35
NCST 2009, Australian soil and land survey field handbook, 3rd edn, National Committee on Soil and Terrain, CSIRO Publishing, Melbourne
NSW Agriculture 1998, Policy for Sustainable Agriculture in NSW, NSW Agriculture, Orange [https://catalogue.nla.gov.au/Record/664493]
OEH 2014, Soil condition and land management in NSW: final results from the 2008–09 monitoring evaluation and reporting program, Technical report series, Office of Environment & Heritage, Sydney [www.environment.nsw.gov.au/soils/140389MERsoil.htm]
OEH 2015, New South Wales Climate Change Snapshot, AdaptNSW, Office of Environment & Heritage, Sydney [http://climatechange.environment.nsw.gov.au/Climate-projections-for-NSW/Climate-projections-for-your-region]
OEH 2017, Digital soil mapping of key soil properties over NSW, Technical Report, Office of Environment & Heritage, Sydney [https://datasets.seed.nsw.gov.au/dataset/digital-soil-maps-for-key-soil-properties-over-nsw]
Renard KG, Foster GR, Weesies GA, McCool DK & Yoder DC 1997, Predicting soil erosion by water: A guide to conservation planning with the Revised Universal Soil Loss Equation (RUSLE), Agricultural Handbook, vol. 703, US Department of Agriculture, Washington, DC, pp. 1–251
Rengel Z 2011, ‘Soil pH, soil health and climate change’, in Singh BP, Cowie AL & Chan KY (eds), Soil Health and Climate Change, Soil Biology vol.28, Springer-Verlag GmbH, Berlin, pp. 69–85 [dx.doi.org/10.1007/978-3-642-20256-8_4]
Stockmann U, Minasny B & McBratney AB 2014, ‘How fast does soil grow?’, Geoderma, 216, pp. 48–61 [dx.doi.org/10.1016/j.geoderma.2013.10.007]
Tulau M & Morand D 2013, Aspects of Quaternary geology, geomorphic history, stratigraphy, soils and hydrogeology in the Edward-Wakool channel system, with particular reference to the distribution of sulfidic channel sediments, Technical Report, NSW Office of Environment & Heritage, Sydney
Webb AA, Kelly GL & Dougherty WJ 2015, ‘Soil governance in the agricultural landscapes of New South Wales’, International Journal of Rural Law and Policy, Special edition 1, 2015 [http://epress.lib.uts.edu.au/journals/index.php/ijrlp/article/view/4169/5022]
Wilson BR, Koen TB, Barnes P, Ghosh S & King D 2011, ‘Soil carbon and related soil properties along a soil type and land-use intensity gradient, New South Wales, Australia’, Soil Use and Management, 27, pp. 437–47
Yang X, Gray J, Chapman C, Zhu Q, Tulau M & McInnes-Clarke S 2017, ‘Digital mapping of soil erodibility for water erosion in New South Wales, Australia’, Soil Research, 56(2), pp. 158–70 [www.publish.csiro.au/sr/sr17058]