Summary
The NSW population continues to increase; between 2012 and 2017 the annual average growth rate was 1.5%. Population growth is a key driver of human-caused changes to the environment.
By June 2017, there were 7.9 million people living in NSW, 61% of whom lived in Greater Sydney. NSW gained more than 550,000 people between June 2012 and June 2017.
Population density in NSW has also risen. In June 2017, there were an average of 9.8 people per square kilometre – a 12% rise since 2008. In Greater Sydney, there were almost 450 people per square kilometre – 65 more people than in 2008.
By 2036, the NSW population is expected to grow to 9.9 million. Most of this growth is anticipated to be in Greater Sydney. The challenge is to manage projected population growth alongside environmental protection, conservation and liveability.
The NSW Government has developed long-term plans for Greater Sydney and regional NSW. The plans aim to provide for sustainable and resilient development with a balanced approach to the use of land and water resources while enhancing liveability and protecting the natural environment.
Other strategies for reducing environmental impacts of urbanisation and a growing population include the NSW Waste Avoidance and Resource Recovery Strategy, the Sydney Green Grid framework for enhancement of open space, Future Transport 2056 and the 2017 Metropolitan Water Plan.
Related topics: Energy Consumption | Transport | Urban Water | Waste and Recycling
Context
Population growth is a significant driver of environmental impacts. Rising population and increasing urbanisation lead to greater demand for housing, energy, water, consumer products and transport services, as well as increased resource use and waste and emissions generation.
An understanding of the dynamics of the NSW population is critical when devising strategic planning processes that provide for:
- environmental protection
- enhanced liveability
- sustainable land use
- management of the impacts of population growth on the environment.
Status and Trends
Population growth
At 30 June 2017, there were almost 7.9 million people in NSW, of whom 4.8 million (61%) lived in Greater Sydney, 1.8 million (23%) lived in coastal areas and 1.2 million (16%) lived inland. The NSW population has grown by 111,400 people a year, on average, over the five years to 30 June 2017 (see Table 1.1 and Figure 1.1). At a growth rate of 1.5% per year, this was the second largest increase in state population after Victoria.
In this topic, unless otherwise noted, all references to a particular year mean the 12 months ending 30 June of that year.
Table 1.1: Population of NSW and its regions, 2012 and 2017
| Region | Population at 30 June | Population change 2012–17 | ||
|---|---|---|---|---|
| 2012 | 2017p | Number | Annual growth rate (%) | |
| Greater Sydney | 4,351,990 | 4,793,691 | 441,701 | 2.0 |
| Coastal NSW* | 1,740,180 | 1,814,873 | 74,693 | 0.8 |
| Inland NSW** | 1,212,074 | 1,252,504 | 40,430 | 0.7 |
| NSW | 7,304,244 | 7,861,068 | 556,824 | 1.5 |
Notes:
p preliminary; *Coastal NSW comprises all local government areas with coastal boundaries outside Greater Sydney; **Inland NSW comprises all areas not included in Greater Sydney or Coastal NSW.
Figure 1.1: Population growth in Greater Sydney* and NSW, 2008–17
Notes:
* Greater Sydney extends from the Hawkesbury River in the north to the Royal National Park in the south; towards the west the region includes the Blue Mountains, Wollondilly and Hawkesbury local government areas.
Between 2012 and 2017, population grew at a faster rate in parts of Greater Sydney, regional cities and popular coastal areas than in the rest of NSW (see Map 1.1).
Map 1.1: Population change in NSW, 2012 to 2017
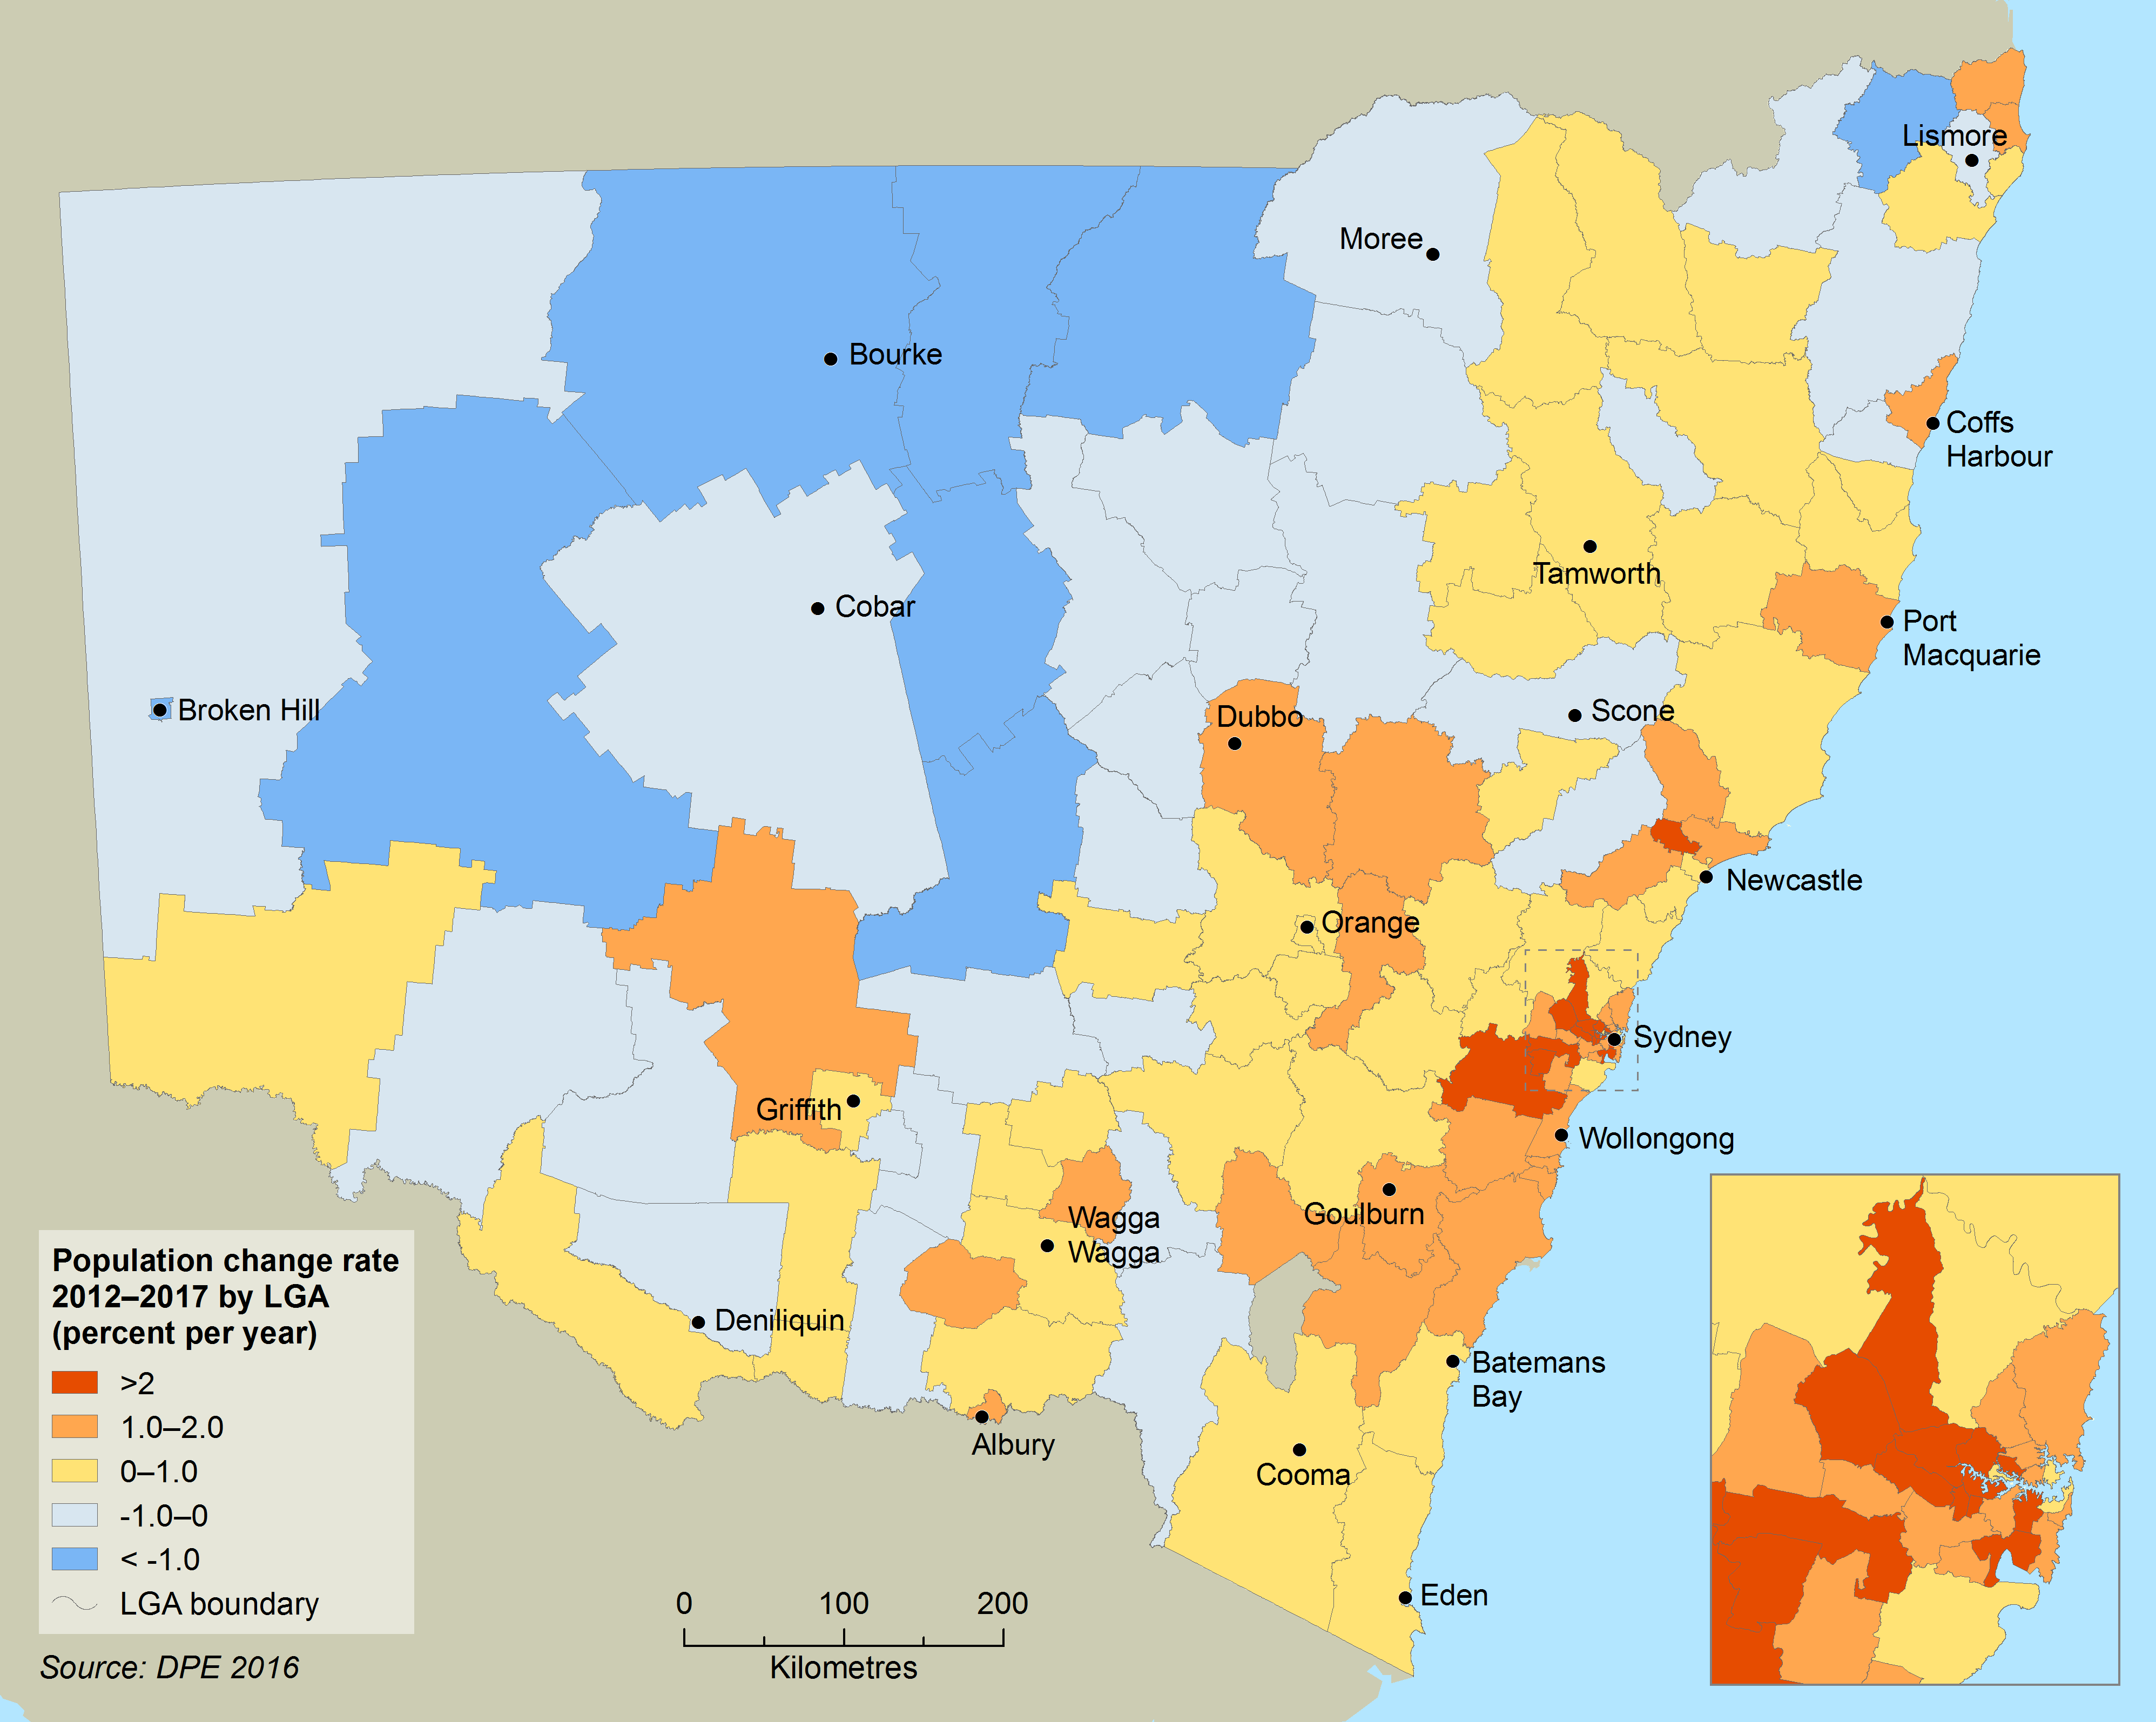
Greater Sydney
Over the five years to June 2017, Greater Sydney’s population increased by almost 450,000 people, or 10%. Within Greater Sydney, the largest population increases were in the local government areas (LGAs) of Sydney (43,700), Blacktown (39,100) and Parramatta (35,300) (ABS 2018).
Regional NSW
Between 2012 and 2017, the population of regional NSW, which includes coastal NSW and inland NSW, increased by almost 4%. Substantial growth occurred in areas closer to Sydney (the Central Coast, Lower Hunter and Wollongong) and the state’s larger regional centres (Tweed, Tamworth, Port Macquarie and Bathurst). The largest population declines occurred in areas that were already sparsely populated, such as Broken Hill and Moree Plains.
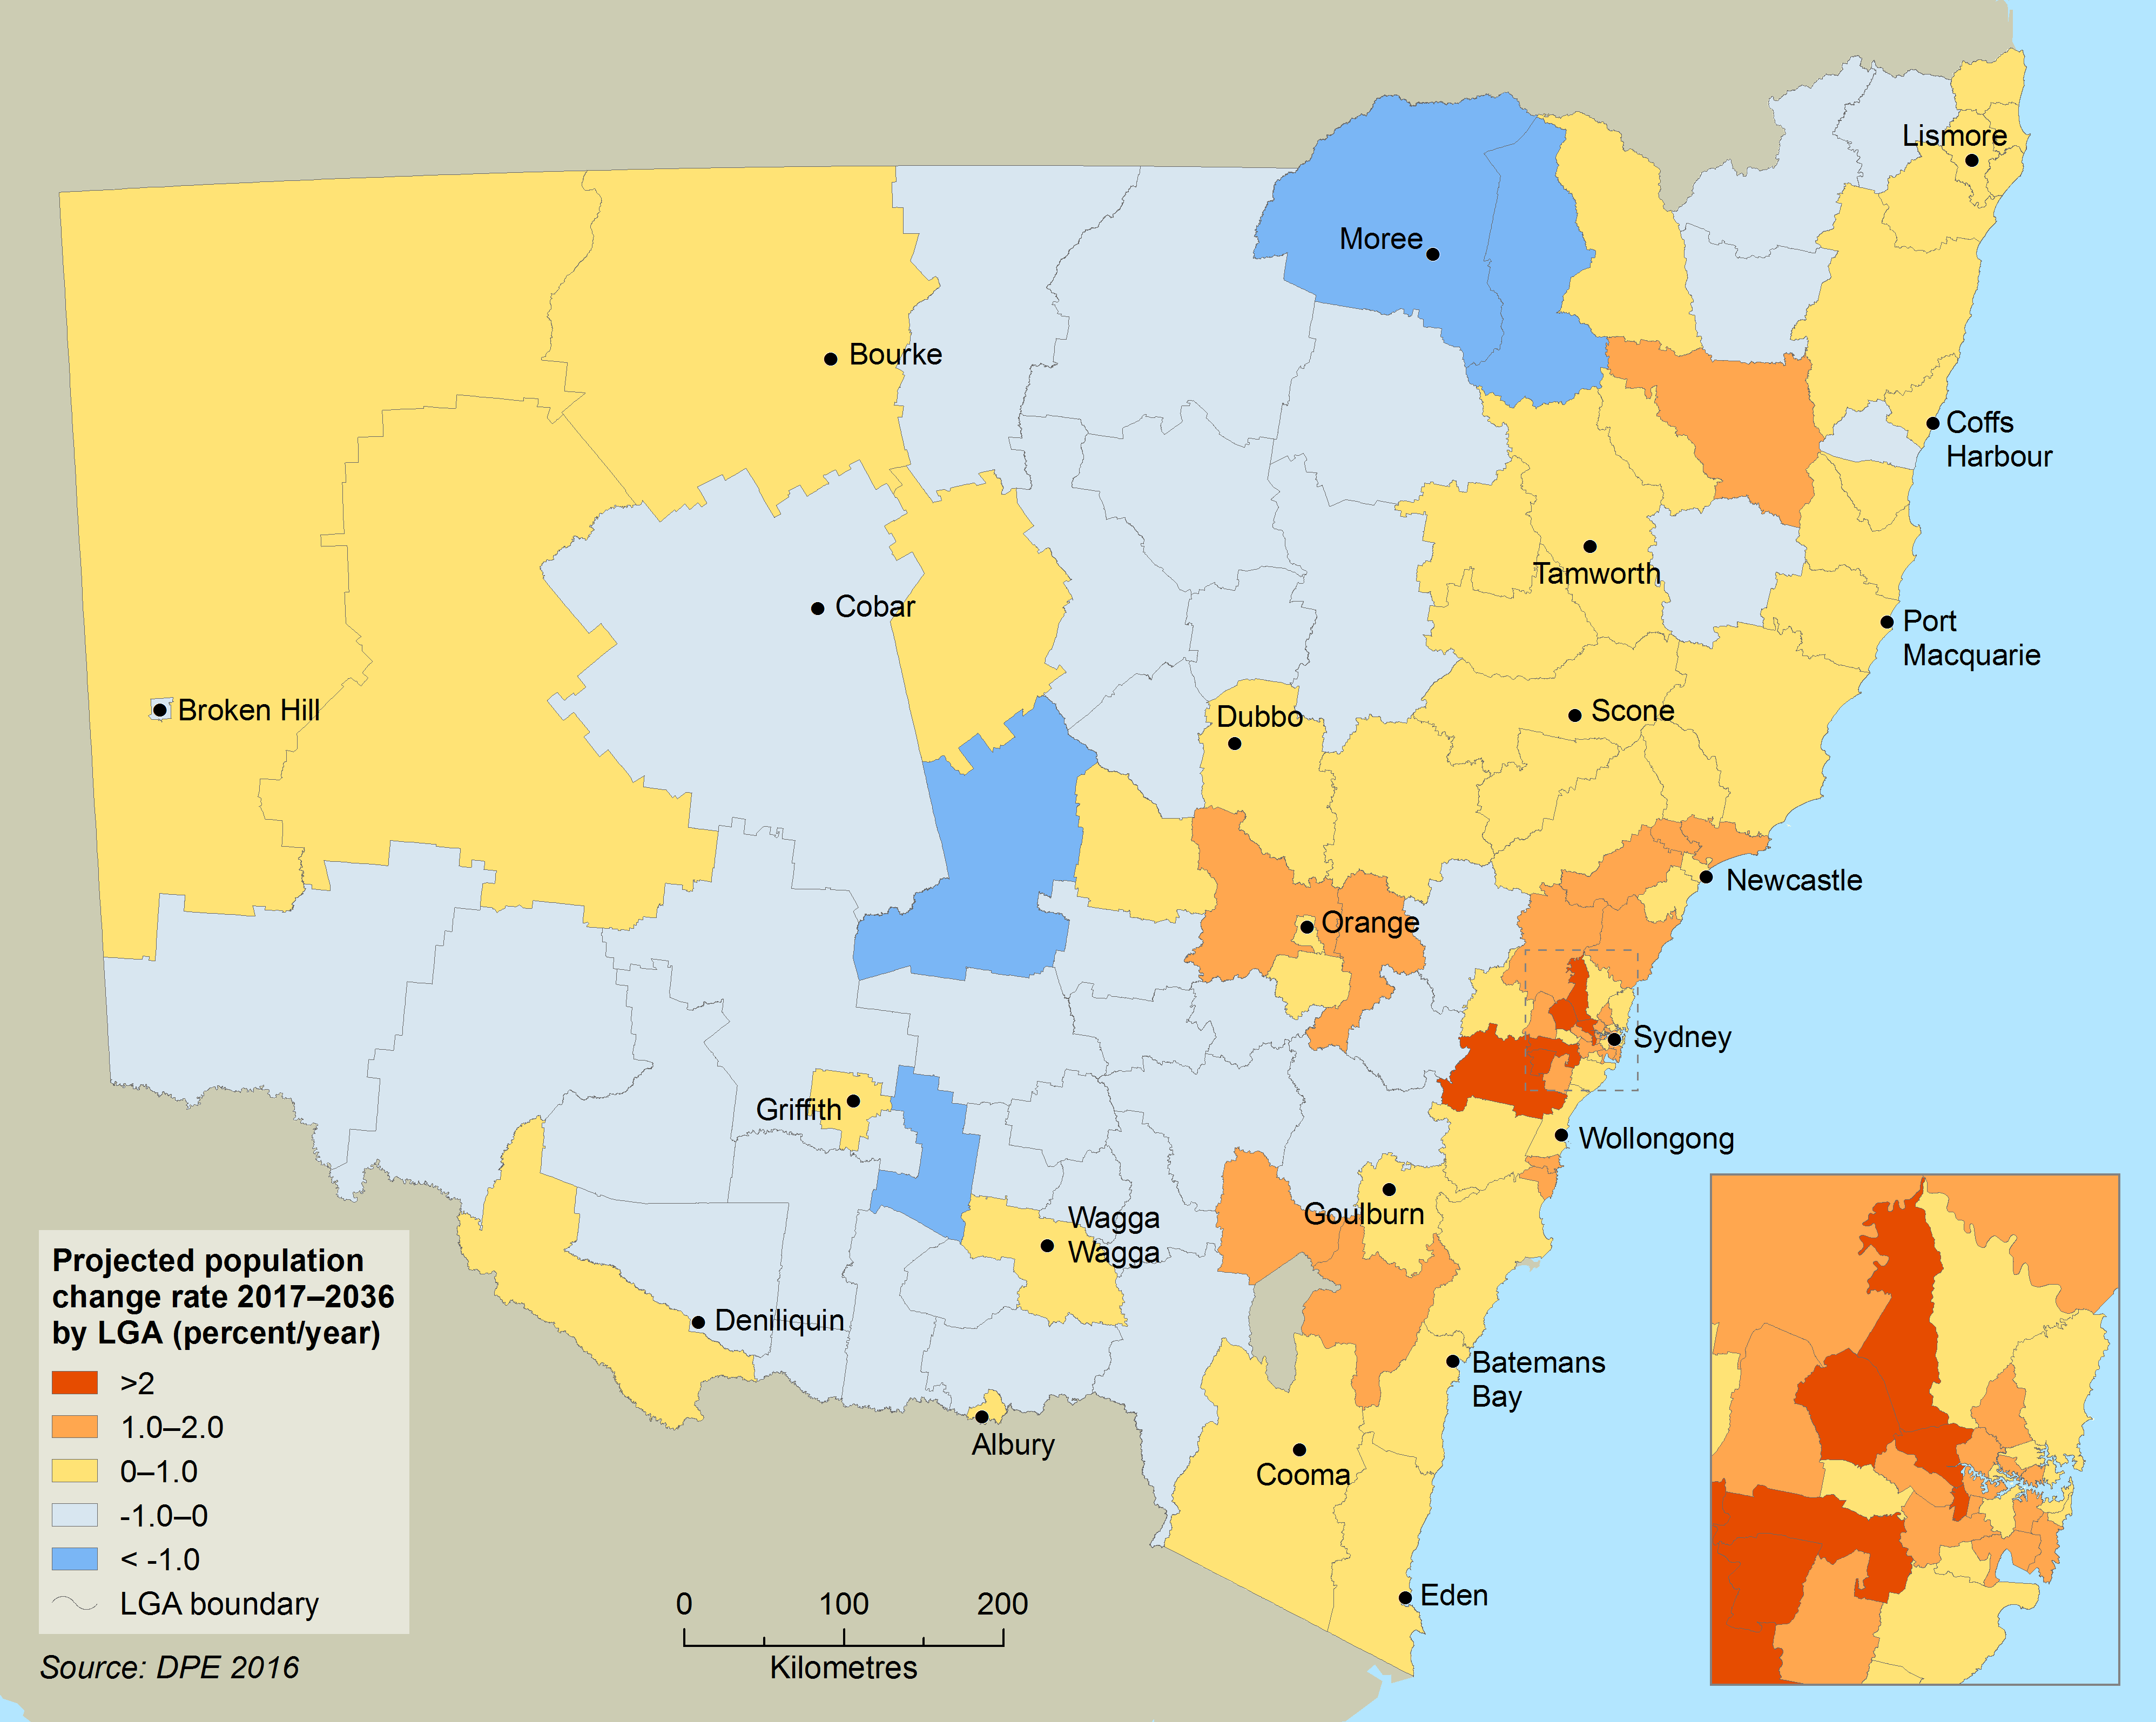
Growth projections
By 2036, the NSW population is projected to grow to 9.9 million people, with the majority – an additional 1.7 million people – living in Greater Sydney. Map 1.2 shows projected population change across the state between 2017 and 2036. Further detail is available at the NSW Population Projections website (DPE 2016).
Map 1.2: Projected population change, 2017-2036
Population density and distribution
In June 2017, there were 9.8 people per square kilometre in NSW, a 12% increase from 8.7 in 2008. Differences in population density throughout the state have implications for provision of services and strategic planning.
Higher densities require more energy, water and waste removal services to be provided within the existing urban footprint, but this can be offset by more efficient built environments and reduced demand for land on the urban fringe. It can reduce the impacts of transport and energy use by facilitating easier access to active transport (e.g. walking and cycling) and public transport. Well-designed urban areas with adequate green space also improve liveability and provide habitat for urban wildlife (Dexter et al. 2016, Hess at al. 2014).
See also Energy Consumption, Transport and Urban Water Supply topics
Population densities range from less than one person per square kilometre in the Far West region of NSW to more than 10,000 people per square kilometre in the inner-city suburbs of Darlinghurst, Potts Point, Pyrmont and Surry Hills.
Population density in Greater Sydney has grown steadily. With sustained population growth and management of urban fringe development, average population density in Greater Sydney has grown by 17% to almost 450 people per square kilometre since 2008 (see Figure 1.2). Even within Sydney there is a large variation in population density, which can be less than 50 people per square kilometre in some areas.
Figure 1.2: Population density of Greater Sydney, 2008–17
Outside of Sydney, high population densities are found in parts of Newcastle and Wollongong, and the regional centres of Tweed Heads, Coffs Harbour and Port Macquarie. These are also areas with higher population growth.
Population trends
Populations grow due to:
- natural increase – the difference between births and deaths
- migration – the movement of people to and from other parts of Australia and overseas.
Over the past 40 years, overseas migration has been the most significant contributor to population growth in NSW, with natural increase remaining relatively stable (ABS 2017).
General trends related to population growth and distribution across the state include:
- movement from both rural areas and Sydney to regional centres
- young people moving from rural areas to the cities
- retirees (‘tree changers’ and ‘sea changers’) moving to popular areas on the coast, along the Murray River and locations within easy driving distance of metropolitan areas
- an ageing population – 16% of the NSW population is 65 years or older (ABS 2017).
Alongside increased housing costs and structural changes to employment, these trends influence living arrangements.
In NSW, especially metropolitan areas, there has been a slight increase recently in the average number of people per household (see Figure 1.3). This may represent a reversal of the trend of the previous three decades, where the average size of households in NSW had been getting gradually smaller, especially in regional areas. The key environmental implication of smaller households is that proportionally more housing stock is needed as the population grows, with flow-on impacts on land, energy, water, waste and resource use.
Figure 1.3: Average household size in NSW, 1980–2016
Pressures
Population and environmental trends
The State of the Environment (SoE) reporting framework is based on the pressure-state-response model of reporting. Within this framework the topics of Population and Economic activity and the environment are treated as drivers of environmental change. However, the actual effects of population increase and economic activity on environmental resources and ecosystems depend on how increased demand for transport, land, food, housing, energy and potable water, and increased waste generation is managed.
Figure 1.4 shows changes in population and a number of environmental indicators relative to their levels in 2006, with all values for each indicator adjusted to a baseline of 100% for that year. Between 2006 and 2016 there was a steady increase in population, while most of the environmental indicators grew at a lesser rate or decreased.
Figure 1.4: NSW population growth compared to trends in energy, greenhouse gas emissions, transport, water and waste, 2006–16
Notes:
Energy data includes ACT; greenhouse and urban water data are for all of NSW; VKT = vehicle kilometres travelled on an average weekday (in Household Travel Survey Sydney area, counting vehicles and drivers only); MLA = metropolitan waste levy area.
Specifically, Figure 1.4 shows the following:
- Total energy use fluctuated during 2006–16, but by 2016 was at the same level as 2006, resulting in a reduction in energy consumption per capita. Emissions of greenhouse gases decreased during this period. Energy consumption has been dropping due to reduced demand from industry, increased uptake of renewable energy and greater efficiency of buildings and equipment. See Energy Consumption and Greenhouse Gas Emissions
- Overall household trips, measured by total vehicle kilometres travelled by drivers, increased, but at a lower rate than population growth because less trips are being made per household. The environmental impacts of increased traffic on roads include congestion, noise, air pollution and greenhouse gas emissions. See Transport and Air Quality
- Total waste generation, measured in the Sydney metropolitan waste levy area, reduced by 4% since it plateaued in 2012 and 2013 and waste generated per capita has declined since 2008. In populated areas, waste products (e.g. solid waste, sewage, hazardous waste and atmospheric emissions) need to be managed to avoid increased stress on natural ecosystems. See Waste and Recycling and Air Quality
- Overall urban water consumption dropped in response to water-saving policies and initiatives implemented during the millennium drought of 2003–2009 but has since started to rise again with population growth. A growing population requires more water for residential consumption and agriculture and puts pressure on the environmental health of river systems. See Urban Water Supply
The Australian State of the Environment Report 2016 includes a similar chart of selected socio-economic and environmental indicators to that shown in Figure 1.4. Broadly, this shows that NSW outcomes over the same time period are generally better than or similar to the national trend for common indicators.
Housing
A growing population, especially with a trend towards fewer people per dwelling, requires more housing. Based on current population projections, the NSW Government has identified that 725,000 additional homes will be needed by 2036 to meet demand.
Responses
Legislation and policies
While the NSW Government has firm population projections, it has not developed specific population targets, growth plans or limits to population growth.
In October 2018 the NSW Premier announced the appointment of an expert panel to develop a population policy for NSW. The panel will consider:
- the current rate of population growth and infrastructure pipeline
- how long it will take for infrastructure to catch up with population growth rates
- NSW’s role at upcoming population discussions with the Commonwealth Government.
The Panel will also recommend next steps for more detailed work on the issue of population.
A number of plans have been developed to respond to the potential impacts of population change.
The Greater Sydney Region Plan
The Greater Sydney Region Plan: A Metropolis of Three Cities is the NSW Government’s 40-year vision for the Greater Sydney Region.
The plan aims to re-balance growth and deliver benefits more equitably to residents across Greater Sydney. Prepared concurrently with Future Transport 2056 and the State Infrastructure Strategy 2018–2038, it aligns land use, transport and infrastructure planning to reshape Greater Sydney as three unique and connected cities: the Western Parkland City, the Central River City and the Eastern Harbour City.
It will boost productivity by bringing together good jobs and skilled workers; make Greater Sydney’s suburbs more liveable as they grow through a place-based design approach; and make the three cities more sustainable by protecting the natural environment and open spaces.
Regional Plans
The NSW Government has 10 Regional Plans in place across the state that play a critical role in how natural resources are managed to ensure the prosperity and productivity of the NSW economy, as well as the health of local communities and the environment.
Regional Plans are long-term strategic planning documents that articulate a vision and plan for housing, jobs and community infrastructure to meet the needs of a changing population. Each Regional Plan also includes goals and actions to protect the environment and encourage sustainable use of resources, tailored to suit the region.
NSW Premier’s Priorities
The Premier’s Priority Delivering Infrastructure aims to deliver metropolitan, regional and local infrastructure projects to support an anticipated 113% increase in train trips, 30% increase in car trips (2018 State Infrastructure Strategy) and 40% more households (2016 NSW population and household projections) by 2036. These initiatives include new public transport developments.
See also the Responses sections in the Transport, Energy Consumption and Climate Change topics.
Waste
Waste management in NSW is guided by the Waste Avoidance and Resource Recovery (WARR) Strategy 2014–21 (EPA 2014), which, as noted in relation to Figure 1.4, has facilitated a decrease in per capita waste generation rates and total waste generation.
In 2017, a draft NSW Waste and Resource Recovery Infrastructure Strategy 2017–21 was released for consultation to assist the waste industry to understand expected increases in waste streams and to plan sufficient processing infrastructure capacity.
See also the Responses sections in the Waste and Recycling topic
Water
The 2017 Metropolitan Water Plan sets out strategies and programs for ensuring a sustainable water supply to meet the needs of the people and environment of Greater Sydney. The NSW Government has also developed initiatives for water and sewerage for towns in regional NSW, such as integrated water cycle management.
See also the Responses sections in the Urban Water Supply topic.
Programs
A range of NSW Government programs helps reduce the impacts of population growth. Many of these are discussed in the Energy Consumption, Waste and Recycling, Greenhouse Gas Emissions, Urban Water Supply and Transport topics. Some key programs addressing sustainability in urban environments are discussed below.
The Sydney Green Grid provides a framework for projects that will enhance liveability and biodiversity and increase ecological resilience by delivering an interconnecting network of open space throughout the city. This network includes parks, bush, creek corridors, transport routes, suburban streets, footpaths and cycleways.
The Metropolitan Greenspace Program (MGP) supports local councils in Greater Sydney and the Central Coast to improve regional open space by co-funding projects to deliver the Green Grid network. Since 1990, the program has awarded over $45 million to more than 620 projects.
The Building Sustainability Index (BASIX) is an integral part of the development assessment system in NSW. It sets energy and water saving targets, and minimum thermal comfort performance requirements for all new residential dwellings and significant renovations. Since the introduction of BASIX in 2004, the NSW Government estimates 460,000 homes have saved 202,000 megalitres of potable water and reduced carbon emissions by 6.3 million tonnes (DPE 2015).
Future opportunities
Reducing the environmental impacts of population growth can be achieved with careful management. The plans for Greater Sydney and regional areas outlined in this topic contain many elements that will improve sustainability outcomes.
In addition to these plans, the draft NSW Government Greener Places green infrastructure policy, when finalised, will guide urban planning, design and management to improve the network of green spaces. This will help reduce the urban heat island effect, improve biodiversity and increase access to walking and cycling pathways. The policy applies statewide and links to the existing Sydney Green Grid program and sustainability objectives in the Greater Sydney Region Plan.
There are also opportunities to investigate each impact area at a strategic level and analyse the per capita reductions that would be needed to manage the impact of population growth. This will help define responses, including the possibility of setting new targets for key impact areas as part of the planning process.
References
References for Population
ABS 2016, Census of Population and Housing - QuickStats, Community Profiles and DataPacks User Guide, Australia 2016, cat. no. 2916.0, Australian Bureau of Statistics, Canberra
ABS 2017, Australian Demographic Statistics, June 2017, cat. no. 3101.0, Australian Bureau of Statistics, Canberra [www.abs.gov.au/AUSSTATS/[email protected]/allprimarymainfeatures/30125843DE7F366ECA2582570013F5FE?opendocument]
ABS 2018, Regional Population Growth, Australia, 2017, cat. no. 3218.0, Australian Bureau of Statistics, Canberra [www.abs.gov.au/AUSSTATS/[email protected]/Lookup/3218.0Main+Features12016-17?OpenDocument]
DEE 2018a, Australian Energy Statistics, Table B, August 2018, Department of the Environment and Energy, Canberra [www.energy.gov.au/sites/g/files/net3411/f/table-b_2018.xlsx]
DEE 2018b, State and Territory Greenhouse Gas Inventories 2016, Department of the Environment and Energy, Canberra [www.environment.gov.au/climate-change/climate-science-data/greenhouse-gas-measurement/publications/state-and-territory-greenhouse-gas-inventories-2016]
Dexter CE, Appleby RG, Edgar JP, Scott J & Jones DN 2016, ‘Using complementary remote detection methods for retrofitted eco-passages: A case study for monitoring individual koalas in south-east Queensland’, Wildlife Research, 43, pp. 369–79 [doi.org/10.1071/WR15153]
DPE 2015, BASIX scores and savings, Department of Planning and Environment, Sydney [www.datareporting.planning.nsw.gov.au/basix-reporting-overview]
DPE 2016, New South Wales State and Local Government Area Population Projections: 2016, Department of Planning and Environment, Sydney [www.planning.nsw.gov.au/en-AU/Research-and-Demography/Demography/Population-Projections]
EPA 2014, NSW Waste Avoidance and Resource Recovery Strategy 2014–21, Environment Protection Authority, Sydney [www.epa.nsw.gov.au/publications/wastestrategy/140876-warr-strategy-14-21]
EPA 2017, Waste and Resource Recovery Infrastructure Strategy 2017–21: Draft for consultation, Environment Protection Authority, Sydney [www.epa.nsw.gov.au/your-environment/recycling-and-reuse/warr-strategy/draft-nsw-warr-infrastructure-strategy-2017-2021]
GSC 2018, Greater Sydney Regional Plan: A Metropolis of Three Cities – Connecting People, Greater Sydney Commission, Sydney [www.greater.sydney/metropolis-of-three-cities]
Hess GR, Moorman CE, Thompson J & Larson, CL 2014, ‘Integrating wildlife conservation into urban planning’, Urban Wildlife Conservation: Theory and Practice, pp. 239–78, doi: 10.1007/978-1-4899-7500-3_12 [courtneylarson.weebly.com/uploads/5/3/7/0/53709561/hess-etal2012_wildlifecons_urbanplanning.pdf (PDF 1.6MB)]
NSW, various agencies 2008–17, Water Supply and Sewerage: NSW Benchmarking Reports, Table 8 [www.industry.nsw.gov.au/water/water-utilities/best-practice-mgmt/performance-monitoring]
TfNSW 2018, Future Transport 2056, Transport for NSW, Sydney [future.transport.nsw.gov.au]