Population 2021
Population growth is a key driver of changes to the environment caused by humans.
NSW State of the Environment
This is the 2021 SoE online report.
Summary
The NSW population has continued to increase at an annual average growth rate of 1.4% between 2015 and 2020.
Why population growth is a driver of environmental change
Population growth can be a significant driver of environmental impacts. In NSW, a rising population accompanied by growing urbanisation has led to greater demand for housing, land, energy, water, consumer products and transport services, and can increase energy, water and resource use, and the generation of waste and emissions.
Status and Trends
By June 2020, 8.17 million people were living in NSW, 61% of whom resided in Greater Sydney. Over the five-year period from June 2015 to June 2020, the state’s population grew by more than 550,000 people. However, the rate of growth has started to slow.
Spotlight figure 1 shows population growth rising at a steady rate between 2010 and 2016, with a peak in 2016–17 (coinciding with a peak in the number of overseas students studying in NSW) and growth at a slower rate between 2017 and 2020.
Population density in NSW has also risen. In June 2020, there were an average of 10.2 people per square kilometre – a 7.4% rise since 2015. Across Greater Sydney, the average density reached almost 480 people per square kilometre – 41 more than in 2015.
By 2041, the NSW population is expected to grow to 10.57 million with most of the increase in Greater Sydney. The challenge will be to manage projected population growth alongside environment protection and conservation, and maintain liveability.
Spotlight figure 1: Population growth in NSW, Greater Sydney* and regional NSW 2009–20
Notes:
* Greater Sydney extends from Hawkesbury River in the north to Royal National Park in the south and includes the Blue Mountains, Wollondilly and Hawkesbury local government areas in the west. The historic results have been updated to reflect the definition of Greater Sydney as not including the Central Coast.
** 2019 figures are revised ABS estimates and subject to change.
^ 2020 figures are preliminary ABS estimates and subject to change.
Pressures
Over the past 40 years, natural population increases have been fairly stable while overseas migration has been a significant contributor to growth. However, during the closure of international borders due to the COVID-19 pandemic, overseas migration was temporarily not a major driver of population growth. The 2021 NSW Budget forecast negative population growth for the state of –0.1% in 2021–22, before a gradual rise to 1.2% in 2024–25.
Response
The NSW Government has developed long-term plans for Greater Sydney and regional NSW. The plans aim to provide for sustainable and resilient development with a balanced approach to the use of land and water resources, while enhancing liveability and protecting the natural environment.
Other strategies for reducing environmental impacts of urbanisation and a growing population include the Waste and Sustainable Materials Strategy, the Sydney Green Grid framework for enhancing quality of open space, Future Transport 2056, NSW Government’s Net Zero Plan and the NSW Water Strategy.
Related topics: | | |
Context
An understanding of the dynamics of the NSW population is critical when devising strategic planning processes for:
- environment protection
- enhanced liveability
- sustainable land use
- management of the impacts of population growth on the environment
- reducing the link between population growth and increased resources and energy use.
Status and Trends
Population growth
At 30 June 2020, almost 8.17 million people called NSW home, with 5.02 million (or 61% of them) living in Greater Sydney, 1.87 million (23%) in coastal areas and 1.28 million (16%) inland. The state’s population grew by an average 110,300 people a year over the five years to 30 June 2020, an annual growth rate of 1.4% (see Table 1.1).
In this topic, unless otherwise noted, all references to a particular year mean the 12 months ending 30 June of that year.
Table 1.1: Population of NSW and its regions 2015 and 2020
| Region | Population at 30 June | Population change 2015–20 | ||
|---|---|---|---|---|
| 2015 | 2020* | Number | Annual growth rate (%) | |
| Greater Sydney | 4,596,872 | 5,021,330 | 424,458 | 1.8 |
| Coastal NSW** | 1,783,839 | 1,869,938 | 86,099 | 0.9 |
| Inland NSW^ | 1,235,457 | 1,276,264 | 40,807 | 0.7 |
| NSW | 7,616,168 | 8,167,532 | 551,364 | 1.4 |
Notes:
* Preliminary estimates.
** ‘Coastal NSW’ comprises all local government areas with coastal boundaries outside Greater Sydney.
^ ‘Inland NSW’ comprises all areas not included in Greater Sydney or Coastal NSW.
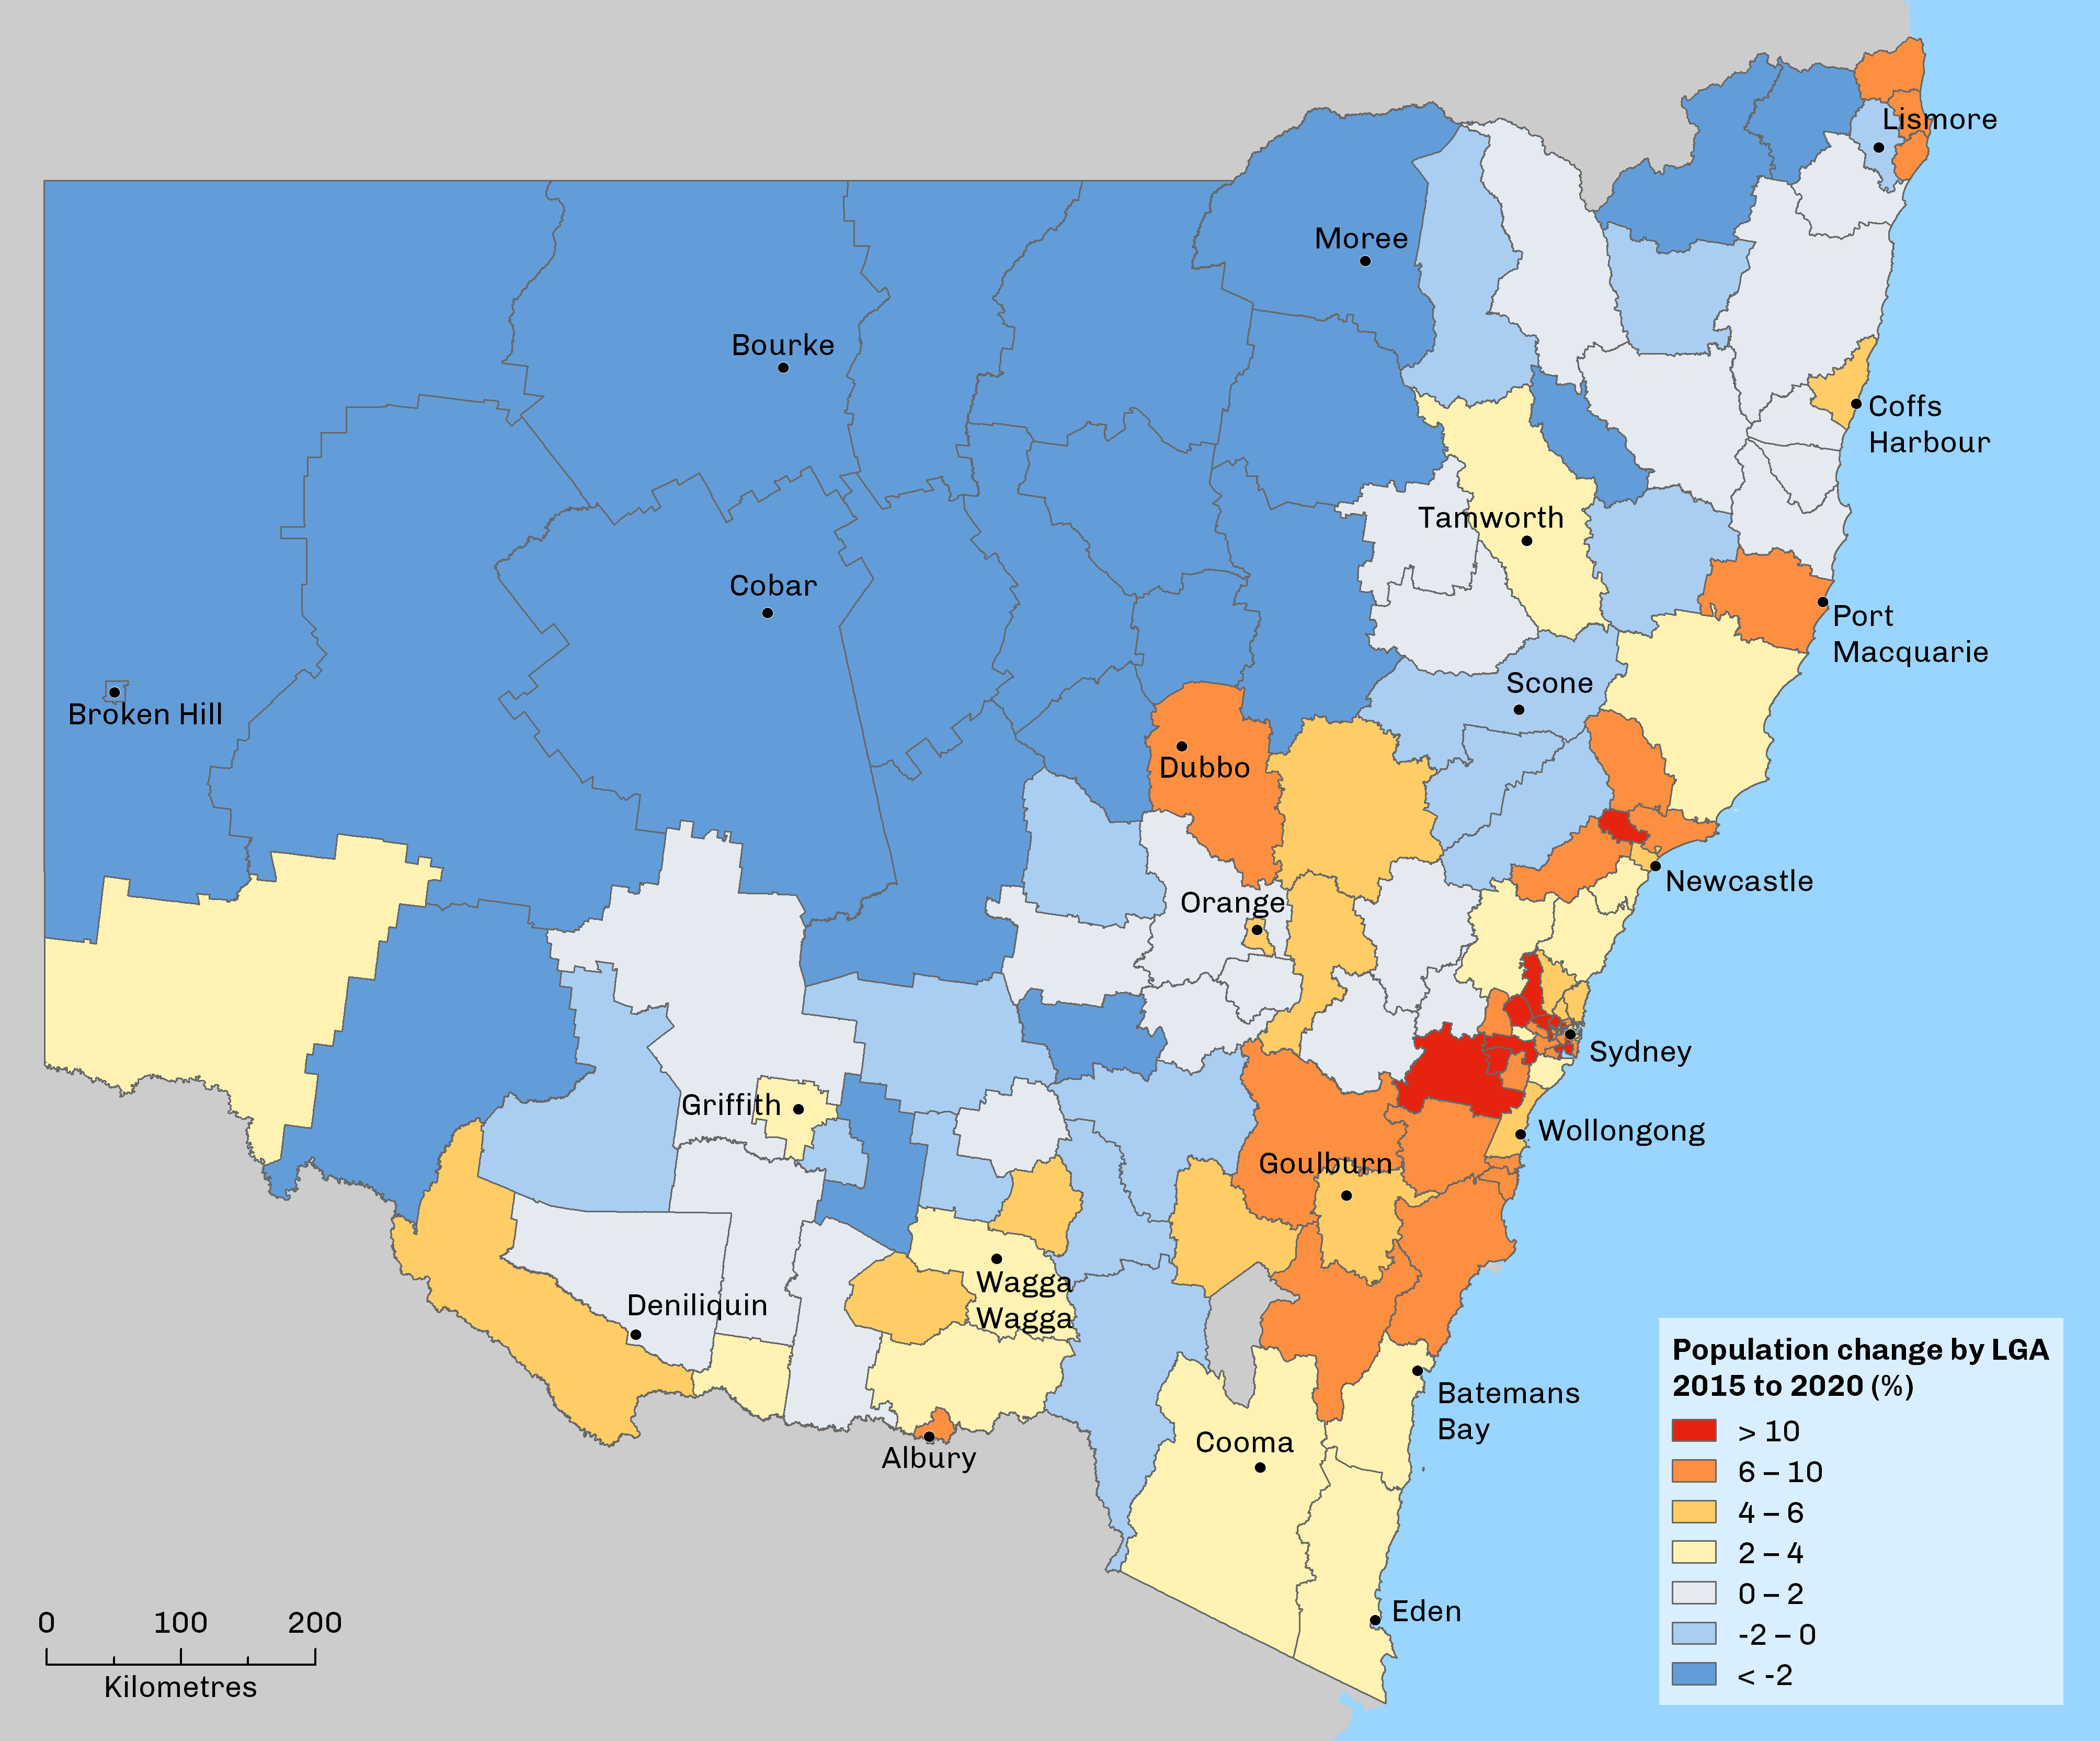
Between 2015 and 2020, the north-west and south-west regions of Sydney showed the highest growth, while the lowest occurred in north-west and western NSW (see Map 1.1).
Greater Sydney
Over the five years to June 2020, Greater Sydney’s population increased by almost 425,000 people or over 9%. Within Greater Sydney, the largest population increases were in the local government areas (LGAs) of Blacktown (43,400), Sydney (34,700) and Camden (33,700) ().
Regional NSW
Between 2015 and 2020, the population of regional NSW, which includes coastal NSW and inland NSW, increased by 4.2%. Growth was substantial in areas closer to Sydney (the Central Coast, Wollongong and Maitland) and the state’s larger regional centres (Port Macquarie, Tweed and Queanbeyan-Palerang). The largest population declines occurred in those parts already sparsely populated, such as Broken Hill and Moree Plains.
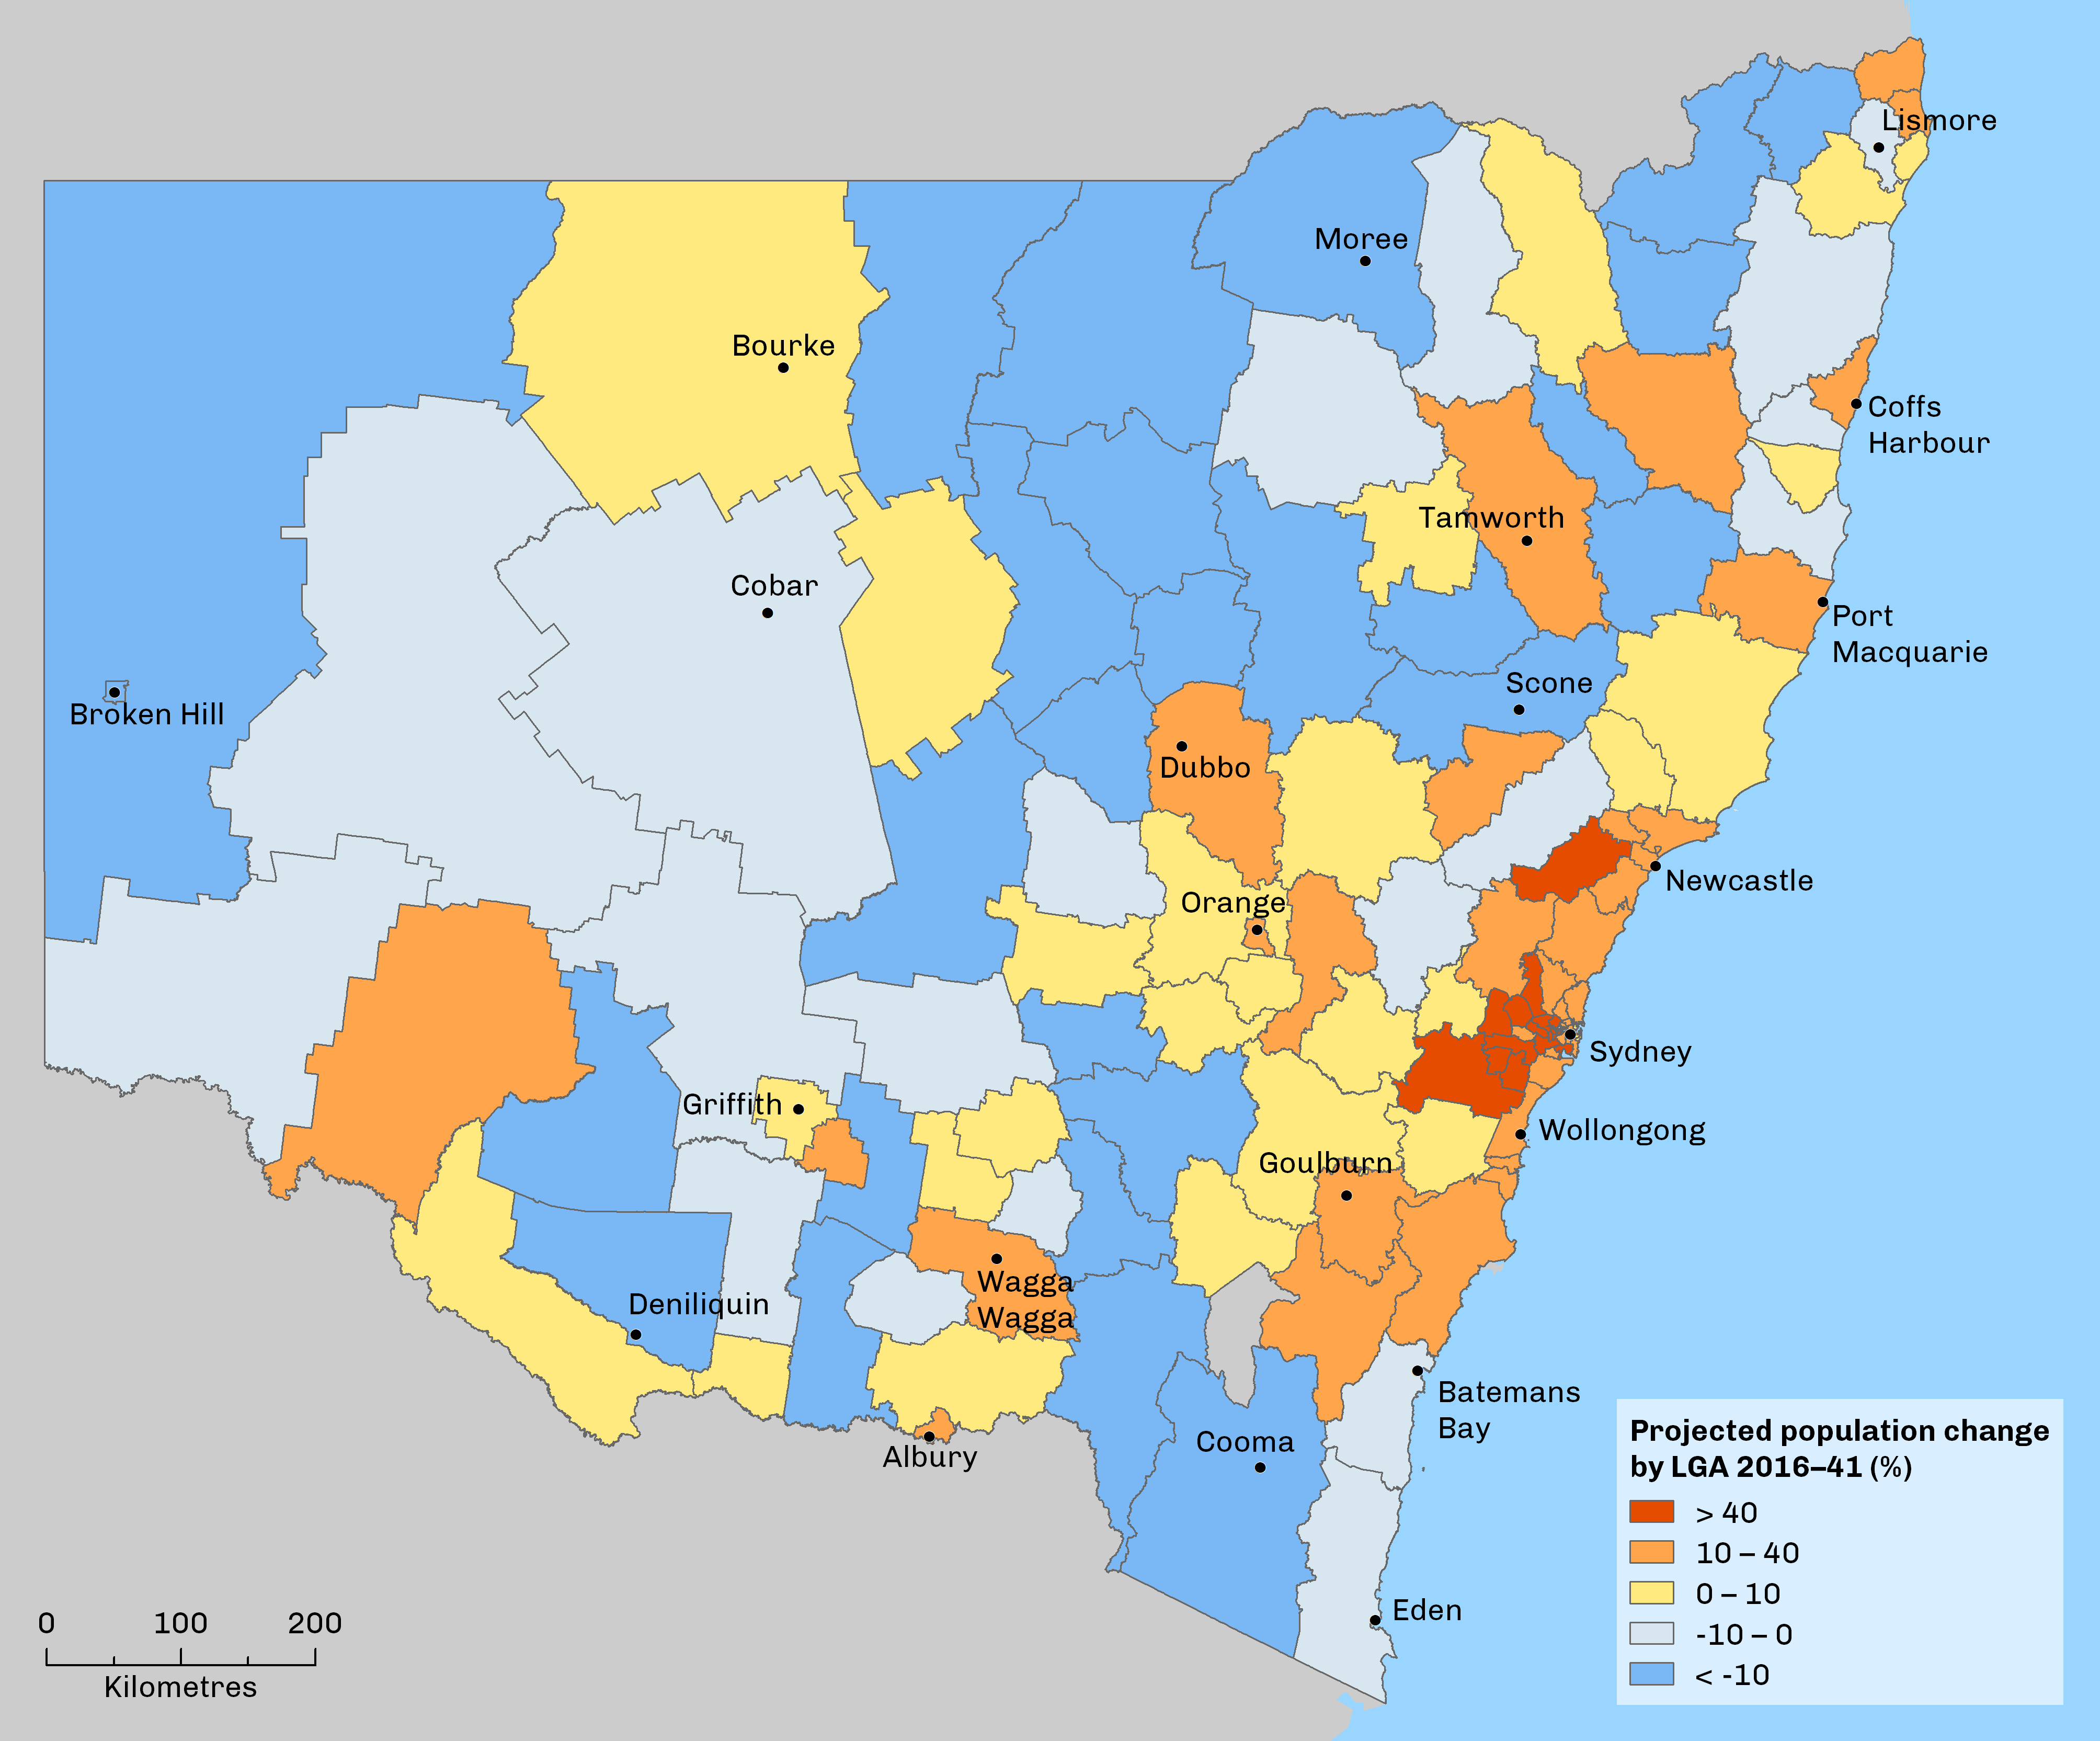
Growth projections
By 2041, the NSW population is expected to grow to 10.57 million people, with Greater Sydney’s population forecast to reach around 7.1 million by 2041. Map 1.2 shows projected population change across the state between 2016 and 2041. Further detail on projections is available at the NSW Population website ().
Map 1.2: Projected population change 2016-2041
Population density and distribution
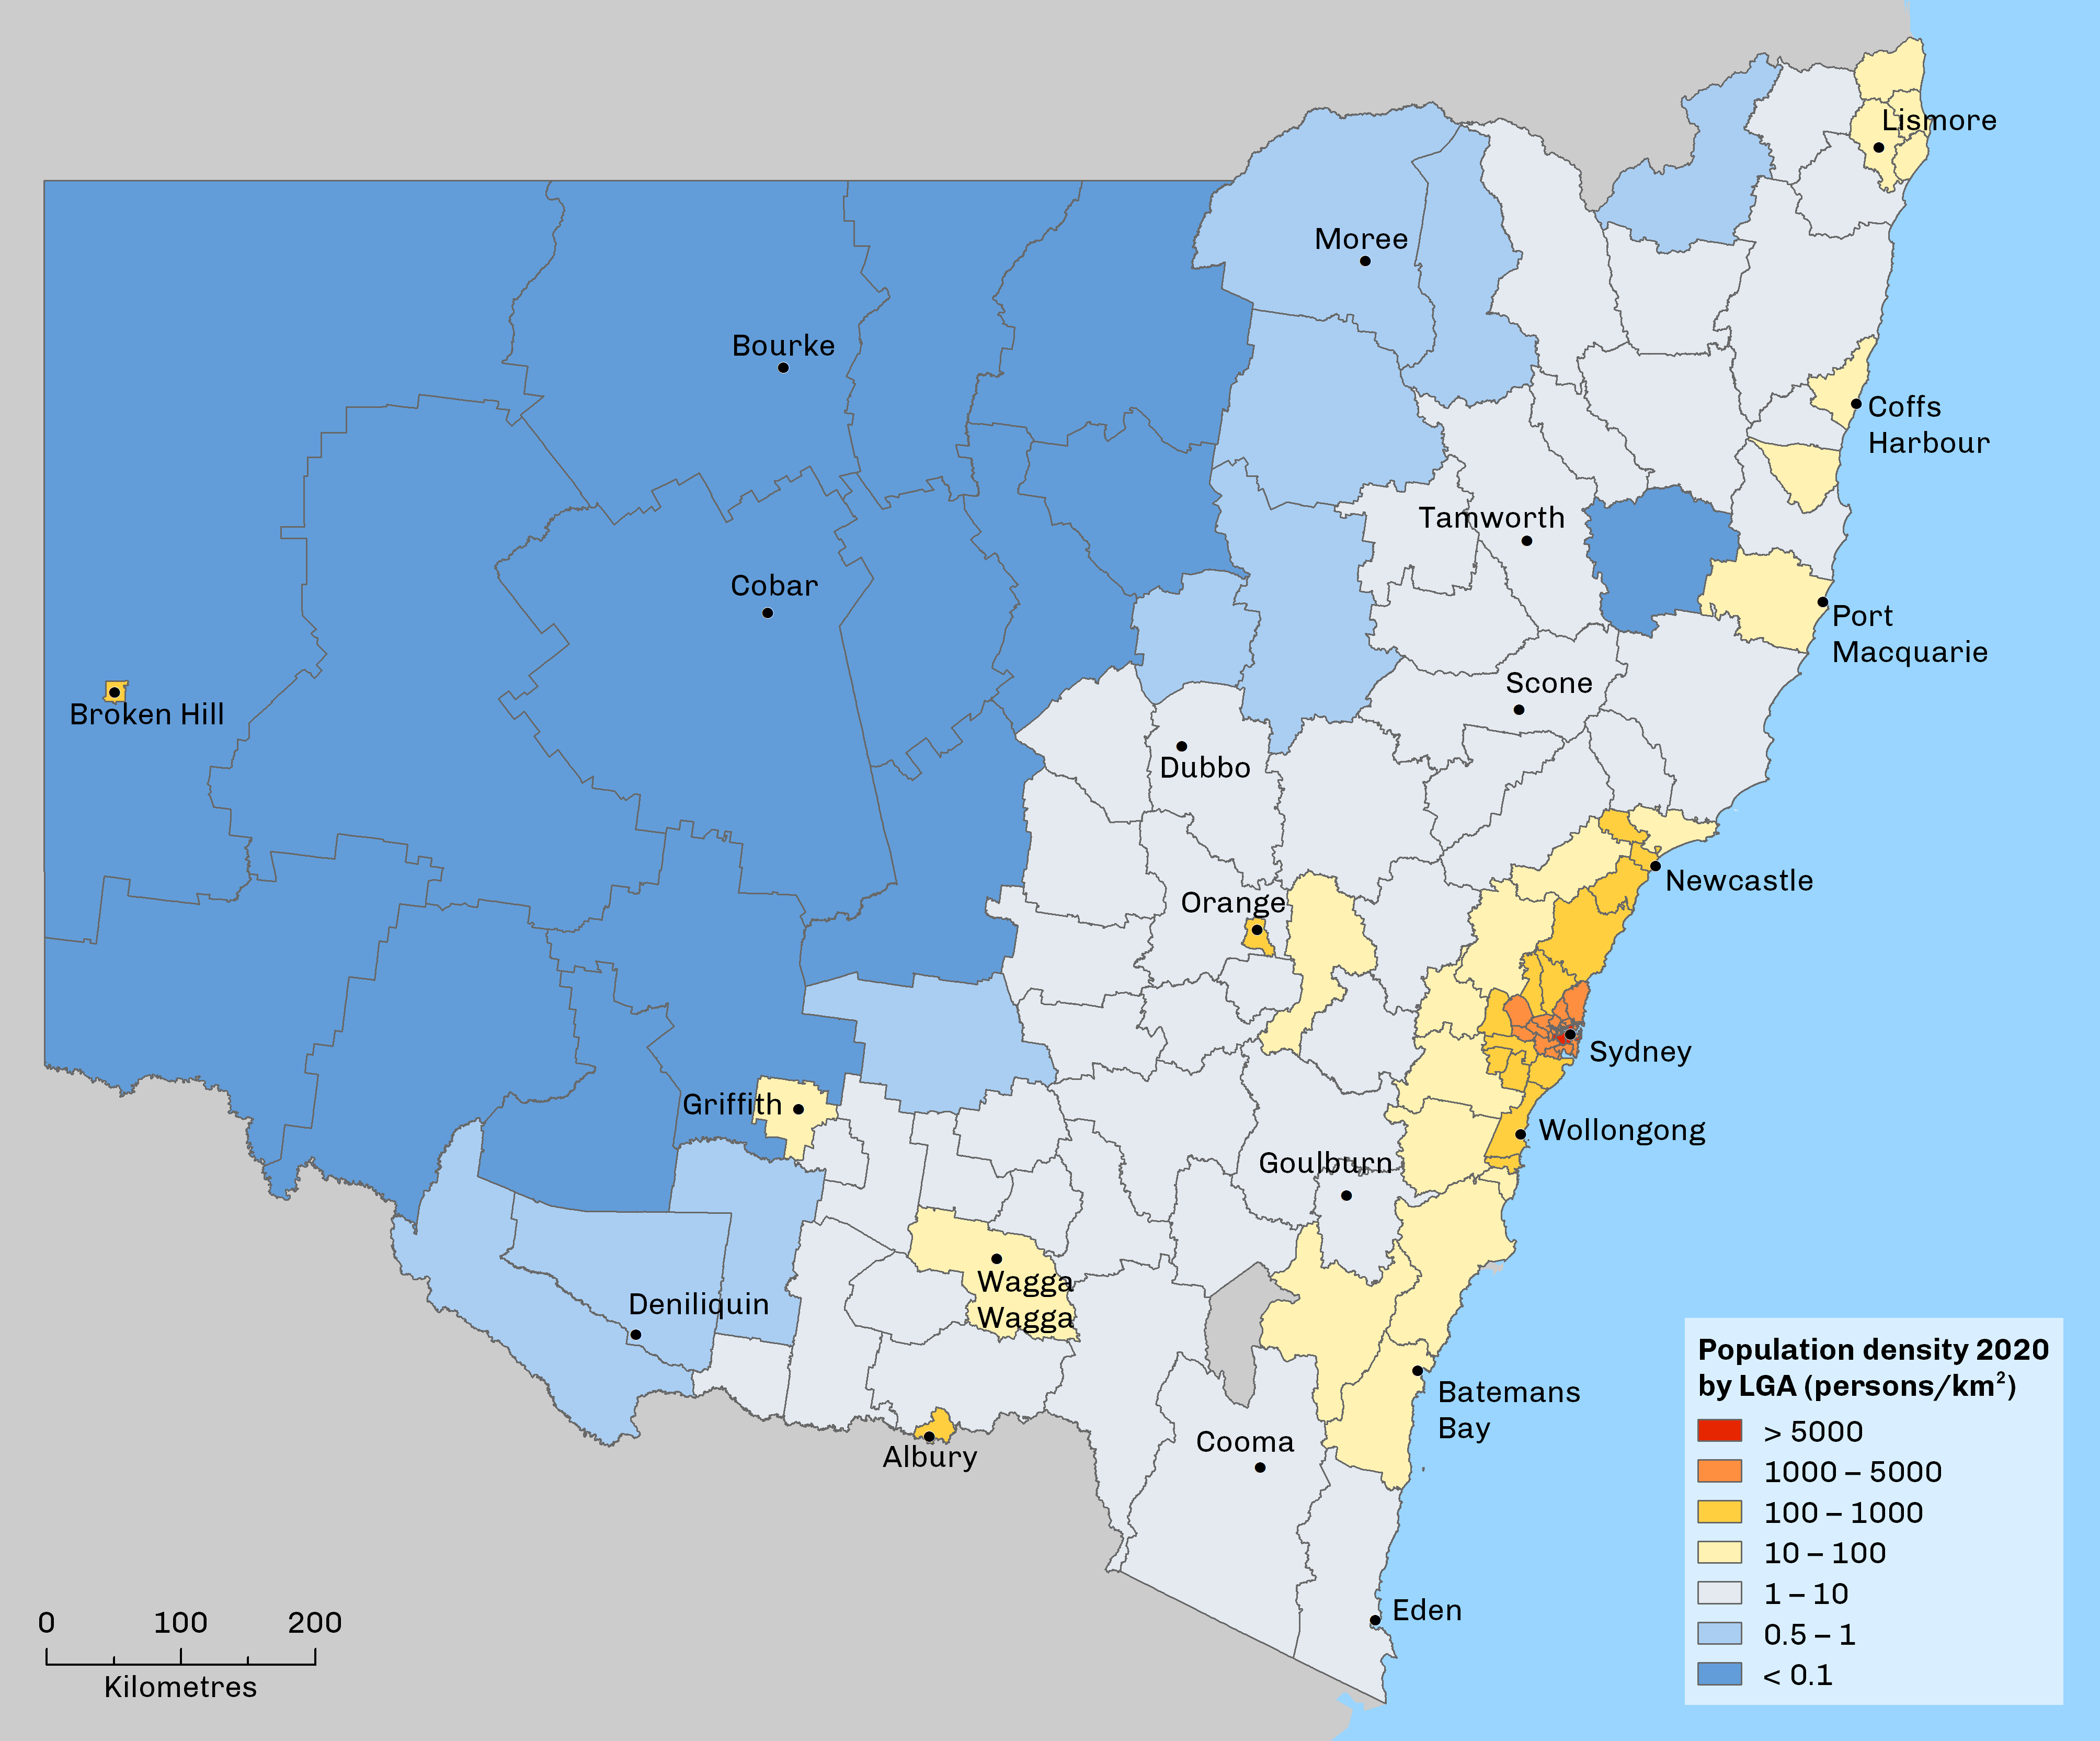
In June 2020, there were 10.2 people per square kilometre in NSW, a 7.4% increase from the density of 9.5 people per square kilometre in 2015. Differences in population density around the state have implications for the provision of services and strategic planning.
Higher densities can increase the efficiency of delivery, and reduce the per-person use of energy, water and waste removal services and also reduce the demand for land on the urban fringe. The impacts of transport and its associated energy use can also be reduced by facilitating easier access to active transport (such as walking and cycling) and public transport (). Well-designed urban areas with adequate green space also improve liveability and provide habitat for urban wildlife (, ). See also , , and topics.
Population densities range from less than one person per square kilometre in the Far West region of NSW to more than 15,000 people per square kilometre in the inner-city suburbs of Potts Point, Pyrmont and Darlinghurst.
With sustained population growth and management of urban fringe low density development, average population density in Greater Sydney grew by 9% between 2015 and 2020 from 439 to 480 people per square kilometre. However, there is a large variation in population density within Sydney, which has as little as 50 people per square kilometre in some areas.
Map 1.3: Population density of NSW 2020
Demographic drivers
Age profile
Age profiles differ across NSW and can be considered a demographic driver contributing to the varied population growth across the state. More children and especially younger working age people live in Greater Sydney with natural change and overseas migration sustaining growth (Figure 1.1). The number of retirees is similar in both Regional NSW and Greater Sydney.
Household size
In NSW, especially metropolitan areas, the 2016 census maintained the average number of people per household (see Figure 1.2). This was a reversal of the trend of the previous three decades, where the average size of households in NSW had been getting gradually smaller, especially in regional areas. The environmental implications of smaller households can be that proportionally more housing stock is needed as the population grows, with the potential for flow-on impacts on land, energy, water, waste and resource use.
Figure 1.2: Average household size in NSW 1980–2016
Notes:
The 2021 census data will be available in 2022.
Pressures
Population growth
Populations grow because of:
- natural increase – the difference between births and deaths
- migration – the movement of people to and from other parts of Australia and overseas.
Over the past 40 years, overseas migration has been the most significant contributor to population growth in NSW, with natural increase remaining relatively stable ().
General trends related to population growth and distribution across the state include:
- movement from both rural areas and Sydney to regional centres
- young people moving from rural areas to the cities
- retirees (‘tree changers’ and ‘sea changers’) moving to popular areas on the coast, along the Murray River and locations within easy driving distance of metropolitan areas
- an ageing population – 16.7% of the NSW population is 65 years or older ().
Alongside increased housing costs and structural changes to employment, these trends influence living arrangements.
Events in NSW, other parts of Australia and globally, such as a lengthy drought, bushfires, the COVID-19 pandemic and the resulting economic recession, have had a profound impact on population change in Australia.
The closure of Australia’s international borders in March 2020 due to COVID-19 has had a major impact on a key driver of population change, overseas migration. This led to a 99% fall in the number of people both leaving and arriving in Australia ().
In 2019–20, the NSW economy contracted for the first time in recorded history, due to the impacts of COVID-19 pandemic (). The economy is a key driver of population change in NSW. In its 2021–22 budget, the Australian Government predicted two consecutive years of population decline for NSW with – 0.2% growth before a return to 1.2% in 2024–25 (). This was echoed in the NSW Treasury Budget in June 2021 which forecast zero population growth for the state in 2020–21, followed by negative growth of – 0.1% the following year, gradually recovering to 1.2% in 2024–25 ().
Population and environmental trends
The State of the Environment reporting framework is based on the pressure-state-response model of reporting. Within this framework, the topics of and are treated as drivers of environmental change. However, the actual effects of population increase and economic activity on environmental resources and ecosystems depend on how increased demand for transport, land, food, housing, energy, and potable water and greater generation of waste are managed.
Figure 1.3 shows changes in population and a number of environmental indicators relative to their levels in 2005, with all values for each indicator adjusted to a baseline of 100% for that year. Between 2005 and 2019, waste generated surpassed the population growth trend, while the other environmental indicators grew at a lesser rate, except for greenhouse gases which decreased.
Figure 1.3: NSW population growth compared to trends in energy, greenhouse gas emissions, transport, water and waste 2006–20
Notes:
(population). Population figures change over time with the ABS’s Estimated Resident Population (ERP) data changing from preliminary to revised to final as new component data becomes available. Preliminary ERP is updated every quarter due to revisions to the component data for earlier quarters. ERP gets marked as revised once it can be expected not to change again until the final update, 22 months after the next Census.
DISER 2020 (energy). Energy data includes the ACT. Energy consumption totals have changed from previously published figures due to a change in methodology on how industrial sector energy consumption is calculated. ‘Coal by-products’ data is not included in the ‘fuel consumed’ total, but in the total energy consumption figure.
DPIE 2021a LWU Performance Reporting Data Dashboard, BOM 2020, BOM 2019 (urban water) includes Sydney Water Corporation (SWC), Hunter Water (HW), and all local water utilities (LWUs) in Regional NSW. Previous reporting excluded data for LWUs serving less than 10,000 properties, this data is now included in the full set of figures back to 2005-06.
EPA data 2021 (waste). Waste total generation data (including domestic, plus commercial and industrial waste including building and construction) updated for whole of NSW as previous data only related to the Metropolitan Levy Area (MLA). Prior to 2015–16, data was only available on a two-yearly basis [values being confirmed]
DISER 2020 (greenhouse gas) from the State and Territory Greenhouse Gas Inventories 2019. Greenhouse gas data covers all of NSW.
ABS 2006, ABS 2008, ABS 2010, ABS 2012, ABS 2014, ABS 2018, ABS 2020c (vehicle kilometres travelled). ABS survey of motor vehicle use conducted approximately every two years. NSW total calculated from the NSW percentage of the Australian total vehicle kilometres travelled.
Figure 1.3 shows the following:
- Total energy use fluctuated between 2007 and 2015, but in more recent years has since settled to levels similar to the 2005–07 period. Energy consumption has been dropping due to reduced demand from industry, increased uptake of renewable energy and greater efficiency of buildings and equipment. See
- Emissions of greenhouse gases have generally decreased over the full period reported, although there was a slight out-of-trend increase in 2017–18. See .
- Overall household trips increased as measured by total vehicle kilometres travelled by drivers (VKT), but at a lower rate than population growth because fewer trips are being made per household. The environmental impacts of increased traffic on roads include congestion, noise, air pollution and greenhouse gas emissions. See and .
- Total waste generation shows an increase. In populated areas, waste products (such as solid waste, sewage, hazardous waste and atmospheric emissions) need to be managed to reduce increased stress on natural ecosystems. See and .
- Water usage is sensitive to weather patterns and water availability. For urban water consumption, prior to the 2017–2020 drought, the trend was showing an increase in urban water use, generally tracking population growth. In the past three years, since the 2017–18 peak of 1,019GL, consumption has trended downwards most likely as a result of water restrictions, water efficiency measures and behaviour change amongst users. See . Of note, agriculture is the largest user of bulk water, for detail on water extraction and environmental share of available water see .
The Australian State of the Environment Report 2016 includes a similar chart to Figure 1.3 comparing population growth with selected socio-economic and environmental indicators. This broadly shows that NSW outcomes over the same time period are generally better than or similar to the national trend for common indicators.
Responses
Legislation and policies
While the NSW Government uses population projections to inform its strategic planning, infrastructure investment and service delivery, it does not develop specific population targets and growth plans or set limits to population growth.
Recognising the need to plan for future population change, the NSW Government has developed a number of strategic plans which set out a vision for NSW into the future.
Greater Sydney Region Plan
The Greater Sydney Region Plan: A metropolis of three cities () is the NSW Government’s 40-year vision for the region.
The plan aims to rebalance growth and deliver benefits more equitably to residents across Greater Sydney. Prepared concurrently with Future Transport 2056 () and the State Infrastructure Strategy 2018–2038 (), it aligns land use, transport and infrastructure planning to reshape Greater Sydney as three unique and connected cities: the Western Parkland City, the Central River City and the Eastern Harbour City.
The plan aims to boost productivity by
- bringing together good jobs and skilled workers
- making Greater Sydney’s suburbs more liveable as they grow through a place-based design approach
- making the three cities more sustainable by protecting the natural environment and open spaces.
Future Transport 2056 sets out the vision for a transport system which is economically, environmentally and socially sustainable, operationally resilient and affordable for customers and supports emission reductions. The environmental impacts of transport will be lessened by reducing the distance people need to travel to workplaces and essential facilities. See also the Responses sections in the topic.
Regional plans
The NSW Government has 10 regional plans across the state that play a critical role in how natural resources are managed to ensure the prosperity and productivity of the NSW economy, as well as the health of local communities and the environment.
Regional plans are long-term strategic planning documents that articulate a vision and plan for housing, jobs and community infrastructure to meet the needs of a changing population. Each plan includes specific goals and actions tailored to the region to protect the environment and encourage sustainable use of resources.
NSW Premier’s priorities
The NSW Premier’s priorities set targets to enhance the quality of life in general for the population of NSW, including a strong economy, highest quality education, well-connected communities with quality local environments, quality customer service and breaking the cycle of disadvantage.
Waste
The NSW Waste and Sustainable Materials Strategy 2041 () focuses on achieving environmental benefits and economic opportunities in how the state uses resources and manages its waste. The strategy commits NSW to play its part in making a transition to a circular economy over the next 20 years. It provides a long-term strategic focus for communities, industry and all levels of government to work together to build resilient services and markets for waste resources.
For more details, see the Responses section in the topic.
Water
The NSW Water Strategy () is a 20-year plan to improve the resilience of NSW waters. For more information, see the Responses section in the topic.
Programs
A range of NSW Government programs helps reduce the impacts of population growth. Many of these are discussed in the , , , and topics, and the appendix including:
- The National Australian Built Environment Rating System (NABERS) is a rating system that measures the energy, water, waste and indoor environmental impact of buildings in Australia using a six-star scale.
- The Sydney Green Grid () provides a framework for projects that will enhance liveability and biodiversity and increase ecological resilience by delivering an interconnecting network of open space throughout the city. This network includes parks, bush, creek corridors, transport routes, suburban streets, footpaths and cycleways.
- The Metropolitan Greenspace Program supports local councils in Greater Sydney and the Central Coast to improve regional open space by co-funding projects to deliver the Green Grid network.
- The NSW Government’s Net Zero Plan (DPIE 2020c) is the foundation for NSW’s action on climate change and goal to reach net zero emissions by 2050. Details can be found in the Net Zero Plan Stage 1: 2020-30 Implementation Update.
Future opportunities
Reducing the environmental impacts of population growth requires careful management. The plans for Greater Sydney and regional areas outlined in this topic contain many elements that will improve sustainability outcomes.
In addition to these plans, the NSW Government Greener Places infrastructure policy, when finalised, will guide urban planning, design and management to improve the network of green spaces. This will help reduce the urban heat island effect, improve biodiversity and increase access to walking and cycling pathways. The policy applies statewide and links to the existing Sydney Green Grid program and sustainability objectives in the Greater Sydney Region Plan.
There are also opportunities to investigate each impact area at a strategic level and analyse the per capita reductions that would be needed to manage the impact of population growth. This will help define responses, including the possibility of setting new targets for key impact areas as part of the planning process.