Summary
Water quality and ecosystem health in the marine environment is generally good. Most coastal environments are in good condition, while the condition of NSW estuaries tends to be more variable and not as good.
At 84% of NSW beaches, recreational water quality, based on levels of pollution from stormwater runoff and sewage contamination, is rated as very good or good. The rating for coastal lakes and estuaries is 66%. The condition of individual estuaries and coastal lakes is highly variable and depends on their level of resilience to change and the level of disturbance of their catchment.
Forty-five marine species or populations are currently listed as threatened under NSW legislation including 21 marine seabird species and seven marine mammal species.
The greatest threats to the coastal and marine environment come from land use intensification, resource-use activities and climate change. Most coastal and estuarine areas have been modified to some extent, increasing pressure on the species that depend on them. Coastal development and land use continue to impact the viability of fauna populations, including threatened species. Only about one in five estuaries and coastal lakes retain more than 90% of natural, uncleared vegetation within their catchments, mostly along the south coast.
Related topics: Protected Areas and Conservation | Invasive Species
NSW indicators
| Indicator and status | Environmental trend |
Information reliability |
|
|---|---|---|---|
| Percentage of ocean and estuarine beaches with beach suitability grades for swimming of good or better |
|
Stable | ✔✔✔ |
| Chlorophyll a levels in estuaries |
|
Stable | ✔✔✔ |
| Turbidity levels in estuaries |
|
Stable | ✔✔✔ |
| Distribution of estuarine macrophytes |
|
Variable | ✔ |
| Levels of estuarine catchment disturbance |
|
Getting worse | ✔✔ |
Notes:
Terms and symbols used above are defined in How to use this report.
Context
The NSW coastline is about 2,100 kilometres long and the state's marine jurisdiction extends 5.6 kilometres (three nautical miles) out to sea.
The coastal, estuarine and marine waters of NSW contain high levels of biodiversity. This is because of their wide range of oceanic, shoreline and estuarine habitats, and both subtropical and temperate currents.
Common estuary types in NSW are:
- the mouths and tidal reaches of drowned river valleys
- rivers with sand bars at their entrances (wave dominated rivers)
- intermittently closed and open lakes, lagoons and creeks
- large coastal lakes.
The broad characteristics of the NSW coast are:
- the north coast has broad coastal floodplains that have been extensively cleared and settled
- the Sydney Basin is highly urbanised with drowned river valleys cutting through sandstone plateaus
- the south coast is mostly less developed and has many coastal lakes and lagoons with relatively small catchments.
These varied environments and the habitats they support provide many important ecosystem services, such as:
- mitigating coastal and seabed erosion
- maintaining coastal water quality
- acting as critical habitats for fish and other marine life
- maintaining healthy aquatic ecosystems
- providing recreation, visual amenity and food production.
The desirability of coastal lifestyles and increasing settlement along the coast are placing estuaries and coastal lakes under higher levels of stress. The waters and ecosystems near urban, industrial and agricultural areas are particularly exposed to the effects of pollution from urban and agricultural runoff, stormwater and sewage discharge. The main threats to coastal, estuarine and marine waters are:
- land-use intensification, point discharges and hydrologic modification
- resource use activities including shipping, fishing, aquaculture, recreation and tourism, dredging, mining, flow modification and infrastructure
- climate change resulting in altered ocean currents and nutrients, air and sea temperature rise, ocean acidification, altered storm and cyclone activity, sea level rise and flooding and storm inundation (MEMA 2017).
Over the last decade, systematic data has been collected on the condition and long-term health of the coastal, estuarine and marine areas of NSW, and the important ecosystems they support. This data includes information on estuarine ecosystem health including:
- algal abundance
- water clarity
- seagrass depth
- oxygen levels.
There are significant knowledge gaps about threatened species and fish species abundance and variety.
Status and Trends
Water quality
The health of coastal, estuarine and marine ecosystems is heavily influenced by water quality. Water quality is naturally different between different estuary types. However, pressures on water quality over time can lead to reduced ecosystem health including:
- changes in the distribution and abundance of species
- algal blooms
- loss of habitat and biodiversity
- reduced recreational value and amenity.
Marine waters are generally considered to be in good condition as currents, wave action and tides are usually able to dilute and disperse pollution (for relatively small inputs). Marine waters are less vulnerable to degradation than estuaries and coastal lakes, especially those that are only intermittently open to the sea, where lower levels of tidal flushing result in a reduced resilience to pollution (BMT WBM 2017).
Even in well-flushed systems, sedimentation, local pollution from stormwater runoff, urban and industrial development and sewage system overflows can impact on water quality. Pollutants can accumulate in sediments, and bioaccumulation can then lead to adverse effects on ecosystems and human health. For example, contamination of Homebush Bay by dioxins and the Hunter River by per- and poly-fluorinated alkyl substances (PFAS).
Recreational water quality
Water at NSW beaches is mainly polluted by stormwater discharges and sewage overflows after heavy rain and agricultural runoff. Pollution of coastal waters with faecal material can threaten recreational users due to the pathogens (organisms that can cause a range of illness in humans) in the faecal matter. Polluted water may contain pathogens such as enteric bacteria, viruses, protozoa and worms.
The NSW Government administers the Beachwatch program, which monitors recreational water quality at swimming beaches in NSW. Beachwatch provides information on the level of sewage and stormwater pollution at beaches to indicate their suitability for swimming and recreational use, and to inform the community of the effectiveness of stormwater and wastewater management.
Beachwatch and the Beachwatch Partnership Program monitor 250 swimming sites.
- Beachwatch monitors 132 swimming sites in the Sydney, Hunter and Illawarra regions: 72 ocean beaches, 56 estuarine beaches, three lagoon/lake sites and one ocean rockpool.
- Regional coastal councils monitor beaches under the Beachwatch Partnership Program. In the 2016–17 swimming season, 10 local councils participated in this program, which monitored 118 swimming sites, including beaches, coastal lagoons, ocean baths, estuaries and rivers.
Swimming sites are assigned a beach suitability grade, ranging from 'very good' to 'very poor'. These relate to the Microbial Assessment Category (MAC), which detects levels of bacteria called enterococci to assess the risk of illness as determined in accordance with the Guidelines for Managing Risks in Recreational Water (NHMRC 2008).
In 2016–17, 84% of the 250 swimming locations monitored were graded as 'very good' or 'good'. Nearly all ocean beaches (98%) and 73% of estuarine beaches achieved these ratings. However, only 43% of lake and lagoon swimming sites and one of the two ocean baths were graded as 'very good' or 'good,' reflecting their lower capability to dilute and flush pollution (Map 20.1).
Map 20.1: Beach suitability grades at coastal and estuarine swimming sites in NSW, 2016–17
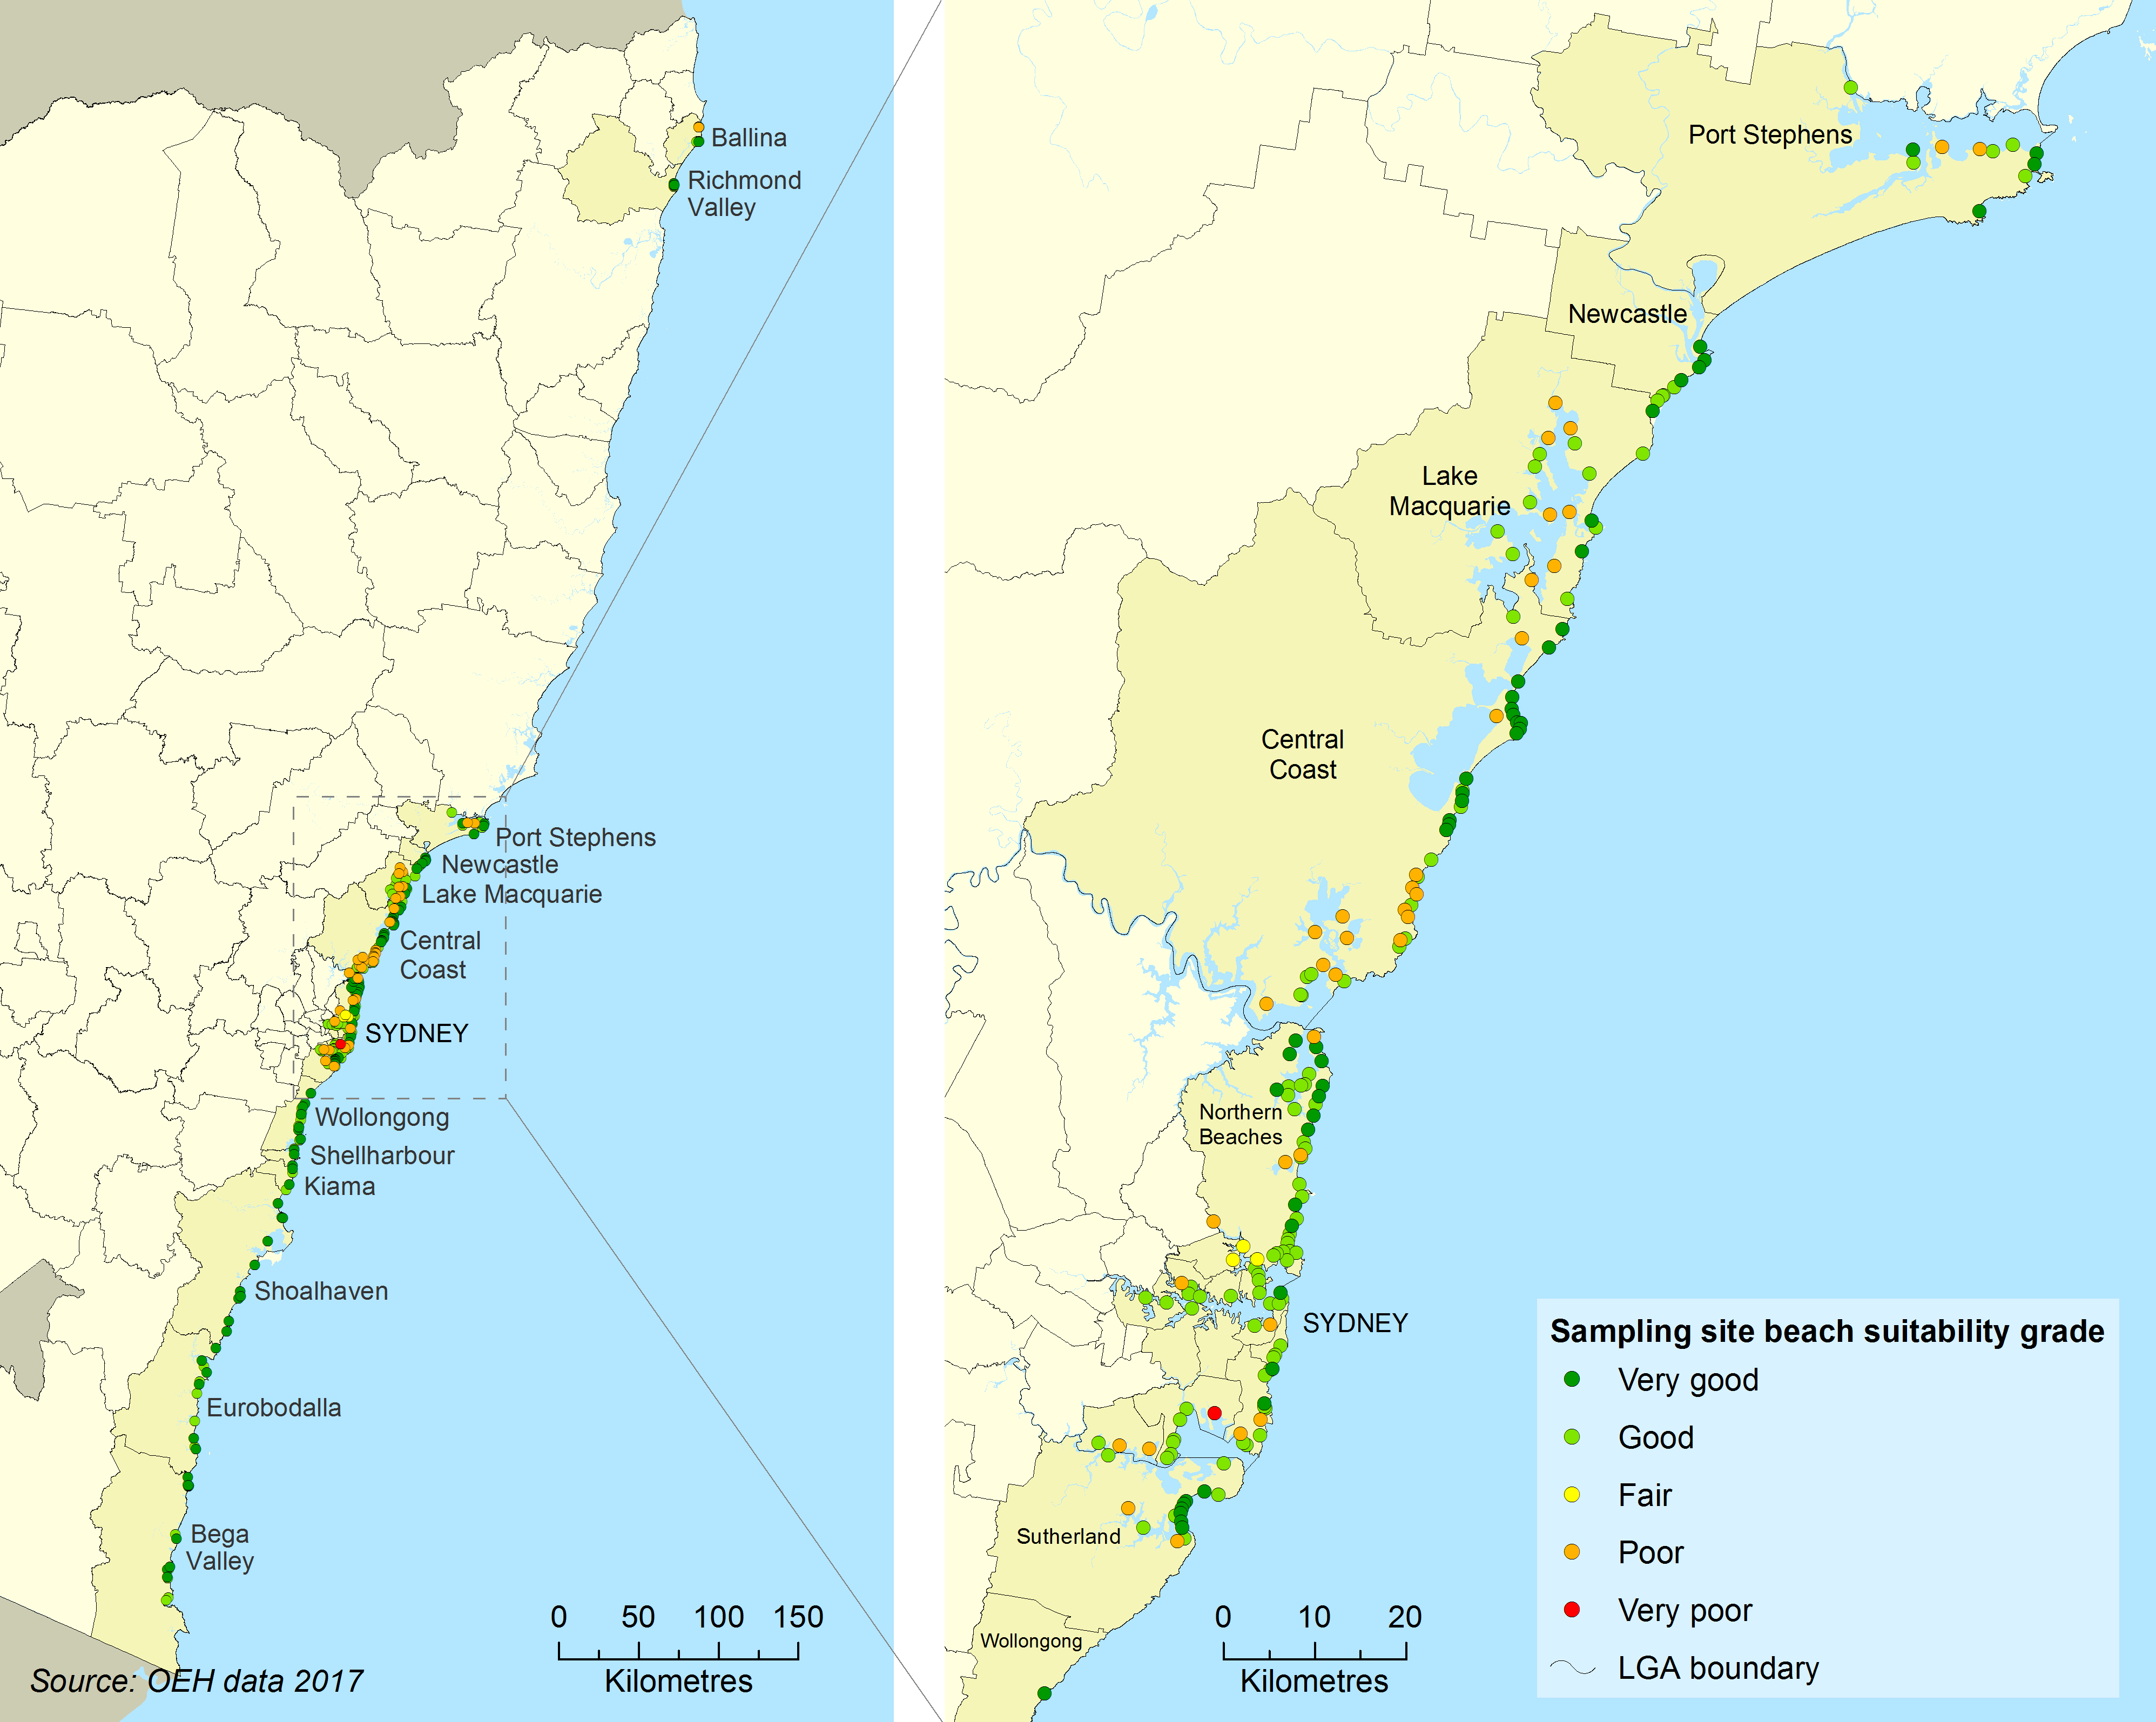
Figure 20.1 Percentage of Sydney, Hunter and Illawarra beach and estuary monitoring sites graded as having low levels of faecal contamination 1995–96 to 2016–17
Notes:
Includes Beachwatch data. Data from the Beachwatch Partnership Program is not included.
Figure 20.1 shows the percentage of sites with low levels of faecal contamination over the past 22 years at ocean and estuarine beaches in Sydney, Hunter and Illawarra. It includes data from the Beachwatch program but not the Beachwatch Partnership Program. Microbial Assessment Categories are used to determine level of faecal contamination and have been applied to historical enterococci data. Microbial Assessment Categories A and B indicate generally low levels of faecal contamination are part of the assessment for a swimming site to achieve a 'very good' or 'good' beach suitability grade.
In 2016–17, 80% of Sydney estuarine beaches had low levels of faecal contamination, compared with the 91% of beaches with low levels in 2014–15 and despite variable rainfall conditions.
The longer-term trend shows there has been significant reduction in bacterial levels at swimming locations in the Sydney region since 1998–99 with most fluctuations due to rainfall patterns and the associated variation in the frequency and extent of stormwater and wastewater inputs.
Before about 2002, wet weather had a much greater impact on swimming locations in Sydney. While 1998–99, 2007–08 and 2010–11 were all wetter years, the levels of enterococci show great improvement over the years:
- 2% of Sydney estuarine beaches had low levels of enterococci in 1998–99
- 67% of Sydney estuarine beaches had low levels of enterococci in 2007–08
- 85% of Sydney estuarine beaches had low levels of enterococci in 2010–11.
The significant reductions in bacterial levels at swimming locations in the Sydney region may be attributed to improvements in stormwater and wastewater management over the past 18 years. The latest results from 2016–17 indicate the need to improve the management of stormwater inflows to estuaries in urban catchments by continuing to adopt a risk-based approach to reduce the impacts of wet weather overflows from the wastewater network.
Estuarine water quality
The Australian and New Zealand Guidelines for Fresh and Marine Water Quality (ANZG 2018) provides default values and criteria for physical, chemical and biological factors related to water quality and recommends that local values be determined. Estuarine water quality is reported on using data collected through the NSW Government’s Estuary Health monitoring program and is based on local values for NSW estuaries.
Eutrophication occurs when nutrients and organic matter lead to an excessive growth of plants, including algae, in estuaries. Consequences include:
- reduced water clarity leading to submerged aquatic plants and animals struggling to get the light they need to grow
- loss of oxygen in waters leading to death of animals
- toxins produced by some algae that threaten fish, shellfish and humans coming in contact with the water.
Abnormally high turbidity (poor water clarity) or high levels of chlorophyll a (indicative of high phytoplankton levels or algal blooms) can mean that a water body is experiencing eutrophication. Sometimes this can be attributed to natural causes (ocean upwellings, which have a close association with El Niño cycles, can lead to natural algal blooms), but often it is human-induced. High and moderate levels of disturbance result in significantly increased turbidity and chlorophyll a (OEH 2016).
The NSW Estuary Health Monitoring Program (OEH 2016, Hallett et al 2016) monitors waterway health by measuring chlorophyll a concentration, turbidity and oxygen content. The program has been collecting data from NSW estuaries since 2007, using the sampling design set out in Roper et al. (2011). The data have been used to calculate an Estuary Health Index, with levels for estuaries ranging from A (very good) to F (very poor) (OEH 2016). Data on low oxygen content have not been included in the index as no chronic problems have been found, with the exception of infrequent low oxygen levels from flood events in the Hunter and Richmond Rivers that the program is not designed to detect.
Data on estuarine turbidity and chlorophyll a are available from July 2007 to March 2017 (MEMA 2017). The result of the turbidity and chlorophyll analyses have been combined into an overall score for each estuary for every year sampled. Estuaries with greater levels of catchment disturbance have had poorer results for both chlorophyll a and turbidity, as can be seen by the many grades for estuaries in the 2014–2016 period from Newcastle to Wollongong in Map 20.2.
Map 20.2 Estuarine Catchment Gradings 2014-2016
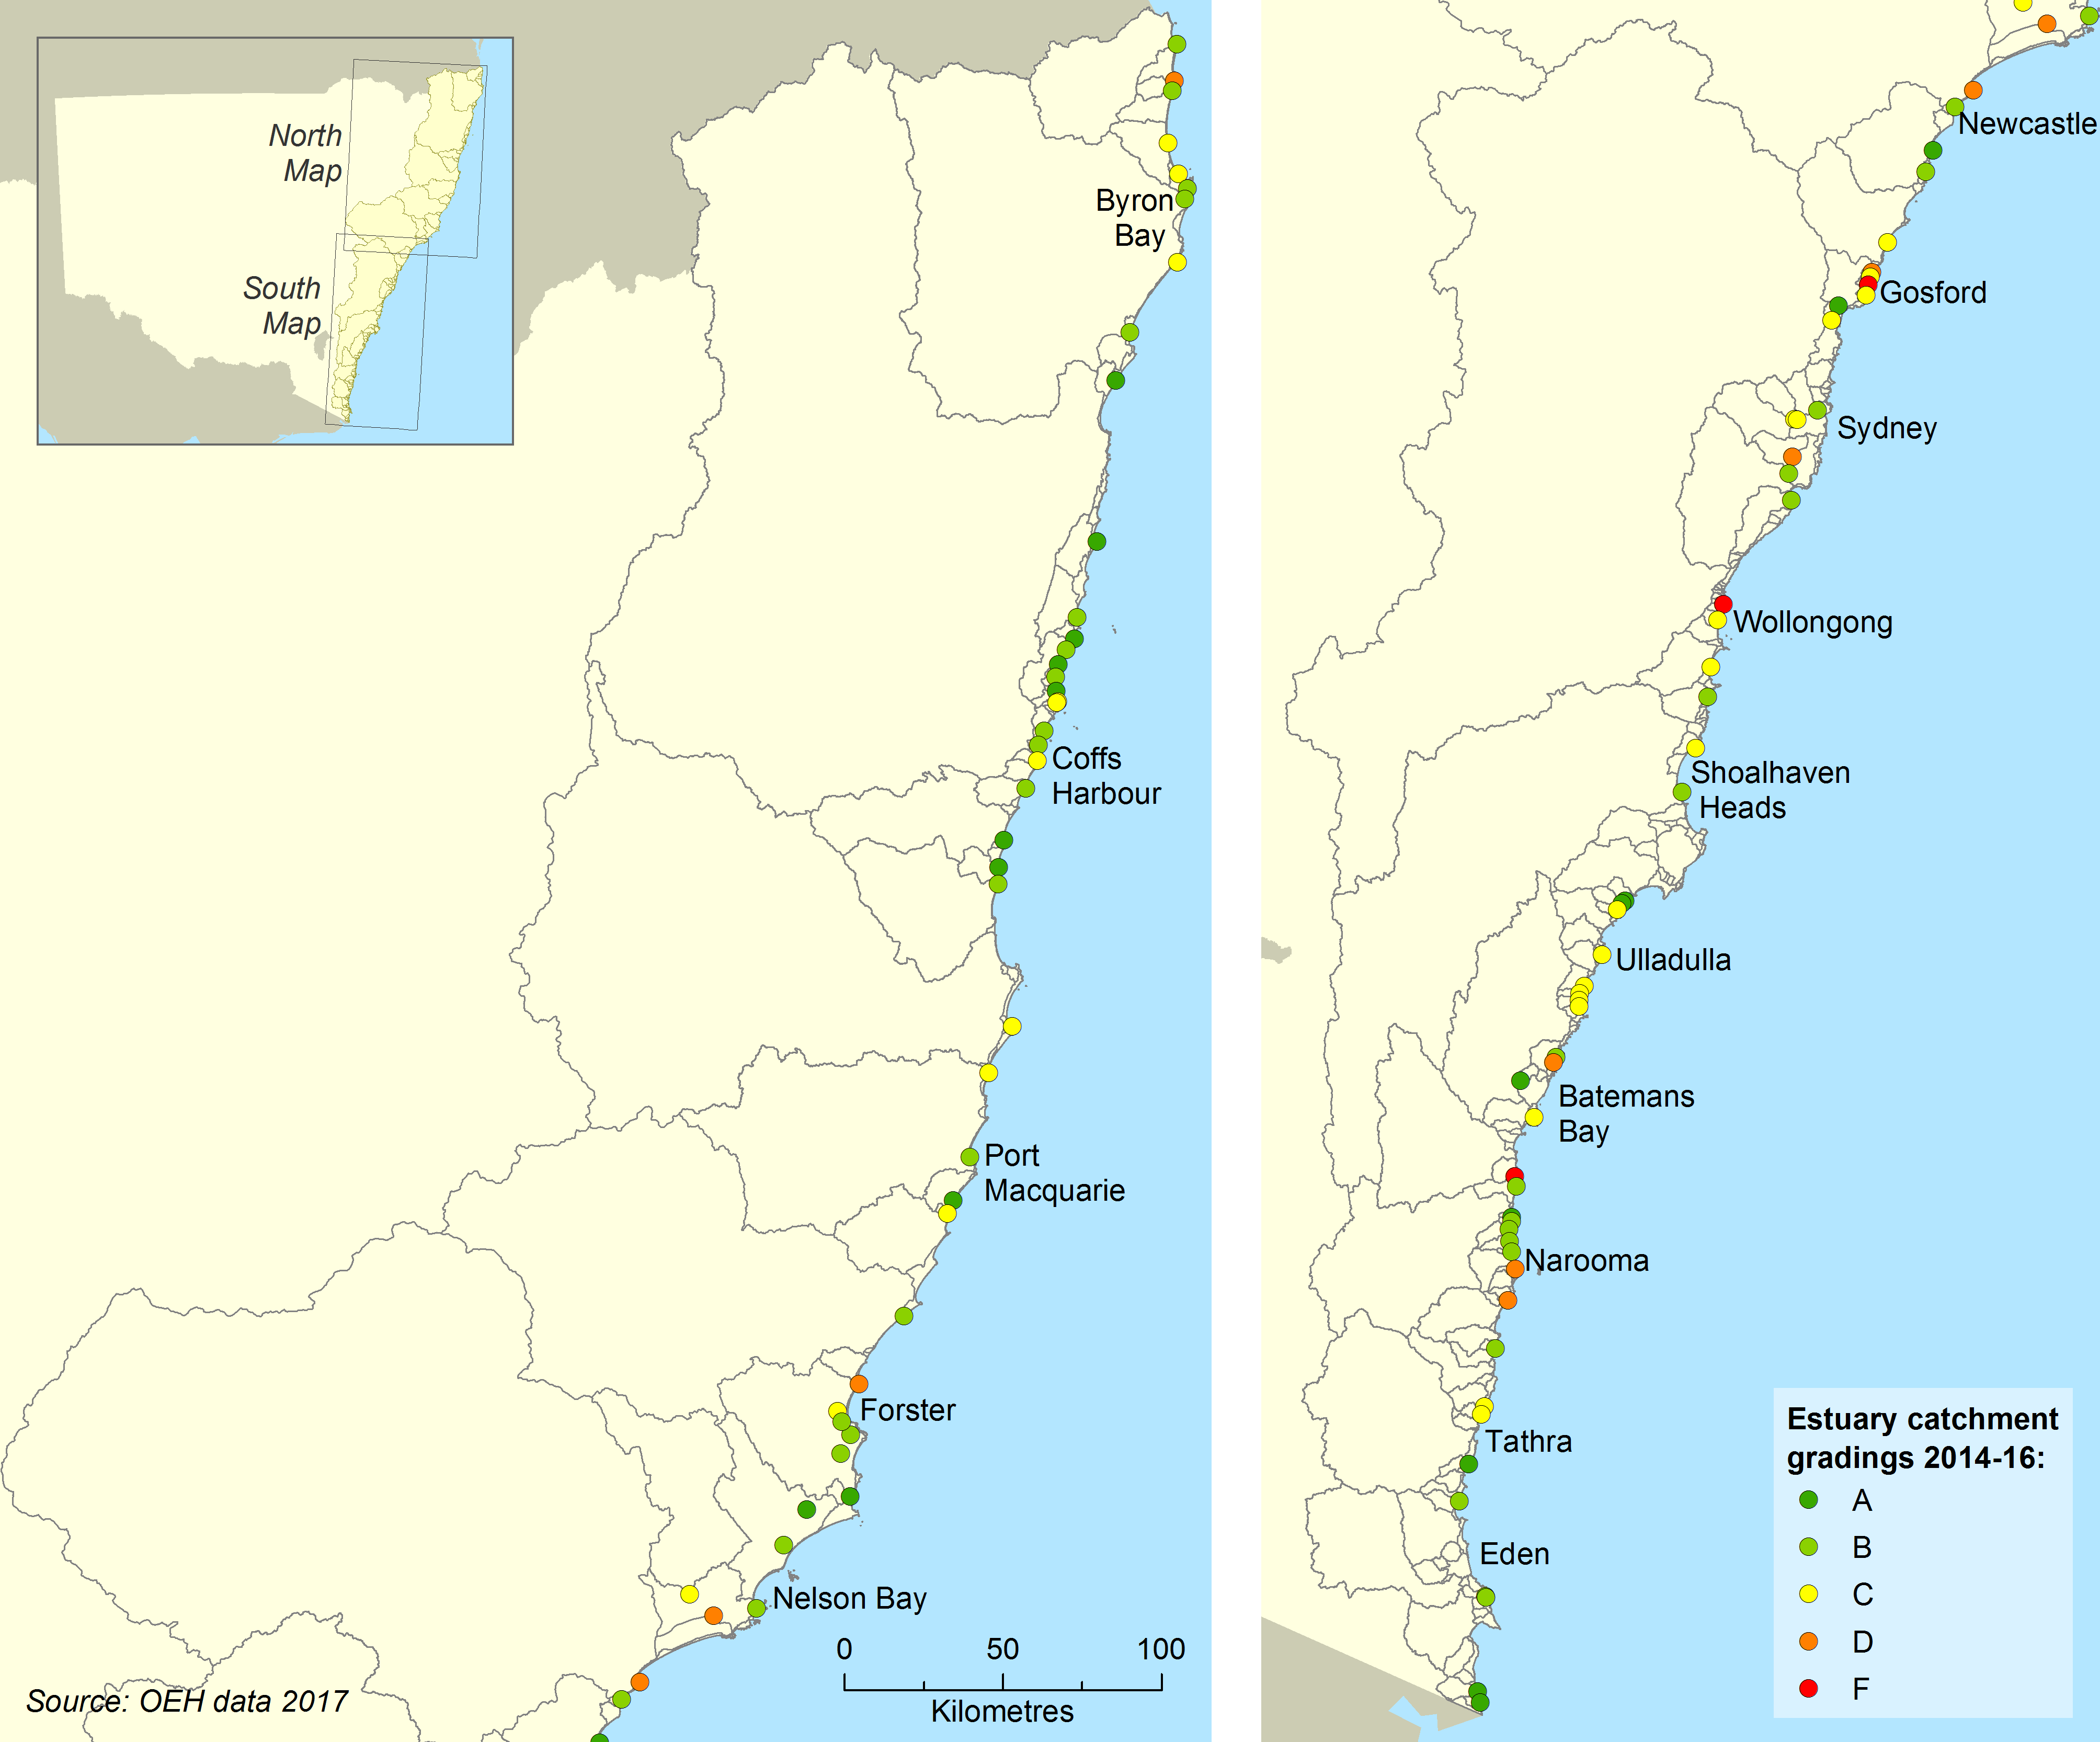
Some estuaries have consistently poor or very poor grades, for example, Hunter River, Wamberal Lagoon, Terrigal Lagoon, Hawkesbury River, Manly Lagoon, Parramatta River, Cooks River, Towradgi Creek, Fairy Creek. These are all located in extensively developed catchments with large amounts of stormwater and some are subject to sewage discharges.
On the north and south coasts there are some consistently poor scores (e.g. Brunswick River, Belongil Creek (sewage), Salty Lagoon (sewage), Evans River (sewage), Flat Top Point Creek (sewage), Coffs Creek (urban and agricultural), Tilligery Creek (agricultural), Karuah River (agricultural), Tilba Tilba Lake (agricultural). Other systems have shown an improving trend such as Wallamba River (agricultural), Durras Lake and Nadgee Lake (both natural cycles) or intermittent rainfall-driven variation (Myall Broadwater).
Aquatic vegetation
Along the NSW coast, aquatic vegetation falls into two broad categories:
- Biota attached to rocky features such as reefs and headland plants rooted in sediments, mostly the estuarine macrophytes such as seagrass, mangroves and saltmarsh.
- Coastal vegetation, such as dune, coastal heath and woodland, and back-beach swamp ecosystems, are also important for the overall health of coastal environments.
These types of vegetation have not been systematically monitored. Trends in marine vegetation can be seen by analysing aerial photos from the late 1970s, although most of the major stressors due to land use changes and poor pollution practices occurred decades earlier.
Saltmarsh
Saltmarshes occur in 81% of NSW estuaries, with the dominant species being Sarcocornia quinqueflora (samphire), Suaeda australis (salt-couch), Sporobolus virginicus and Paspalum vaginatum.
The distribution of saltmarshes has been mapped at least twice in most estuaries in NSW. The results show there have been consistent declines in 17% of estuaries (23 out of 135) containing saltmarshes (MEMA 2017).
- The northern region (Tweed River to Port Stephens) contains 64% of the state’s saltmarsh. Large areas of saltmarsh occur in Port Stephens, Wallis Lake, Clarence River and Macleay River. Saltmarsh has been re-mapped in 14 estuaries in the northern region over the last six years. There have been steady declines in area of saltmarsh in two estuaries and increased areas in three estuaries.
- Saltmarsh habitat in the central region is in 17 estuaries, with the largest areas in the Hunter River, the Hawkesbury River, Botany Bay and Brisbane Waters. Only Lake Macquarie has been re-mapped during the last six years. Saltmarsh had decreased in area by six hectares since 2009, but this is similar to the area of saltmarsh mapped in 1985.
- Saltmarsh has been mapped in 63 estuaries in the southern region of NSW. The largest area is in the Shoalhaven River, followed by Jervis Bay and the Clyde River. Between 2005 and 2015, only eight estuaries in the southern region were re-mapped. Of these, the area of saltmarsh had decreased in two. In 2017, saltmarshes were mapped in an additional six estuaries in the Eurobodalla Shire. Decreased areas of saltmarsh were reported in two estuaries, with increased areas in four estuaries (Finley & Yee 2018)
Mangroves
Six mangrove species occur in NSW, with the two most common being the grey mangrove (Avicennia marina) and the river mangrove (Aegiceras corniculatum).
Mangroves occur in 60% of NSW estuaries, being largely absent from intermittently open lagoons, lakes or creeks. The spread of mangroves may be related to human activities and is often associated with declines in saltmarsh (Mitchell & Adam 1989, Saintilan & Williams 1999).
The distribution of mangroves has been mapped at least twice in most NSW estuaries since 1985 (MEMA 2017).
- Mangroves are found in most northern region estuaries, with significant increases in area mapped between 1985 and 2012. Mangroves have been re-mapped in 14 estuaries in the northern region over the last seven years. In all, mangrove area has remained relatively stable, except for an increased area of mangroves in two rivers.
- Mangrove habitat in the central region is present in 72% of estuaries. The largest areas of mangroves are in the Hunter River, followed by the Hawkesbury River and Botany Bay. Only Lake Macquarie has been re-mapped over the last six years, where mangrove area remained relatively stable.
- Many (62%) mapped estuaries in the southern region do not contain mangroves. The estuaries with the greatest area of mangrove are the Shoalhaven River, the Clyde River and Jervis Bay. Between 2005 and 2012, eight estuaries were mapped, and mangrove area had increased in all of them except for Tuross Lake. In 2017, mangrove areas were mapped in six estuaries in the Eurobodalla Shire and all had increased areas since 2012, including a recovery of mangroves in Tuross Lake (Finley & Yee 2018).
Seagrasses
Seagrasses are found mainly in shallow waters of protected estuaries and bays. Dominant species are Posidonia australis (strapweed) and Zostera muelleri ssp. capricorni (eelgrass). Populations of Posidonia australis are listed as endangered in six NSW estuaries due to recent population declines (Fisheries Management Act 1994). Posidonia australis in the Manning-Hawkesbury bioregion is also listed as an endangered ecological community (EPBC Act).
Abundance of smaller species of seagrass (Zostera, Ruppia, Halophila) can fluctuate greatly over time due to variation in salinity in estuaries with large catchments and other reasons. It is often not possible to attribute declines in total seagrass area to human activities (BMT WBM 2017).
- Seagrasses have been recorded in 80% of mapped estuaries in the northern region. The greatest areas of seagrass are in Wallis Lake, Port Stephens and Camden Haven. Posidonia occurs only in Wallis Lake and Port Stephens, and in both estuaries this species has increased in area over the last 10 years. Between 2004 and 2017 there was a decline in total seagrass area (primarily driven by Zostera) in the Lower Myall River of around 91 hectares or 61% of area loss, although this magnitude of decline is not uncommon in many NSW estuaries.
- Seagrass is in 84% of mapped estuaries in the central region. The largest areas of seagrass are in Tuggerah Lake, Lake Macquarie, Lake Illawarra, Brisbane Waters and Botany Bay. Only Lake Macquarie has been re-mapped over the last 10 years, with areas of Posidonia remaining relatively stable from 2009–2013, while total seagrass area declined by 336 hectares (22% loss), due primarily to losses in Zostera. In the mid-2000s, an entire Zostera meadow 6.5 hectares in size, which had been present since at least 1978 (West & Williams, 2008), was lost from Rose Bay in Port Jackson, and there are still no signs of recovery.
- Seagrass occurs in 85% of estuaries in the southern region, with Posidonia in only eight of these. The largest areas of seagrass occur in Jervis Bay. Seagrasses have been mapped in eight estuaries in the southern region over the last six years. Of these, Posidonia occurs in only one (Batemans Bay) and its area has remained relatively stable. Total seagrass area increased in two estuaries between 2004 and 2012, while there was a large reduction in total seagrass area in Tuross Lake. In 2017, seagrasses were mapped in six estuaries in the Eurobodalla Shire (Finley & Yee 2018), with seagrass areas remaining stable in all six estuaries since 2012, with the exception of Tuross Lake where the seagrass area declined substantially.
Threatened species
Forty-five marine species or populations are currently listed as threatened (up from 41 reported in 2015) in the Fisheries Management Act 1994 (FM Act) and the Biodiversity Conservation Act 2016 (BC Act). These include:
- 21 marine seabird species (there are also 16 other marine birds including shorebirds, waders, eagles and hawks)
- seven marine mammal species
- seven fish species
- three reptile species
- four marine invertebrate species
- two macroalgae species
- one marine vegetation species.
Little is known of the status of many marine organisms, particularly invertebrates. The number of species listed will probably grow as pressures on the marine environment increase. Species such as sharks, tuna and whales remain the most vulnerable to threats.
Poorly located or inappropriate coastal development is threatening the viability of fauna populations including threatened species. For example, studies have found adverse impacts from artificial lighting, including street lighting, on turtle hatchlings and breeding patterns (Truscott et al 2017) and a reduction in migratory seabird and shorebird habitat due to foreshore hardening and disturbance from recreational activity (Umwelt 2017, DEC 2006).
See the Threatened Species topic for more information.
Pressures
Catchment disturbance
More than 85% of the NSW population lives within 50 kilometres of the coast and most coastal catchments in the marine estate have some level of land-use activity or development (MEMA 2017). Only 12 of the 184 main catchments in NSW remain undeveloped, and these are mostly in the south towards the NSW and Victorian border (MEMA 2017).
The most developed catchments, where over 80% of land is developed, are predominantly urbanised. Typically, urban areas are adjacent to main waterways; while agricultural areas, forestry and mining operations are in the upper parts of the catchment.
The top four threats to coastal and marine environments are associated with land-use intensification (BMT WBM 2017) and are:
- urban stormwater discharge
- modifications at the entrance of estuaries to enable access
- agricultural runoff in estuaries
- clearing riparian and adjacent habitat, including draining wetlands.
The extent of land use activity in all coastal catchments has been summarised by a catchment disturbance index, which ranges from very low disturbance (5) to very high (1). The index was derived for the NSW Monitoring, Evaluation and Reporting Strategy 2010–2015 (DECC 2010, Roper et al 2011), and contains pre- and post-European pollution levels modelled using the NSW Government’s Coastal Eutrophication Risk Assessment Tool.
The sensitivity of estuaries to impacts resulting from land use intensification varies due to the type of estuary, likelihood of intensification and pollutant removal efficiency (Roper et al 2011). There are 93 estuaries identified as sensitive to impacts from land use (OEH 2017) including:
- 25 in the northern region
- 21 in the central region
- 47 in the southern region.
Table 20.1 (MEMA 2017) shows that the population has increased faster on the north and south coasts – 36–40% of catchments have population increases of over 20% – while there is an increase of only 10% in central NSW.
- In the north region 44–45% of estuaries are situated in areas with the highest population density and nutrient export from runoff and overflows. This region has the greatest hydrological modification of estuary function.
- The central region has the greatest levels of urbanisation, so 85% of estuary catchments with the highest population densities, and high levels of nutrients and sediment are exported to 70% of estuaries.
- The south region has just 17–18% of estuary catchments in areas of high population density and nutrient categories.
Table 20.1: Proportion of NSW estuary catchments in the two highest disturbance ranks (statewide) for population density, nutrient increase and commercial fish catch
| Factor | Number of estuaries with a high disturbancea | Number of estuaries | Percentb |
|---|---|---|---|
| Northern | |||
| Population density | 24 | 55 | 44% |
| Nutrient increase | 25 | 55 | 45% |
| Commercial catch | 5 | 55 | 9% |
| Population increase (>20%) | 20 | 55 | 36% |
| Central | |||
| Population density | 34 | 40 | 85% |
| Nutrient increase | 28 | 40 | 70% |
| Commercial catch | 1 | 40 | 3% |
| Training walls | 7 | 40 | 18% |
| Population increase (>20%) | 4 | 40 | 10% |
| South | |||
| Population density | 16 | 89 | 18% |
| Nutrient increase | 15 | 89 | 17% |
| Commercial catch | 3 | 89 | 3% |
| Training walls | 9 | 89 | 10% |
| Population increase (>20%) | 36 | 89 | 40% |
Notes:
a Estuaries with a disturbance rank of 1 or 2.
b Percentage of estuaries with training walls (modifications) and proportion of estuaries with a more than 20% increase in population between 1996 and 2006 in the northern, central and southern regions.
Pollution
The most significant priority threats for water pollution on environmental values are urban stormwater discharge, agricultural diffuse source runoff and solid waste, marine debris and microplastics.
Discharge of nutrients, sediments, metals, toxins, and other chemicals and pollutants into coastal waters also occurs from the many small catchments that front the coast. This often involves untreated urban stormwater and agricultural runoff. Some catchments will also have licensed discharges from industries such as those dealing with minerals production and refining; and sewage treatment plants.
Figure 20.2 shows licensed discharge loads of total nitrogen, phosphorus and suspended solids to open marine waters and estuaries.
Loads discharged to estuarine environments have been generally decreasing over this period. Discharges of suspended solids tend to reflect wet and dry periods, such as El Niño cycles, and are relatively stable, although these discharges have increased in open coastal waters in 2016-17, but have generally remained stable.
Figure 20.2: Licensed discharges to NSW open marine waters and estuaries, 2000–01 to 2016–17
Notes:
Data covers all licensees discharging into the marine environment under the Load-based Licensing Scheme.
Urban stormwater and agricultural runoff are recognised as significant contributors of nutrients to marine waters. Refer to the status and trends section of this topic for detail on nutrients and water quality. Additional sources of coastal and marine pollutants include:
- garbage washed or blown from land
- discarded commercial and recreational fishing gear
- material from shipping operations and incidents, such as ballast water discharges and sewage released from vessels, and oil or chemical spills.
No major shipping-related pollution incidents have been recorded in NSW marine waters over the last three years. However, in Commonwealth Waters in June 2018 cargo loss from the Liberian-flagged ship, YM Efficiency, approximately 30 kilometres off the coast of Port Stephens resulted in debris in NSW waters and on the Mid North Coast and Nelson Bay peninsula.
Entanglement and ingestion of debris can be fatal to marine species, particularly threatened species such as seabirds, turtles and whales. The NSW Government’s Biodiversity Conservation Act 2016 lists ‘entanglement in or ingestion of anthropogenic debris in marine and estuarine environments’ as a key threatening process. Recovery in the populations of threatened species, such as humpback whales, is likely to result in more accidental entanglements.
As much debris is plastic, which both floats and is slow to degrade, the impacts are multiple and long-lasting. See the Waste topic in this report for more details.
Climate change
‘Human induced climate change’ is listed as a key threatening process under the Fisheries Management Act 1994 and 'anthropogenic climate change’ under the Biodiversity Conservation Act 2016. Key components of climate change that are considered to have potential impacts on the NSW marine environment (MEMA 2017) are:
- altered storm and cyclone activity, flooding, storm surge and inundation
- altered ocean currents and nutrients
- climate and sea temperature rise
- sea-level rise
- ocean acidification.
Sea level rise, major storms and floods are having adverse impacts on coastal geomorphological processes including the cyclic accretion of sand onto beaches. The loss of sand from beaches and other changes to the NSW coast due to sea level rise, storm surges and inundation will continue to impact on coastal amenity.
Predictive studies show that the change in the movement of the East Australian Current could greatly affect future species distributions in NSW estuaries (Cetina Heredia et al 2015), though this is an area that requires further research.
Climate change can result in increased water temperatures, often known as ‘marine heat waves’ with extreme consequences for survival of marine and estuarine animals, and changes in ranges for many species. Changes in tidal levels from estuary entrance modifications or sea level rise has major consequences for critical marine habitats such as beaches, mudflats, seagrasses, mangroves and saltmarsh, with flow-on consequences for all the organisms that rely on them (MEMA 2017).
The long-term impacts of climate change will magnify effects on the NSW marine environment. Significant effects are expected to occur across south-east Australia (Hobday et al 2006, Wernberg et al 2011, Verges et al 2016), including changes to:
- marine species distribution and abundance
- variations and timing of life cycle events
- physiology, morphology and behaviour (e.g. rates of metabolism, reproduction, development)
- biological communities via species interactions.
Further specific studies have identified that increases in temperature are likely to result in:
- spread, establishment and virulence of pathogens and exotic species (Wernberg et al 2011, Campbell et al 2011, Harvell et al 2002)
- changes in range and distribution of harvested species (Pecl et al 2011)
- composition and interactions in aquatic communities and the structure and dynamics of communities (Verges et al 2016)
- disease in seaweeds and invertebrates (Campbell et al 2011, Sweet et al 2016)
- poleward contraction of marine organisms and habitats (Smale & Wernberg 2013, Fowler et al 2017)
- a reduction in kelp habitat and associated change in community composition and ecosystem function, particularly in northern NSW.
Ocean acidification may emerge as an important pressure in future decades with evidence of impacts on calcifying immobile animals (Parker et al 2013, Ross et al 2011, Havenhand et al 2008). A particularly vulnerable group is marine molluscs (e.g. oysters, abalone and whelks) in their reproductive stages (Parker et al 2010, Scanes et al 2014). Acidification already interacts with temperature to reduce fertilisation success in Sydney rock oysters, resulting in their smaller size, longer time to develop and increased abnormality of larval stages (Parker et al 2010) and with other stressors to limit survival (Scanes et al 2017).
See the Climate Change topic in this report for more details.
Invasive species
Marine invasive species are plants or animals, often introduced from overseas, that can take over habitats and directly compete with native species for food. Some marine pests are native to other regions of Australia but have been transported into NSW through shipping or the aquarium trade.
The main invasive marine species in NSW are:
- Caulerpa taxifolia (green alga)
- Carcinus maenas (European green crab)
- Sabella spallanzanii (European fan worm).
Other marine pests found in NSW include:
- Tridentiger trigonocephalus (Japanese goby)
- Maoricolpus roseus (New Zealand screw shell).
The introduction of non-indigenous fish and marine vegetation to the coastal waters of NSW is listed as a key threatening process under the Fisheries Management Act 1994.
There is no statewide monitoring program for invasive species in NSW, although much research and monitoring was undertaken after the green alga Caulerpa taxifolia was introduced in 2000 and ad hoc surveys have been done for different species in particular locations.
Caulerpa taxifolia was particularly abundant in Burrill Lake and Lake Conjola but has not been seen in either lake since 2013. Wallagoot Lake was officially declared free of Caulerpa in 2013 when surveys failed to detect the presence of the marine pest following significant control efforts. Over recent years, Caulerpa has been reported in 14 estuaries or lakes from Lake Macquarie to Wallagoot Lake in the south. Caulerpa taxifolia in Lake Macquarie continues to persist, with a new highly populated creek area confirmed during 2018.
There are historical reports of Carcinus maenas from estuaries as far north as Port Jackson, but there have been no recent sightings of Carcinus in any estuaries north of Narawallee Inlet. Surveys since 2011 have documented the presence of Carcinus in 27 estuaries south of Narawallee Inlet to the Victorian border (DPI 2017a).
Sabella spallanzanii was known only in Twofold Bay until April 2013 when it was discovered in Botany Bay (Murray & Keable 2013).
Resource use
Marine resource use, including shipping, recreation and tourism, dredging, modified and freshwater flows, are identified as sources of threats (BMT WBM 2017).
Fishing has potential impacts on the natural food chain. Commercial and recreational fishing is undertaken in the coastal, estuarine and marine waters of NSW. Three commercial fisheries operate in NSW estuarine waters:
- estuary general fishery
- estuary prawn trawl fishery.
Commercial fishing is permitted in only 86 of the 184 estuaries along the NSW coast, with recreational fishing only permitted in many estuaries. Of those commercially fished, 18 estuaries account for over 95% of the total estuarine commercial catch, which was around 4,500 tonnes in 2013–14.
The following fisheries operate in coastal and marine waters:
- ocean trap and line
- ocean trawl
- ocean hauling
- rock lobster
- sea urchin
- turban shell and
- abalone
- southern fish trawl.
In 2013–14 commercial catch in NSW coastal and marine waters was around 8,585 tonnes (excluding Southern Trawl Fishery). There were more catches for some species in Commonwealth waters.
Recreational fishing occurs throughout estuarine, coastal and marine waters of NSW. Most recreational fishers use line fishing to catch different species. The composition of the recreational catch varies along the coast, mostly reflecting differences in the distribution of the key harvested species, with many of the same species also harvested in the commercial fisheries.
Commercial and recreational fishing place pressures on fish numbers as well as the broader environment by:
- reducing the abundance of species and interfering with the natural food chain
- causing incidental by-catch, including species of conservation concern
- disturbing wildlife and the marine environment.
Impacts on fish populations vary considerably and are strongly influenced by:
- the number, type and population status of harvested species
- levels of fishing
- type of specific management arrangements.
Several threatened and protected species managed under the Fisheries Management Act 1994, particularly grey nurse shark, white shark and black cod, are threatened by:
- illegal fishing
- injury due to accidental capture by fishers
- entrapment in shark mesh nets.
Hook and line fishing in areas important for the survival of threatened fish species is listed as a key threatening process under the Fisheries Management Act 1994. The shark meshing program in NSW is also listed as a key threatening process under the Fisheries Management Act 1994 and the Biodiversity Conservation Act 2016.
Responses
Legislation and policy
Marine estate management framework
The Marine Estate Management Act 2014 (MEM Act) provides for the strategic and integrated management of the marine estate in NSW. The MEM Act mandates an environmental, social and economic threat and risk assessment (TARA) to be undertaken for the entire NSW marine estate, including coastal waters, lakes and lagoons, estuaries and coastal wetlands.
The TARA (BMT WBM 2017) assesses the pressures on the environmental assets and the social, cultural and economic benefits derived from the NSW Marine Estate (all estuarine, coastal and marine waters up to the tidal limits). It considers how activities create pressures (defined as stressors) on natural assets, and the threat this poses to benefits. The TARA has informed the development of nine new management initiatives in the Marine Estate Management Strategy 2018–2028 and will inform new marine park management plans and related coastal management programs.
Coastal management framework
The NSW Coastal Management Act 2016 (CM Act) establishes the new framework and objectives for coastal management in NSW. The framework comprises the:
- Coastal Management Act 2016
- State Environmental Planning Policy (Coastal Management) 2018 (CM SEPP)
- NSW Coastal Management Manual
- Coastal Management Programs (see following section)
- NSW Coastal Council
- Coastal and Estuary Grants Program.
The CM Act defines the coastal zone which is made up of four coastal management areas. The CM SEPP includes maps of the coastal zone and coastal management areas according to the definitions in the CM Act and establishes development controls to be applied in each area to achieve the objectives of the CM Act. Coastal management in NSW supports the objects of the Marine Estate Management Act 2014.
Environment protection legislation
The Environmental Planning and Assessment Act 1979 sets the framework for land use planning decisions. It is complemented by state environmental planning policies (SEPPs) that deal with planning issues for the coastal zone, including matters arising under the CM SEPP, SEPP No. 50 – Canal Estate Development and SEPP No. 62 – Sustainable Aquaculture.
The Protection of the Environment Operations Act 1997 regulates point source discharges into coastal, estuarine and marine environments.
Fisheries management legislation
The Fisheries Management Act 1994 and supporting regulations aim to conserve, develop and share fishery resources for the benefit of present and future generations by:
- conserving fish stocks and key fish habitats
- protecting threatened species, populations and ecological communities of fish and marine vegetation
- promoting ecologically sustainable development.
Programs
Coastal management programs
Coastal Management Programs (CMPs) set the long-term strategy for coordinated management of the coast, with a focus on achieving the objects of the CM Act. They are prepared by local councils in consultation with their communities and relevant public authorities. The coastal management manual provides mandatory requirements and guidance for CMPs by local councils. CMPs are key mechanisms in the implementation of actions identified in the Marine Estate Management Strategy.
The Marine Estate Management Strategy
The Marine Estate Management Strategy 2018–2028 proposes nine initiatives to address the priority and cumulative threats to the environmental assets and community benefits derived from the NSW marine estate. The strategy provides an overarching framework to manage the marine estate as a single continuous system over the next 10 years. The initial stage will focus on dealing with threats posed by water pollution and marine litter, with complementary activities to:
- deliver healthy coastal habitats and sustainable land use
- protect Aboriginal cultural values
- reduce threats to marine wildlife
- deliver safe and sustainable fisheries and recreational boating
- enhance social, cultural and economic benefits.
The Strategy’s marine litter initiative is being assisted by current NSW litter programs, including a container deposit scheme – see the Waste and Recycling topic.
The Risk-based Framework
The Risk-based Framework for Considering Waterway Health Outcomes in Strategic Land-use Planning Decisions (Dela-Cruz et al 2017) is a protocol to help decision-makers manage the impact of land-use activities on the health of waterways in NSW. It enables decision-makers to determine management responses, which meet waterway health outcomes that reflect the community’s environmental values and uses of waterways.
Marine Water Quality Objectives
The Marine Water Quality Objectives for NSW Ocean Waters (DEC 2005) describe the water quality needed to protect the community's values for, and uses of, the marine environment and are used in coastal planning and management planning strategies covering land use and catchment management.
AdaptNSW
The NSW Government AdaptNSW program is developing information and tools to help government, businesses and communities build resilience in the face of future extreme events and hazards. The Coastal Processes and Responses node researches risk to and management of the impacts of climate change on coastal and estuary zones.
Regional plans
Regional plans are being developed to plan for future population needs for housing, jobs, infrastructure and a healthy environment. These plans set a strategic direction for rapidly growing coastal regions.
Commercial Fisheries Business Adjustment Program
The Commercial Fisheries Business Adjustment Program has provided enhanced management structures to promote sustainability and viability throughout NSW commercial fisheries. The program has provided significant reforms including introduction of additional direct catch and effort quota management structures and measures to rationalise potential fishing effort. The new management arrangements will result in increased certainty for the management of key commercial species and allow effective and efficient controls for the management of commercial harvest. Implementation of the new arrangements commenced in 2017 and will conclude in 2019.
Harvest Strategies
Harvest strategies provide best practice frameworks for assessment and management of fisheries resources. The NSW Government is in the process of developing a policy framework and harvest strategies that will provide improved assessment, monitoring, and management objectives with an initial focus on commercial harvest.
Sustainable Aquaculture Strategies
Sustainable aquaculture strategies have been developed to guide sustainable seafood production to support future demands of food security for the state.
The NSW Land Based and Oyster Industry Sustainable Aquaculture Strategy outlines industry best practice, a streamlined approvals process, secure oyster leases for future generations and highlight protection of water quality. It is complemented by the Healthy Estuaries for Healthy Oysters - Guidelines, prepared to meet the requirements of the NSW Diffuse Source Water Pollution Strategy. The Guidelines aim to not only protect environmental conditions required for healthy oyster production, but also to improve estuarine water quality to benefit recreational users, tourism, and recreational and commercial fisheries.
A NSW Marine Waters Sustainable Waters Aquaculture Strategy has been drafted to set the overarching strategy for the NSW Government to co-ordinate development of the marine aquaculture industry. It provides regulatory and industry best practice framework for development of the NSW marine waters aquaculture industry in an ecologically sustainable and socially responsible manner.
Fisheries Compliance
NSW DPI Fisheries Compliance works to reduce the risks to fish stocks and aquatic habitats in NSW. Fisheries officers operate from 28 strategically placed locations along the coast and inland to ensure compliance in all recreational fishing, commercial fishing, aquaculture, and marine protected areas programs in NSW (including marine reserves and marine parks).
Using a risk-based approach the group strives to optimise compliance with fisheries and marine estate management rules by maximising voluntary compliance and creating effective deterrence against illegal activity.
Each year fisheries officers detect around 6,000 offences and seize more than 40,000 illegally obtained fish and 3,000 items of illegal fishing gear.
Non-government initiatives
Teaching and research facilities contribute data and information to Government initiatives. The Sydney Institute of Marine Science (SIMS) is a partnership between the four main universities in the Sydney region and several research institutes including the Australian Museum. SIMS has over 100 scientists and graduate students associates with the Institute and represents a broad array of projects. It provides information directly to policy makers and managers in NSW. Flagship projects run through SIMS include the World Harbour Project, the NSW node of the Integrated Marine Observing System (IMOS), and the Sydney Harbour Research Program.
Australian Government activities
The National Water Quality Management Strategy (NWQMS) is a joint national approach to improving water quality in Australian and New Zealand waterways. The NWQMS involves development and implementation of management plans for estuaries, coastal waters and other water bodies by the community and government. These plans focus on the reduction of pollution released into coastal pollution hotspots and other aquatic ecosystems around the country. The Great Lakes (Wallis, Smiths and Myall Lakes), Botany Bay, and the Hunter River estuary and its catchment have been identified as hotspots in NSW.
Local government, community organisations and other agencies carry out these plans using the NWQMS to protect agreed environmental values.
Future opportunities
The NSW Government will need to continue to develop and implement suitable management and adaptation strategies to prevent a decline in the quality of coastal, estuarine and marine environments. The poor condition of water quality in some highly urbanised estuaries suggests that stormwater runoff and new urban development can be managed better to maintain the health of estuaries and coastal lakes and the desirability of coastal lifestyles.
Vulnerability to inundation and coastal erosion should be a significant consideration in the location and planning of future developments for an expanding population.
Areas of further improvement could include:
- collaboration between the community, local, state and national governments and research institutions to make the most efficient use of available marine resources
- strengthening comprehensive ecosystem health monitoring programs to provide sound scientific input to decision making
- further developing and expanding risk assessment methods to help protect and rehabilitate the environment in the most resource efficient manner
- consistently applying the risk-based framework across NSW as a best-practice protocol for managing the impacts of land-use change activities on waterway health.
- clarifying agency roles and responsibilities for diffuse source water pollution in NSW.
References
References for Coastal, Estuarine and Marine
ANZG 2018, Australian and New Zealand Guidelines for Fresh and Marine Water Quality, Australian and New Zealand Governments and Australian state and territory governments, Canberra [waterquality.gov.au/anz-guidelines]
BMT WBM 2017, New South Wales Marine Estate Threat and Risk Assessment Report, Final Report, August 2017, BMT WBM, Sydney [www.marine.nsw.gov.au/__data/assets/pdf_file/0010/736921/NSW-Marine-Estate-Threat-and-Risk-Assessment-Final-Report.pdf (PDF 5.1MB)]
Campbell AH, Harder T, Nielsen S, Kjelleberg S & Steinberg PD 2011, ‘Climate change and disease: Bleaching of a chemically defended seaweed’, Global Change Biology, 17(9), pp. 2, 958–70
Cetina-Heredia P, Roughan M, Van Sebille E, Feng M & Coleman MA 2015, ‘Strengthened currents override the effect of warming on lobster larval dispersal and survival’, Global Change Biology, 21, pp. 4,377–86 [doi:10.1111/gcb.13063]
DEC 2005, Marine Water Quality Objectives for NSW Ocean Waters, Department of Environment and Conservation, Sydney [www.environment.nsw.gov.au/water/mwqo/index.htm]
DEC 2006, Threatened migratory shorebird habitat mapping project, prepared by Avifauna Research and Services, June 2006 [www.environment.nsw.gov.au/resources/threatenedspecies/shorebirdMappingReportJuly06.pdf (PDF 814KB)]
DECC 2010, NSW Monitoring, Evaluation and Reporting Strategy, Department of Environment and Climate Change, Sydney [www.environment.nsw.gov.au/-/media/OEH/Corporate-Site/Documents/Water/Estuaries/new-south-wales-natural-resources-monitoring-evaluation-reporting-strategy-2010-2015-100977.pdf (PDF 617KB)]
Dela-Cruz J, Pik A & Wearne P 2017, Risk-based framework for considering waterway health outcomes in strategic land-use planning decisions, Office of Environment & Heritage and Environment Protection Authority, Sydney [www.environment.nsw.gov.au/research-and-publications/publications-search/risk-based-framework-for-considering-waterway-health-outcomes-in-strategic-land-use-planning]
DPI 2017a, Healthy estuaries for healthy oysters guidelines, 2017, NSW Department of Primary Industries, Nelsons Bay [www.dpi.nsw.gov.au/__data/assets/pdf_file/0009/738972/Healthy-Estuaries-for-Healthy-Oysters-Guidelines.pdf (PDF 2.5MB)]
DPI 2017b, NSW Oyster Industry Sustainable Aquaculture Strategy 2016, 3rd edition, NSW Department of Primary Industries, Nelson Bay [www.dpi.nsw.gov.au/__data/assets/pdf_file/0006/638250/NSW-oyster-industry-sustainable-aquaculture-strategy-2016.pdf (PDF 1.4MB)]
DPI 2009, Land Based Sustainable Aquaculture Strategy 2017, NSW Department of Primary Industries, Nelsons Bay [https://www.dpi.nsw.gov.au/fishing/aquaculture/publications/general/nsw-lbsas]
Finley L & Yee N 2018, Eurobodalla Estuarine Macrophyte Mapping Project, Elgin Associates Pty Ltd, Bega, NSW
Fowler MF, Parkinson K & Booth DJ 2017, ‘New poleward observations of 30 tropical reef fishes in temperate southeastern Australia’, Marine Biodiversity, pp. 1–6 [link.springer.com/article/10.1007%2Fs12526-017-0748-6]
Hallett CS, Valesini F, Scanes P, Crawford C, Gillanders BM, Pope A, Udy J, Fortune J, Townsend S, Barton J, Ye Q, Ross DJ, Martin K, Glasby T & Maxwell P 2016, ‘A review of Australian approaches for monitoring, assessing and reporting estuarine condition: II. State and territory programs’, Environmental Science & Policy, 66, pp. 270–81
Harvell CD, Mitchell CE, Ward JR, Altizer S, Dobson AP, Ostfeld RS & Samuel MD 2002, ‘Climate warming and disease risks for terrestrial and marine biota’, Science, 296, pp. 2,158–62
Havenhand J, Fenina-Raphaela B, Thorndyke M & Williamson JE 2008, ‘Near-future levels of ocean acidification reduce fertilization success in a sea urchin’, Current Biology: CB. 18. R651-R652. 10.1016/j.cub.2008.06.015. [www.researchgate.net/publication/23151193_Near-future_levels_of_ocean_acidification_reduce_fertilization_success_in_a_sea_urchin]
Hobday AJ, Okey TA, Poloczanska ES, Kunz TJ & Richardson AJ (eds) 2006, Impacts of Climate Change on Australian Marine Life: Part B Technical Report, report to the Australian Greenhouse Office, Canberra [eprints.utas.edu.au/2534]
MEMA 2017, NSW Marine Estate Threat and Risk Assessment, Marine Estate Management Authority, NSW Department of Industry [www.marine.nsw.gov.au/__data/assets/pdf_file/0006/672198/NSW-Marine-Estate-Threat-and-Risk-Assessment-background-environmental-information-TARA-report.pdf (PDF)]
MEMA 2018, NSW Marine Estate Management Strategy 2018–2028, Marine Estate Management Authority, NSW Department of Industry [www.marine.nsw.gov.au/__data/assets/pdf_file/0007/815596/Marine-Estate-Management-Strategy-2018-2028.pdf (PDF 12.3MB)]
Mitchell ML & Adam P 1989, ‘The decline of saltmarsh in Botany Bay’, Wetlands (Australia), 8, pp. 55–60
Murray A & Keable SJ 2013, ‘First report of Sabella spallanzanii (Gmelin, 1791) (Annelida: Polychaeta) from Botany Bay, New South Wales, a northern range extension for the invasive species within Australia’, Zootaxa, 3670, pp. 394–5
NHMRC 2008, Guidelines for Managing Risks in Recreational Water, National Health and Medical Research Council, Canberra [nhmrc.gov.au/about-us/publications/guidelines-managing-risks-recreational-water]
OEH 2016, Assessing estuary ecosystem health: Sampling, data analysis and reporting protocols, NSW Natural Resources, Monitoring, Evaluation and Reporting Program, April 2016, Office of Environment & Heritage, Sydney [www.environment.nsw.gov.au/soc/assess-estuary-ecosystem-health-160250.htm]
OEH 2017, State of the Beaches 2016–2017, Office of Environment & Heritage, Sydney [www.environment.nsw.gov.au/research-and-publications/publications-search/state-of-the-beaches-2016-2017]
Parker LM, Ross PM & O’Connor WA 2010, ‘Comparing the effect of elevated pCO2 and temperature on the fertilization and early development of two species of oysters’, Marine Biology, 157, pp. 2435–52
Parker LM, Ross PM, Connor WA, Pörtner HO, Scanes E & Wright JM 2013, ‘Predicting the response of molluscs to the impact of ocean acidification’ Biology, 2(2), pp. 651–92
Pecl GT, Doubleday Z, Ward T, Clarke S, Day J, Dixon C, Frusher S, Gibbs P, Hobday A, Hutchinson N, Jennings S, Jones K, Li X, Spooner D & Stoklosa R 2011, Risk assessment of impacts of climate change for key marine species in south eastern Australia. Part 2: Species profiles, Fisheries and Aquaculture Risk Assessment, Fisheries Research and Development Corporation, Project 2009/070
Roper T, Creese B, Scanes P, Stephens K, Williams R, Dela-Cruz J, Coade G, Coates B & Fraser M 2011, Assessing the Condition of Estuaries and Coastal Lake Ecosystems in NSW, Monitoring, Evaluation and Reporting Program Technical Report, NSW Office of Environment & Heritage, Sydney [www.environment.nsw.gov.au/soc/socTechReports.htm]
Ross PM, Parker L, O’Connor WA & Bailey EA 2011, ‘The impact of ocean acidification on reproduction, early development and settlement of marine organisms’, Water, 3, 1005–3 [www.mdpi.com/2073-4441/3/4/1005]
Saintilan N & Williams RJ 1999, ‘Mangrove transgression into saltmarsh environments in south-east Australia’, Global Ecology and Biogeography, 8, pp. 117–24
Scanes E, Parker LM, O’Connor WA & Ross PM 2014, ‘Mixed effects of elevated pCO2 on fertilisation, larval and juvenile development and adult responses in the mobile subtidal scallop Mimichlamys asperrima (Lamarck, 1819)’, Plos One, e93649
Scanes E, Parker LM, O'Connor WA, Stapp LS & Ross PM 2017, ‘11 Intertidal oysters reach their physiological limit in a future high-CO2 world’, Journal of Experimental Biology, 220(5), pp. 765–74
Smale DA & Wernberg T 2013, ‘Extreme climatic event drives range contraction of a habitat-forming species,’ Proceedings of the Royal Society of London B: Biological Sciences, 280, 20122829
Sweet M, Bulling M & Williamson J 2016, ‘New disease outbreak affects two dominant sea urchin species associated with Australian temperate reefs’, Marine Ecology Progress Series, 551, pp. 171–83 [www.researchgate.net/publication/301826370_New_disease_outbreak_affects_two_dominant_sea_urchin_species_associated_with_Australian_temperate_reefs]
Truscott Z, Booth DT & Limpus CJ 2017 ‘The effect of on-shore light pollution on sea-turtle hatchlings commencing their off-shore swim’, Wildlife Research 44(2), pp. 127–34 [doi.org/10.1071/WR16143]
Umwelt 2017, Towra Point Nature Reserve Ramsar Site, Formal Assessment of Change in Ecological Character, Prepared by Umwelt (Australia) Pty Ltd and Avifauna Research and Services on behalf of the Australian Government Department of the Environment and Energy, Canberra, June 2017
Vergés A, Doropoulos C, Malcolm HA, Skye M, Garcia-Pizá M, Marzinelli EM, Campbell AH, Ballesteros E, Hoey AS, Vila-Concejo A & Bozec YM 2016, ‘Long-term empirical evidence of ocean warming leading to tropicalization of fish communities, increased herbivory, and loss of kelp’, Proceedings of the National Academy of Sciences, 113(48), pp. 13, 791–6
Wernberg T, Russell BD, Moore PJ, Ling SD, Smale DA, Campbell A, Coleman MA, Steinberg PD, Kendrick GA & Connell SD 2011, ‘Impacts of climate change in a global hotspot for temperate marine biodiversity and ocean warming’, Journal of Experimental Marine Biology and Ecology, 400, pp. 7–16
West G & Williams RJ 2008, A preliminary assessment of the historical, current and future cover of seagrass in the estuary of the Parramatta River, NSW Department of Primary Industries, Sydney