 Image source and description
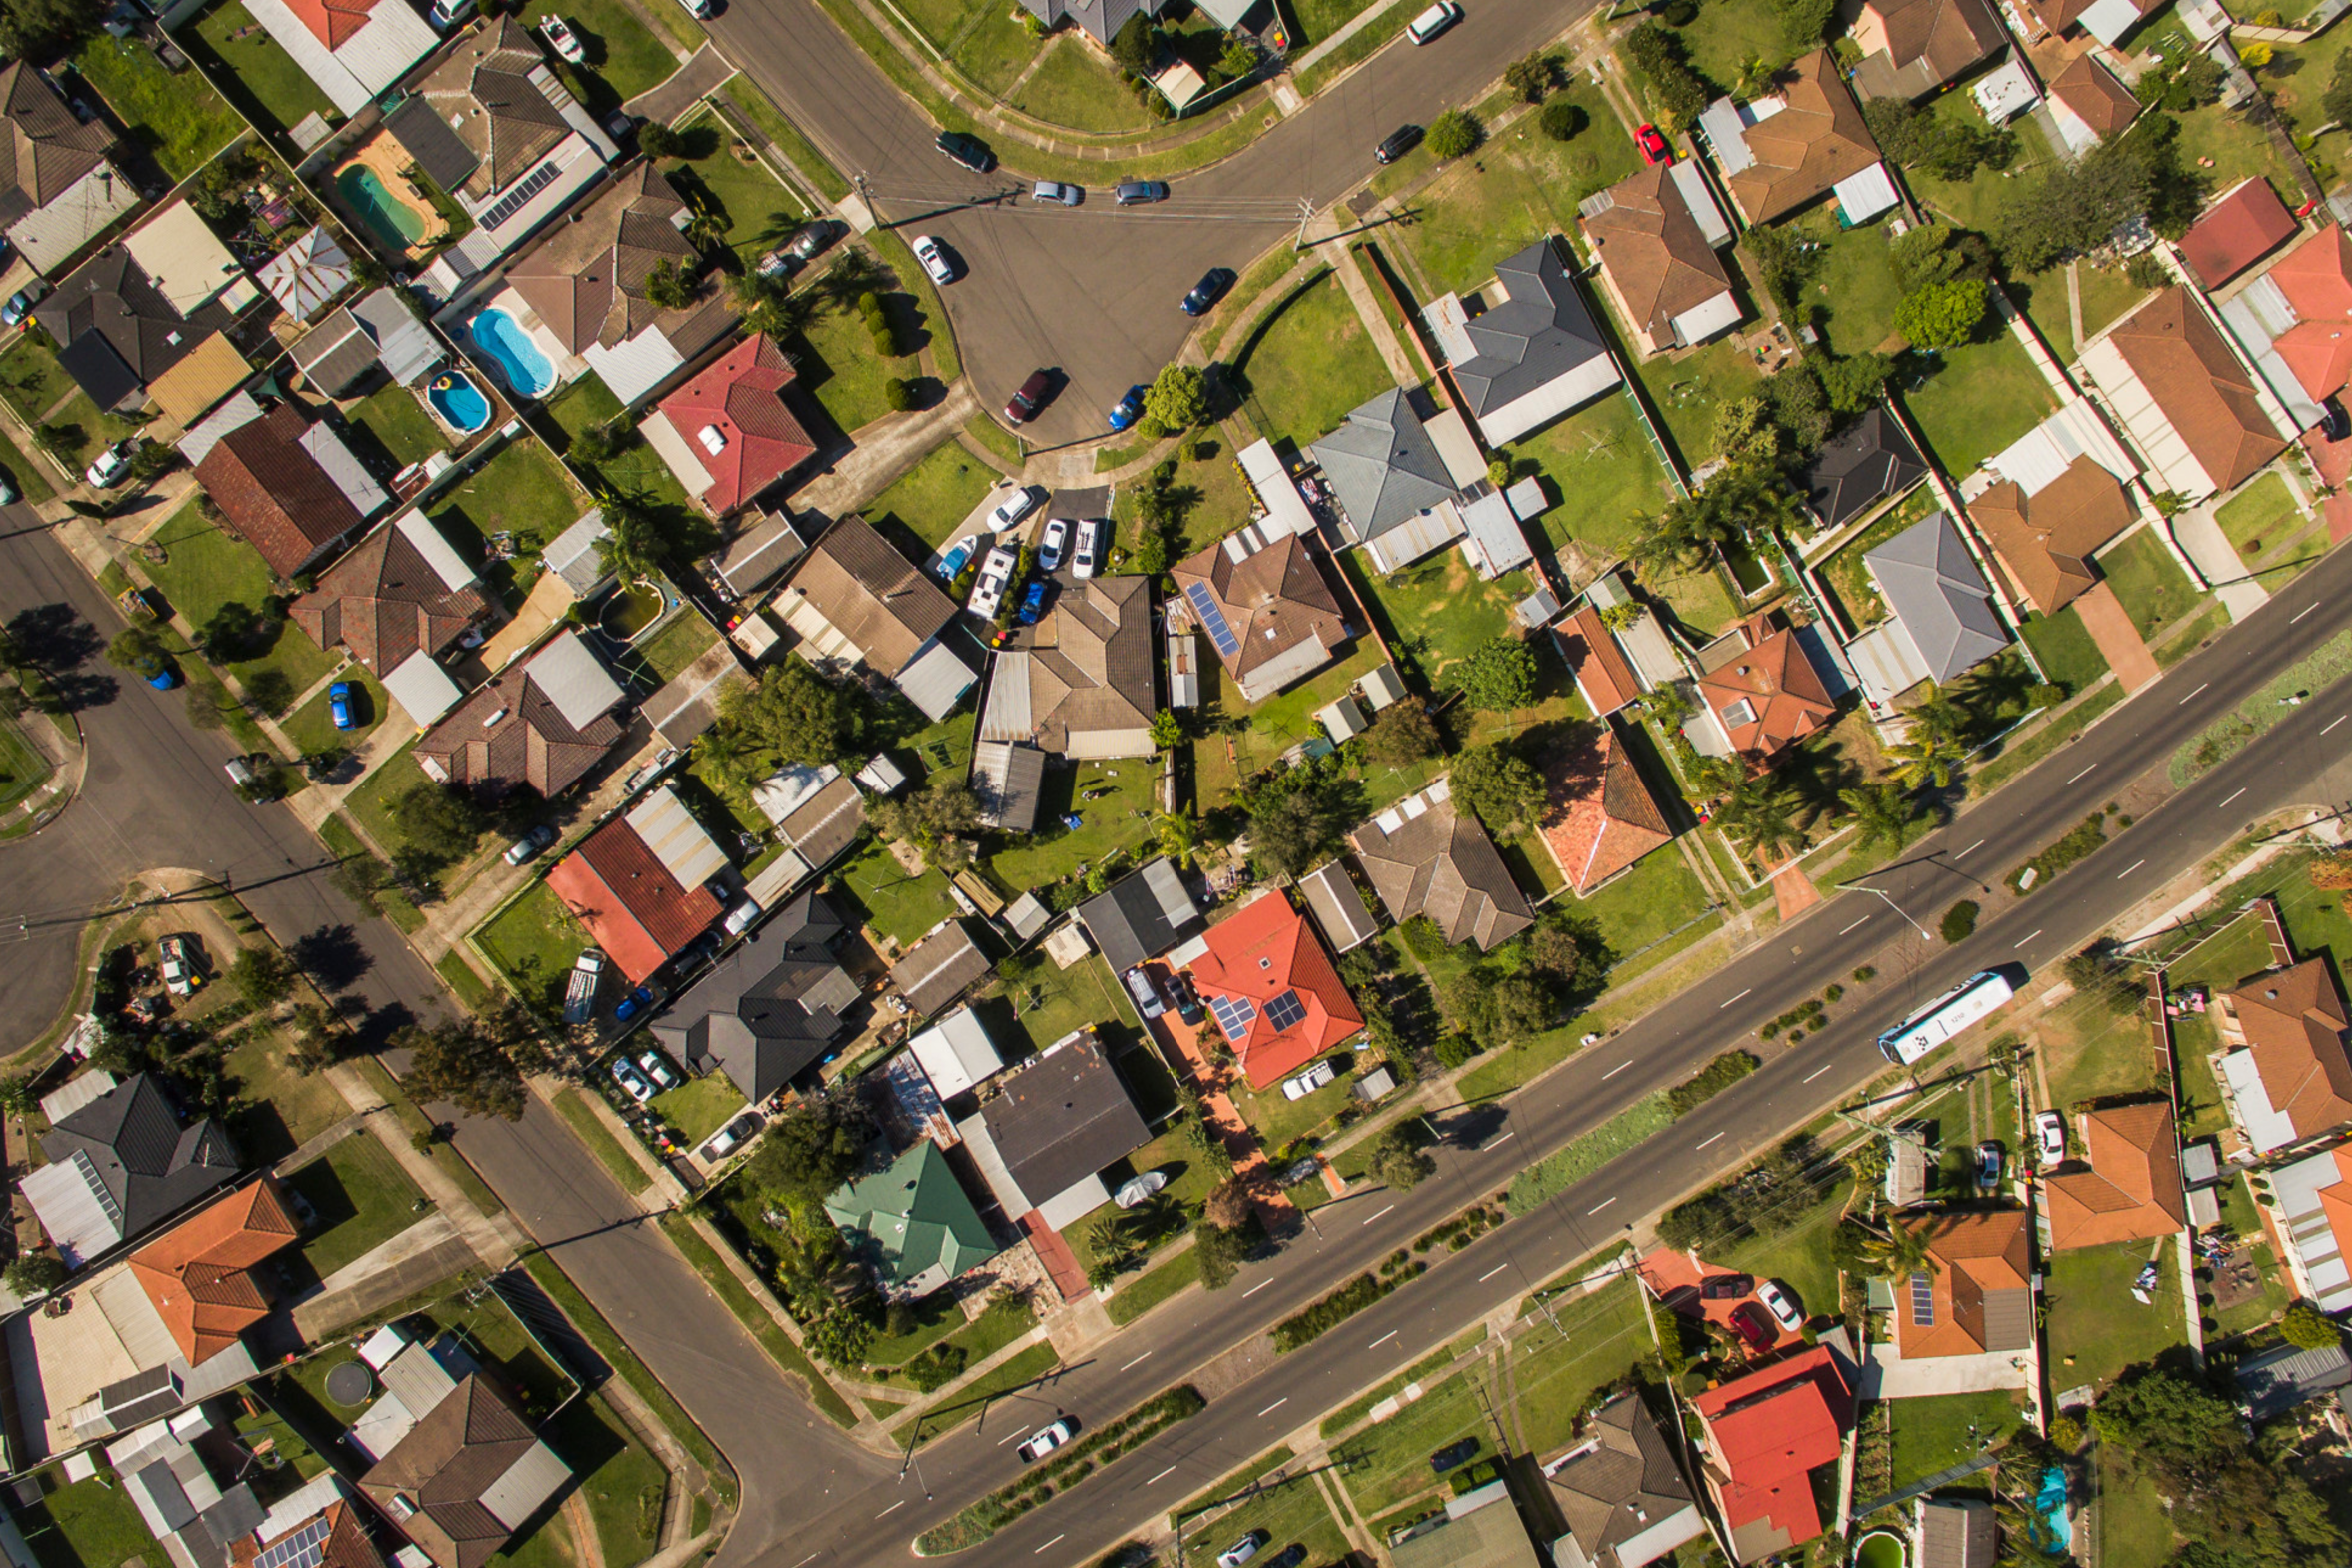
Topic image:Dharug Country–Sydney. Photo credit: John Spencer/EPA (2017).Banner image:Topic image sits above Butjin Wanggal Dilly Bag Dance by Worimi artist Gerard Black. It uses symbolism to display an interconnected web and represents the interconnectedness between people and the environment.
Image source and description
Topic image:Dharug Country–Sydney. Photo credit: John Spencer/EPA (2017).Banner image:Topic image sits above Butjin Wanggal Dilly Bag Dance by Worimi artist Gerard Black. It uses symbolism to display an interconnected web and represents the interconnectedness between people and the environment.
Population and the environment 2024
Population change and human behaviour are major drivers of environmental change and have widespread impacts.
NSW State of the Environment
This Population and the environment 2024 page reflects the State of the Environment 2024 report as tabled in parliament for this section.
Overview
The human population of earth has been increasing exponentially since the late 1800s and now exceeds 8 billion people ().
Humans have always relied on the natural resources that our environment provides, including food, water, shelter and medicines. Our interactions with the environment continue to shape our cultures and societies. With current patterns of resource use and environmental modification, our increasing population puts significant strain on nature’s ability to support us.
Considering trends and changes in human populations is an important aspect in examining environmental conditions and trends, because many issues facing the environment are caused or exacerbated by human actions (; ).
Since the Industrial Revolution of the late 1700s, there has been continued improvement in our ability to acquire and process environmental resources, as well as an acceleration in our rates of resource use. These have allowed us to substantially improve human health and living conditions, which in turn has led to the increase in the global population.
The relationship between populations and environmental damage is complex. Population growth alone is not the most important factor: human behaviour also plays a part (), as do demographic trends, such as population density (). The types of technology and infrastructure used to convert resources and energy to the goods and services that humans consume are also important ().
In wealthy countries such as Australia, the standard of living has also increased significantly, especially since the Second World War. Technological innovations over this period have made it possible to use resources such as energy, water and minerals much more efficiently, which can help offset the potential impacts of population growth. However, these benefits are undermined if the consumption of resources and generation of waste products and emissions continue to outpace what nature can safely provide (). See the topic for more information.
Significant environmental issues of our time, such as climate change, land, air and water pollution, habitat degradation and fragmentation, and species extinction rates, are tied to increasing demands on resources, energy and land, and the associated pollution and waste. These impacts are getting worse, and some ecosystems are now at risk of collapse (; ).
These impacts on environmental health can have serious consequences for human health and wellbeing. For example, extreme heat events are increasing with climate change and the removal of trees and urban development are amplifying them. This is likely to cause health problems for people exposed to them. See and topics for more information.
Other threats related to increasing environmental degradation include impacts on food production, reduced access to drinkable water, and increased exposure to illness caused by pollution and diseases related to destruction of habitat ().
Related topics: | | |
NSW population trends
There were 8.3 million people living in NSW as at June 2023 (). Of these:
- 5.1 million (61%) lived in Greater Sydney
- 1.9 million (23%) lived in coastal areas
- 1.3 million (16%) lived inland.
Over the five-year period from June 2018 to June 2023, the State’s population grew by more than 387,000 people ().
The key trends in the growth and distribution of the NSW population include:
- movement of young people from rural areas to cities, or interstate, for education and employment
- an ageing population – 17.5% of the NSW population is currently 65 years or older, and this group will get larger ()
- movement of retirees (‘tree changers’ and ‘sea changers’) to popular areas on the coast, along the Murray River and to locations within easy driving distance of cities
- movement of young families to regional areas
- predominance of young adults immigrating from overseas, especially temporarily.
Overall, these trends have led to growth in our cities and large towns. This growth is accompanied by a high demand for housing, consumer products and transport services, putting continued pressure on our environment.
In regional areas especially, the environmental impacts of these trends include land clearing or repurposing for housing and infrastructure, increased use of local resources such as water, and increased waste and emissions.
Understanding how the NSW population is changing is critical to planning processes for:
- managing the impacts of population growth on the environment and biodiversity
- reducing resource and energy use associated with population growth
- reducing pollution, waste and emissions
- enhanced liveability
- sustainable land use.
Two major factors governing population change in NSW are:
- natural change – the difference between births and deaths, which can be positive or negative
- migration – both within Australia and from overseas.
Over the past 40 years, net overseas migration has been the most significant contributor to population growth in NSW, while the rate of natural change has remained relatively stable.
Figure D1.1 shows that the population growth rate in NSW was slowing before the COVID-19 pandemic but has since rebounded. As international travel restrictions were eased in early 2022, the rise in overseas arrivals contributed to record growth of 2.1% in 2023, the fastest annual growth rate since 1981 ().
Regional NSW is home to a relatively small share of overseas immigrants. Population growth in regional areas is more likely related to the migration of city residents to rural areas.
Figure D1.1: Population change in NSW, Greater Sydney and regional NSW, 2014–23
Notes:
Greater Sydney extends from Hawkesbury River in the north to the Royal National Park in the south and includes the Blue Mountains, Wollondilly and Hawkesbury local government areas in the west. The historic results have been updated to reflect the definition of Greater Sydney as not including the Central Coast.
Figures up to 2021 are final. Figures for 2022 and 2023 are preliminary and subject to change.
Population density
Population density is measured as the number of people per square kilometre. Increasing density is related to an increase in population size combined with increasing urbanisation.
Population density in NSW has risen. In June 2023, there were an average of 10.4 people per square kilometre – a 12% rise in the 10 years since 2013.
These changes in density are due to increased medium- and higher-density housing developments across Greater Sydney and regional cities on vacant or under-used land, often replacing low-rise buildings. Greenfield areas on the urban fringes are also being transformed, from large rural lots to detached and semi-detached houses on smaller lots and low- and mid-rise apartment developments ().
Across Greater Sydney, the average population density grew by 17% during 2013–2023, reaching 488 people per square kilometre in 2023 – about 70 people per square kilometre more than 10 years earlier.
Map D1.1 shows that population density is highest in Greater Sydney. Densities range from fewer than one person per square kilometre in the Far West region of NSW to more than 17,000 people per square kilometre in the inner-city suburbs of Haymarket, Chippendale, Wolli Creek and Zetland.
There is also a large variation in population density within Sydney, which has as few as 50 people per square kilometre in some areas.
Map D1.1: Population density of NSW, 2023
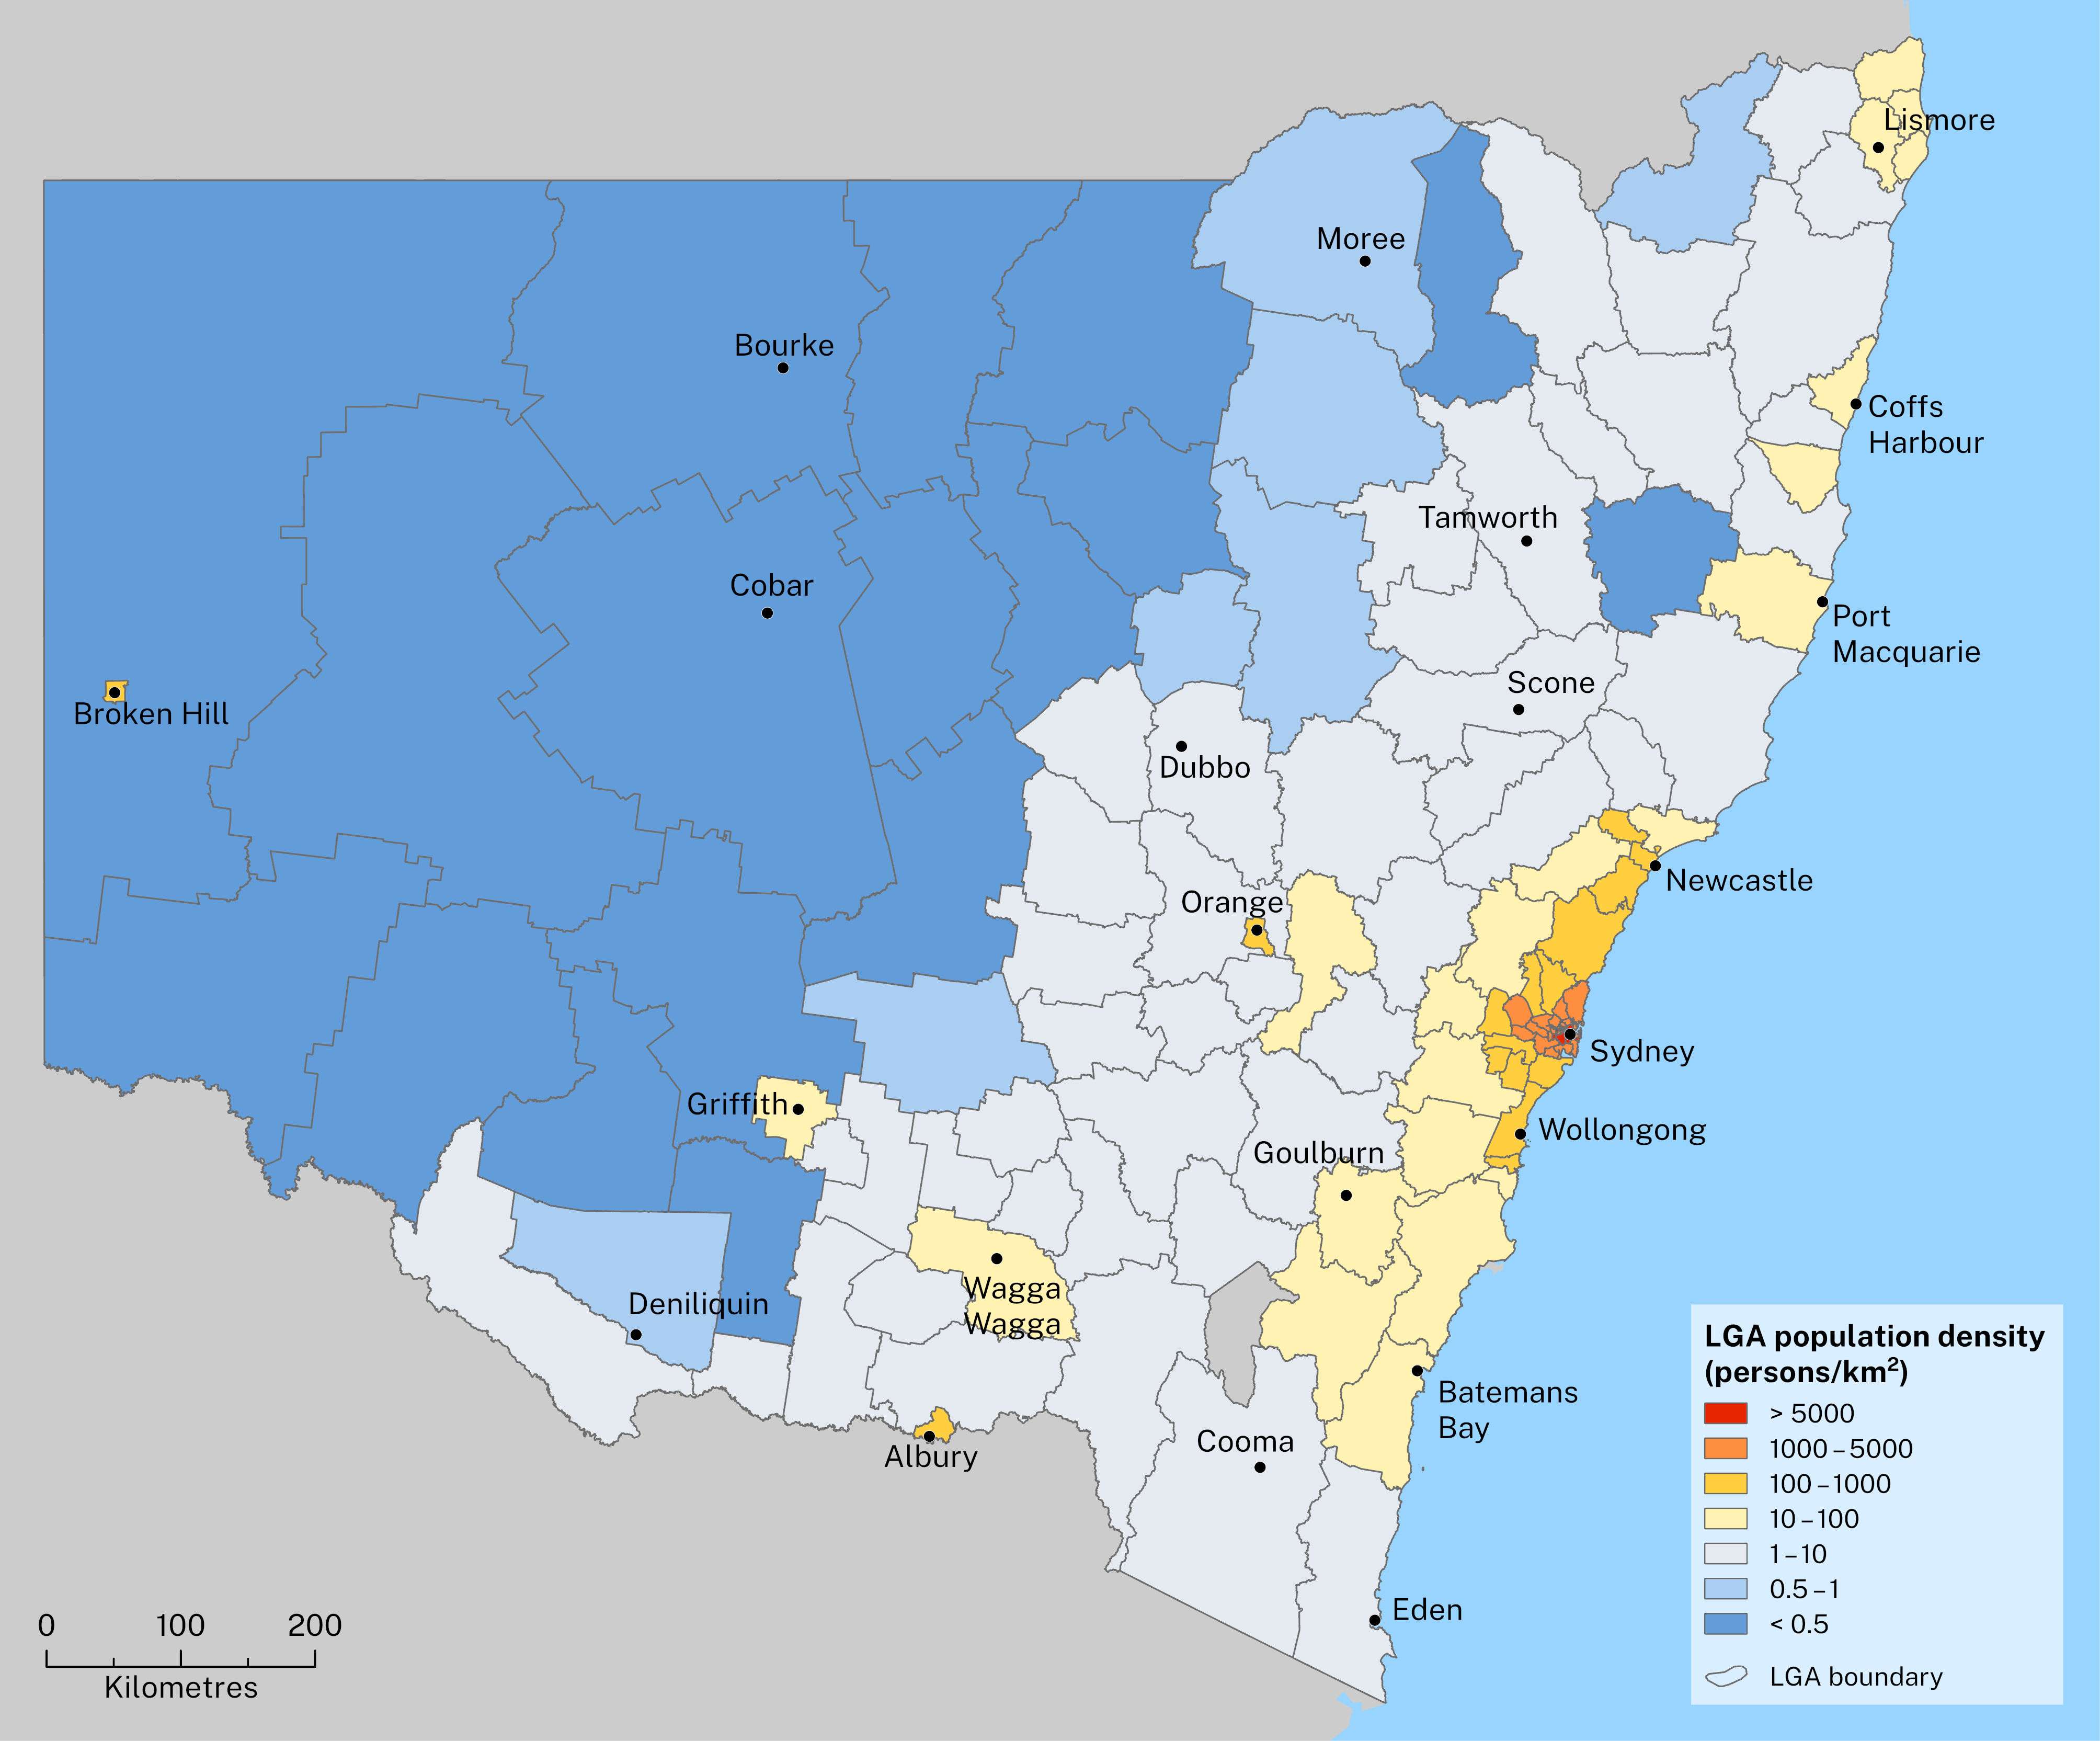
Outside of Sydney, higher population densities are found in parts of Newcastle, Shellharbour, Lake Macquarie, Wollongong, Albury and Orange.
Differences in population density around the State have implications for the provision and sustainability of services and infrastructure. Policies that aim to improve connectivity, such as transport-oriented development, can increase the trend towards high-density housing.
In areas with more people, medium- and high-density housing can increase the efficiency of service delivery and reduce the per person use of energy, water, waste removal services and demand for land ().
Cities and urban areas that have higher density and good public transport have lower transport energy use per capita () and lower car ownership and use. These characteristics can provide overall benefits in urban amenity. Increasing urban density can also free up land for open space.
In the absence of careful land use planning, high-density populations can put more pressure on the local environment and increase noise pollution and traffic congestion (; ). People living in high-density areas may be more exposed to air pollution and urban heat (; ).
These problems can be offset by providing more green space, improving public transport, urban design that encourages walking and cycling, and electrification of transport.
Tracking investment in housing shows that single dwellings constructed in NSW fell from 74% of private dwellings in 1990–91 to 53% in 2022–23. Multiple-dwelling (apartment) construction peaked in 2017–18 at 58% (Figure D1.2).
A continued focus on redevelopment of land for medium-density housing means a likely fall in the share of single dwellings in the future, which will reduce biodiversity impacts but may increase the amount of waste generated by demolishing existing dwellings.
Figure D1.2: Percentage of single and multiple dwellings
Notes:
The annual value of private residential construction.
Where are we growing?
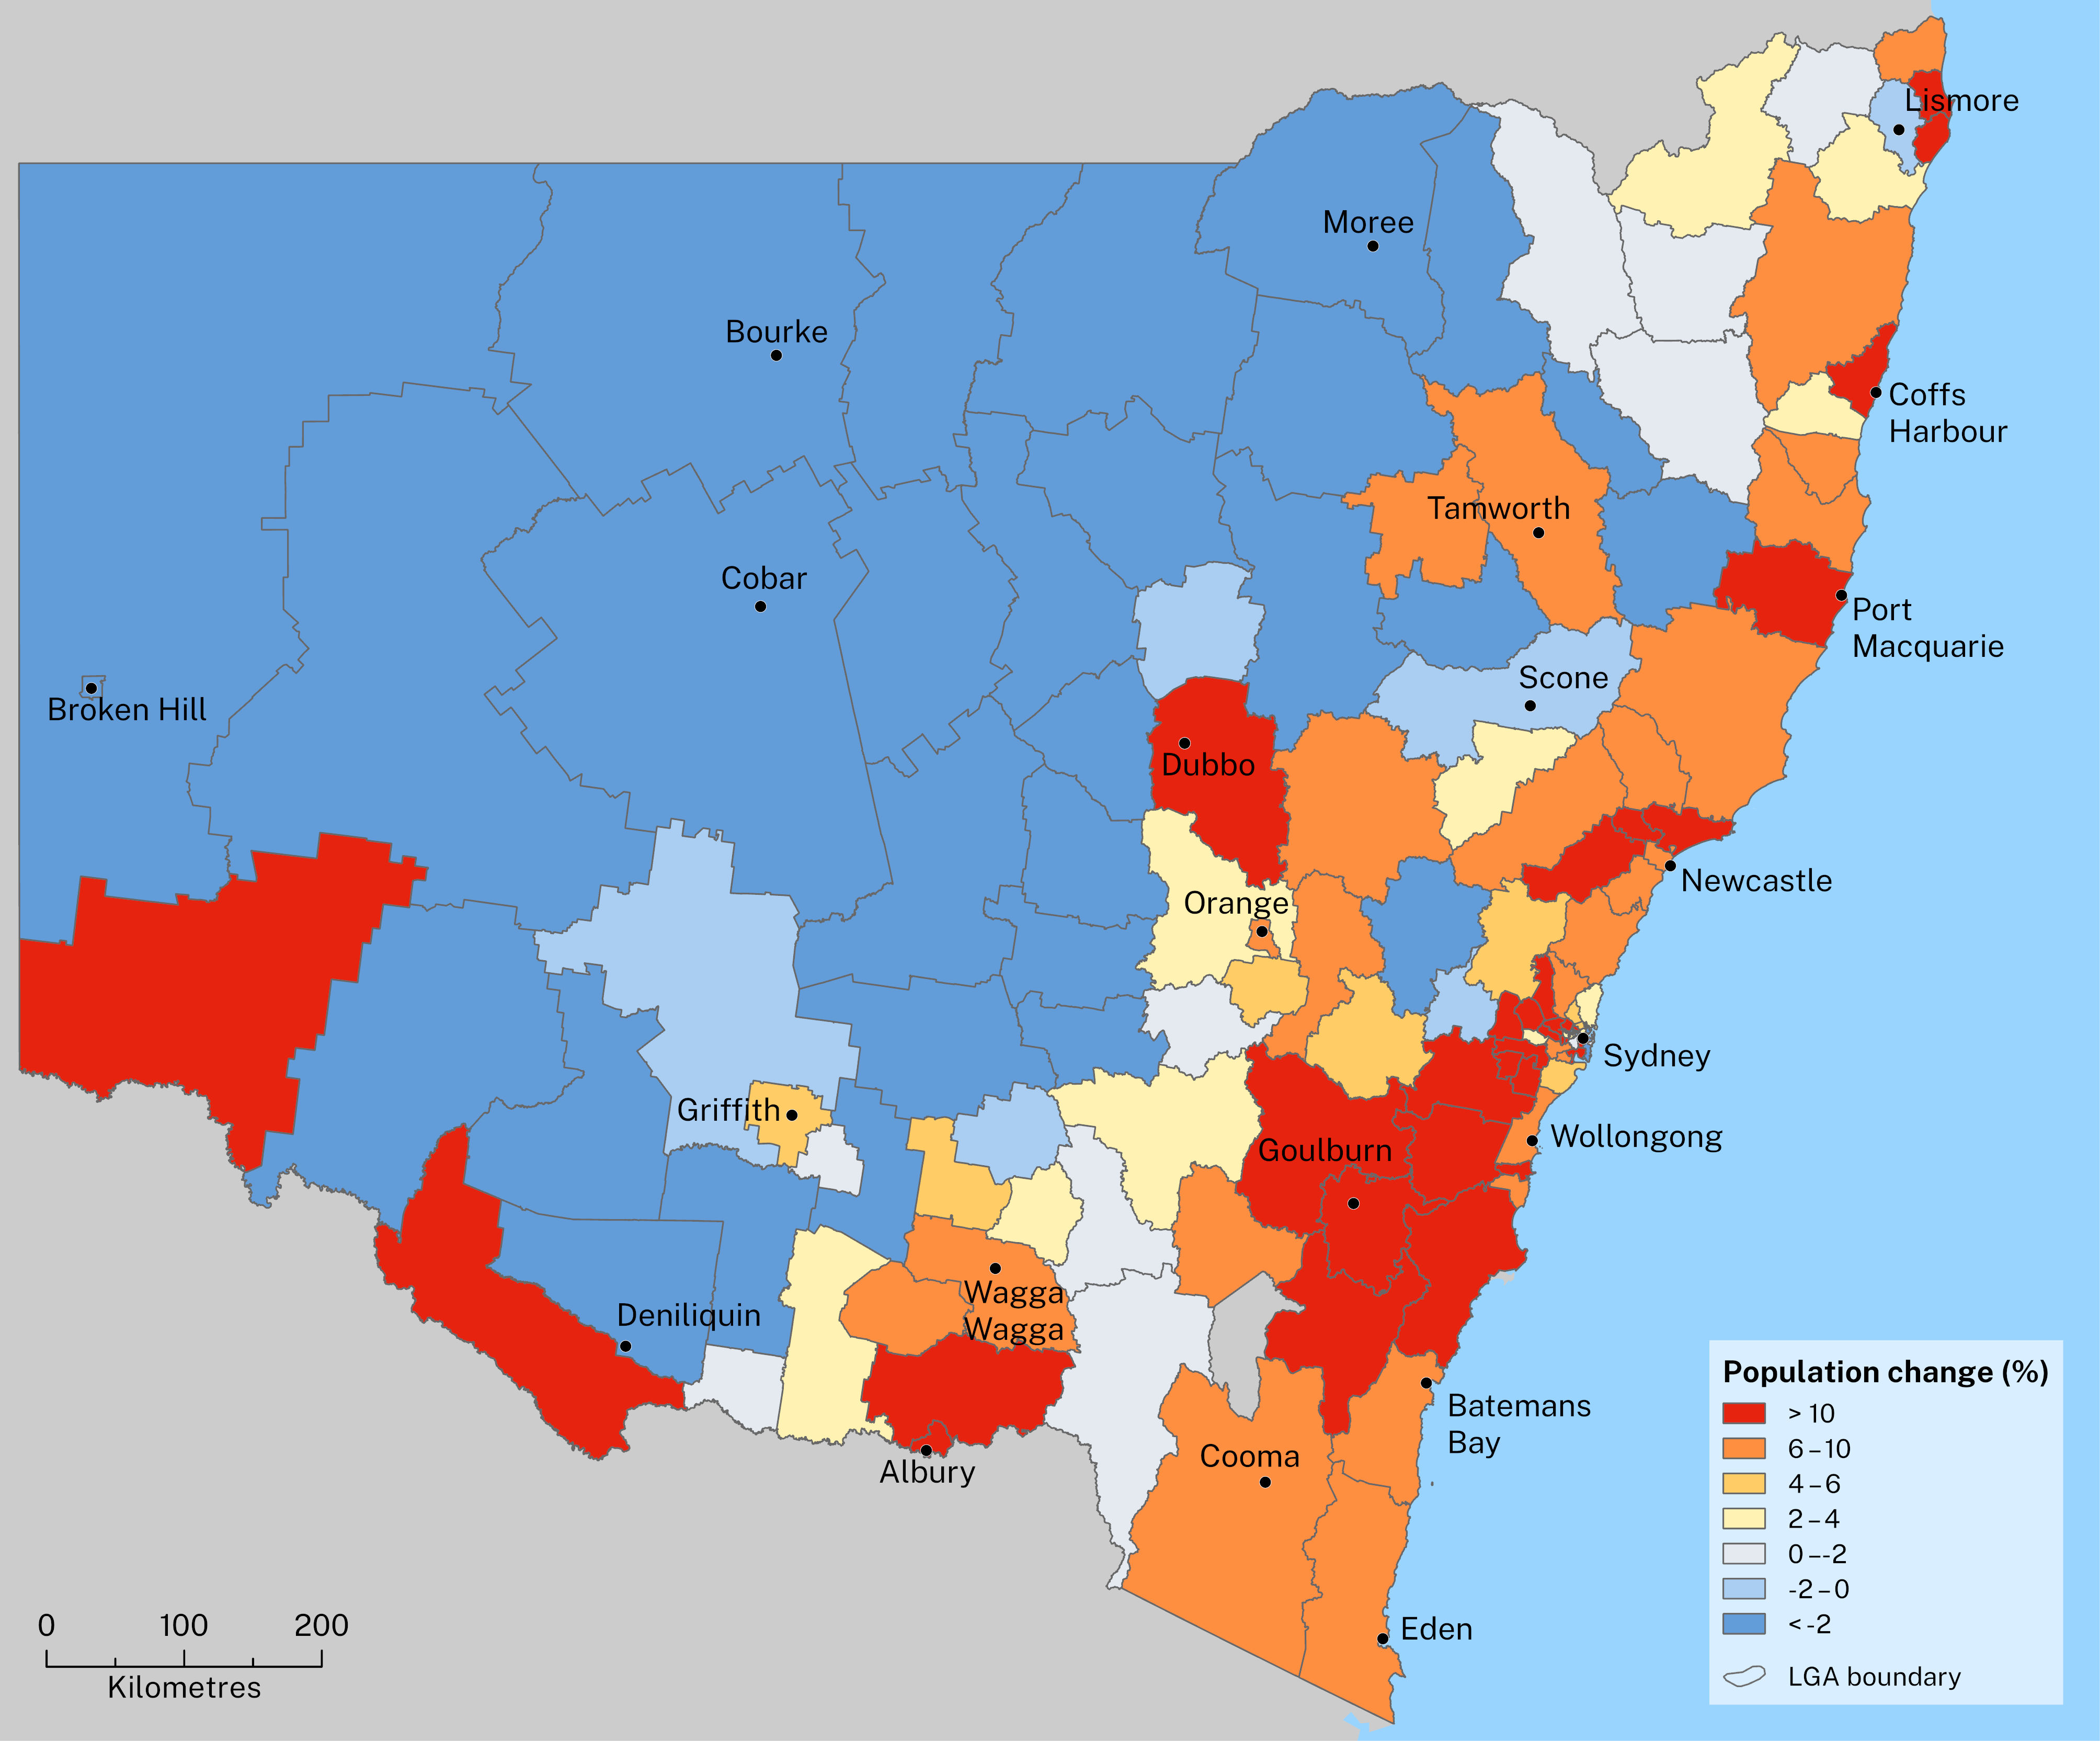
Between 2013 and 2023, the urban fringe areas in the north-west and south-west of Greater Sydney showed the highest growth in the State, along with Maitland and Cessnock in the Hunter region. The lowest growth rates occurred in far western NSW (see Map D1.2). More detailed information is available on the Australian Bureau of Statistics website ().
Higher growth rates in areas of high density will put increased pressures on services and infrastructure.
Map D1.2: Population change in NSW, 2013–23
Future growth
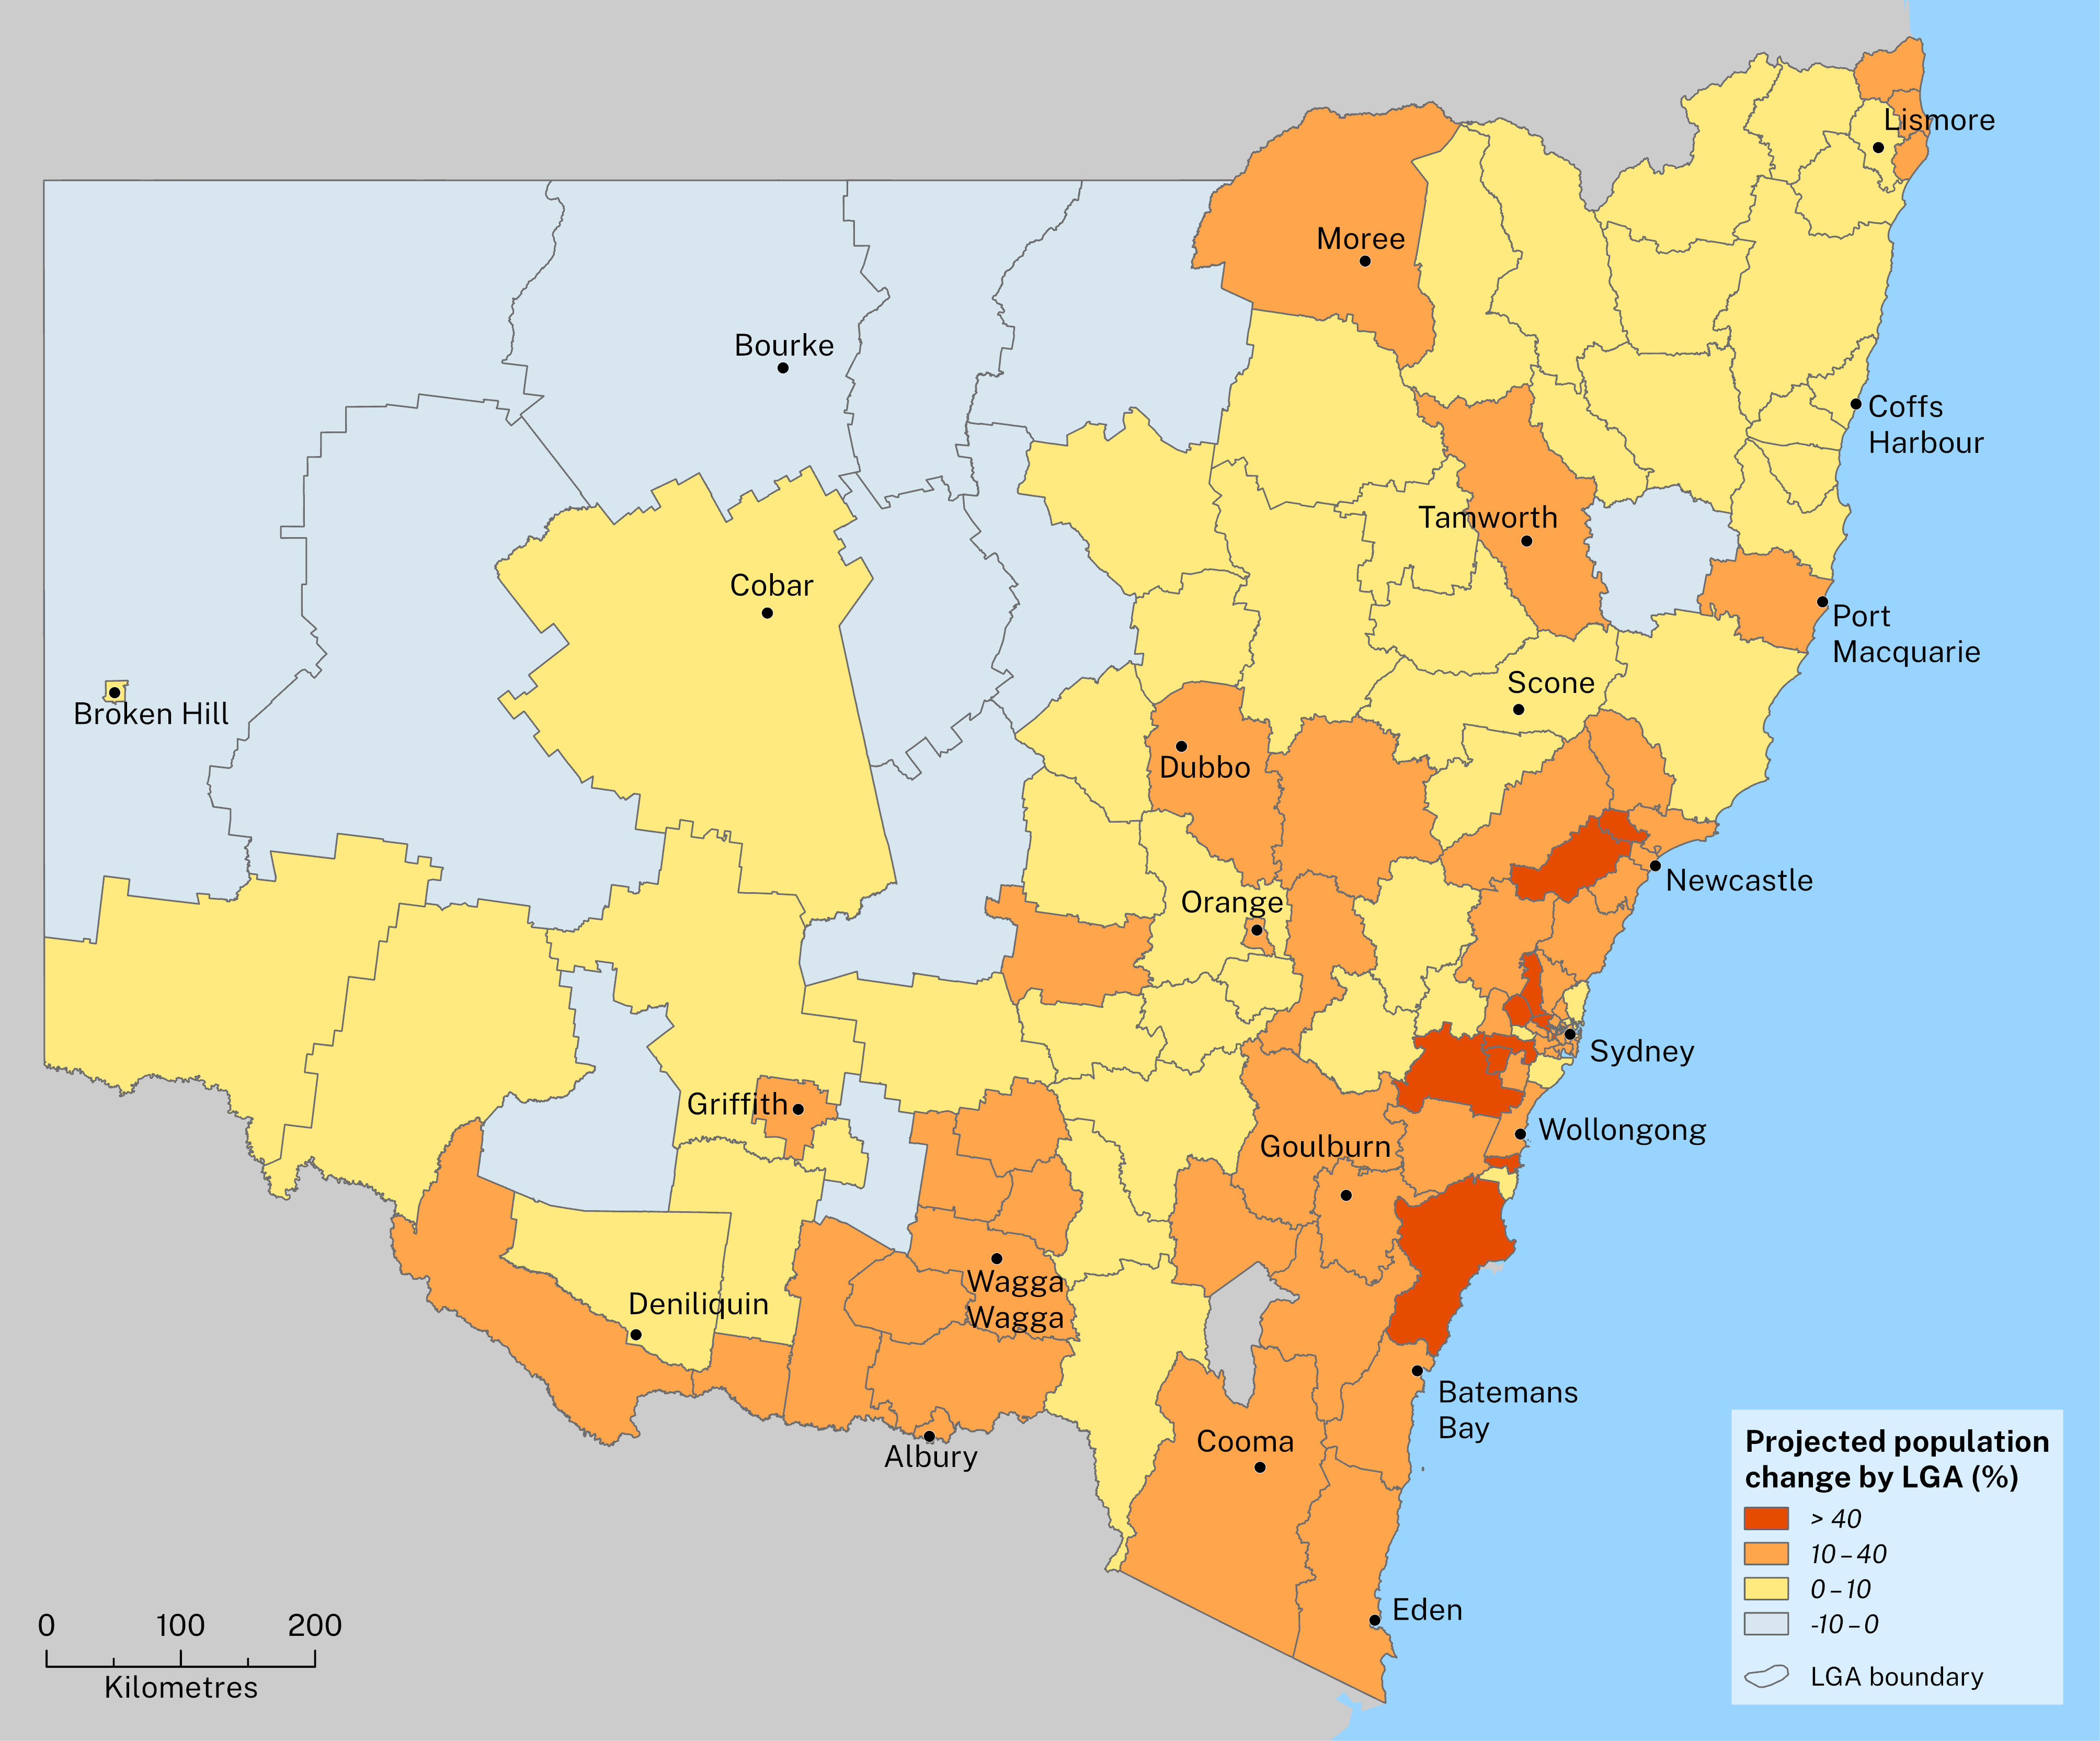
By 2041, the NSW population is expected to grow to 10.1 million people, and that in Greater Sydney to about 6.3 million. Map D1.3 shows projected population change across the State between 2021 and 2041. Further detail on these projections is available on the Department of Planning, Housing and Infrastructure (DPHI) website.
Map D1.3: Projected population change, 2021–41
An ageing population
Understanding the age patterns in the population helps government make decisions, such as the best locations for particular types of new housing, and where to provide services, such as education and healthcare.
The NSW population continues to get older. The age profile of communities varies throughout NSW, with some a lot older than others. These variations are influenced by where people decide to live. For example, older people may retire from the cities to the coast or nearby inland towns putting more pressure on local resources in those areas. Older people are more vulnerable to the impacts of environmental threats, such as heatwaves and floods (; ).
Greater Sydney has a younger population than regional NSW (see Figure D1.3), due to natural increase (births outnumbering deaths), overseas migration, which is dominated by young adults, and the arrival of young people from around Australia. Regional areas lose young people to the bigger regional cities and Greater Sydney. With fewer young adults and proportionally more older people, some regional areas are in natural decline (deaths outnumber births). While the arrival of people around retirement age contributes to growth, it slows the pace of growth.
The number of retirees is similar between regional NSW and Greater Sydney, despite the difference in total population.
Figure D1.3: Age profile of Greater Sydney and regional NSW, 2023
Environmental impacts
The NSW Government implements policies and programs that aim to reduce the environmental impacts of population growth. Comparing trends in population growth with measures of impact can help assess the effectiveness of these policies.
Figure D1.4 compares population growth with trends in resource use and pollution since 2005. It shows that between 2005 and 2023, waste generation outpaced population growth, while other environmental indicators grew at a slower rate or even decreased.
Figure D1.4: NSW population growth compared with trends in energy, greenhouse gas emissions, transport, water and waste, 2006–23
Notes:
All values for each indicator have been adjusted to a baseline of 100% for that year.
Population figures (ABS 2023b) are regularly revised for each quarter, until the final update, 22 months after each Census.
Data for greenhouse gas emissions are available only to 2021.
Before 2015–16, waste generation data were available only on a two-yearly basis. The most recent data used to project emissions come from 2020–21.
Figure D1.4 shows the following:
- Vehicle kilometres travelled, which is a measure of transport pressure, was increasing at the same rate as population growth and is rebounding after a sharp decline related to COVID-19 restrictions from 2019 to 2021. See for more information.
- Total energy use has been steadily declining since 2010–11, with minor fluctuations. Energy consumption is decreasing primarily owing to energy efficiency measures and increased uptake of renewable energy, such as rooftop solar electricity. See for more information.
- Emissions of greenhouse gases have generally decreased, although there was a slight increase in 2017–18. See for more information.
- After dipping during the COVID-19 lockdowns, total waste generation is again increasing. In populated areas, waste products (including solid waste, sewage, hazardous waste and atmospheric emissions) need to be managed to reduce stress on natural ecosystems. See and for more information.
- Water usage is sensitive to weather patterns and water availability. Before the 2017–20 drought, urban water consumption was increasing, generally tracking population growth. More recently, consumption has trended downwards, reaching as low as 849 gigalitres in 2021–22 (2% less than was used in 2005–06). This decrease is most likely a result of water restrictions, water efficiency measures and behaviour change among users. For more detail on water extraction and use by industry and agriculture and the environmental share of available water, see for more information.
While overall these trends are positive, Figure D1.4 does not show whether the levels are sustainable. The NSW environment’s ‘carrying capacity’ – that is, its capacity to provide resources without causing environmental harm (; ) – has not been estimated, and so these trends cannot be compared to sustainable levels of consumption or output.
The chart also does not reflect the potential environmental impacts of NSW exports (such as coal and minerals) in other countries or the contribution of imported goods (such as clothing and electronic goods) to waste and pollution in NSW.
It is not possible to show the relationship of changing human populations to wildlife and biodiversity in Figure D1.4 because these have not been calculated for NSW. At a national level, it is estimated that between 1950 and 2009, almost one (0.95) species became extinct for every extra one million people in the population ().
Urban expansion has devastating impacts on wildlife in Queensland (). This is largely related to vehicle collisions (see topic for similar information about NSW).
The national State of the Environment report report provides further information about the potential impacts of urban development, especially in coastal areas, and light pollution.
Sustainable planning
Although the NSW Government uses population projections to inform its strategic planning, infrastructure investment and service delivery, it does not develop specific population targets or set limits on population growth.
Some of the harmful impacts of population growth and urbanisation can be mitigated through approaches to urban design, planning and development that aim to balance environmental and human needs. For example:
- Well-designed urban areas with adequate green space can improve liveability and provide habitat for urban wildlife (; ), although it may not be an adequate substitute for the original habitat that was displaced by development.
- The impacts of transport and its associated energy use can be reduced by improving access to active transport (such as walking and cycling) and public transport ().
The NSW Government has developed a range of long-term plans and strategies that aim to promote more sustainable use of land and resources and manage pollution and waste. These include:
- the Waste and Sustainable Materials Strategy
- the Greater Sydney Region Plan – A Metropolis of Three Cities
- 7 plans for regional NSW
- the Greener Places Framework
- Future Transport
- the Net Zero plan
- the NSW Water Strategy.
See the , , , and topics.
Opportunities
There are opportunities to change the way we manage the problems associated with population change and consumption patterns. A range of approaches and frameworks, which are being debated and implemented around the world, seek to improve quality of life for everyone on the planet without causing irreversible environmental harm. These include:
- the Sustainable Development Goals, which provide a blueprint for shared peace and prosperity that promotes economic and social equality and prioritises protection of the environment
- the Planetary boundaries framework, which identifies the safe limits for human impacts on environmental services such as freshwater and biodiversity
- natural capital accounting, an economic approach that includes measurement and valuation of the benefits (such as water) provided by the environment
- Doughnut economics, which combines the Planetary boundaries framework with the concept of a social foundation; that is, the level of resource use that’s required to ensure that all people have a good standard of living
- framing legislation, policy, planning and programs to ensure that nature can be repaired and regenerated rather than degraded by development.
See the topic and page for more information.
While these frameworks and approaches provide hope that we can reduce human impacts on the environment, some scientists are concerned that population growth has outpaced our capacity to manage them through planning (; ).
Addressing our patterns of behaviour and the types of technology and infrastructure deployed in the consumption of resources and energy will also be essential for reducing resource use and pollution.
References
DPE 2023, NSW Population Trends, Department of Planning and Environment, Sydney, 2023
DPHI 2024, written advice from the Department of Planning, Housing and Infrastructure, July 2024