 Image source and description
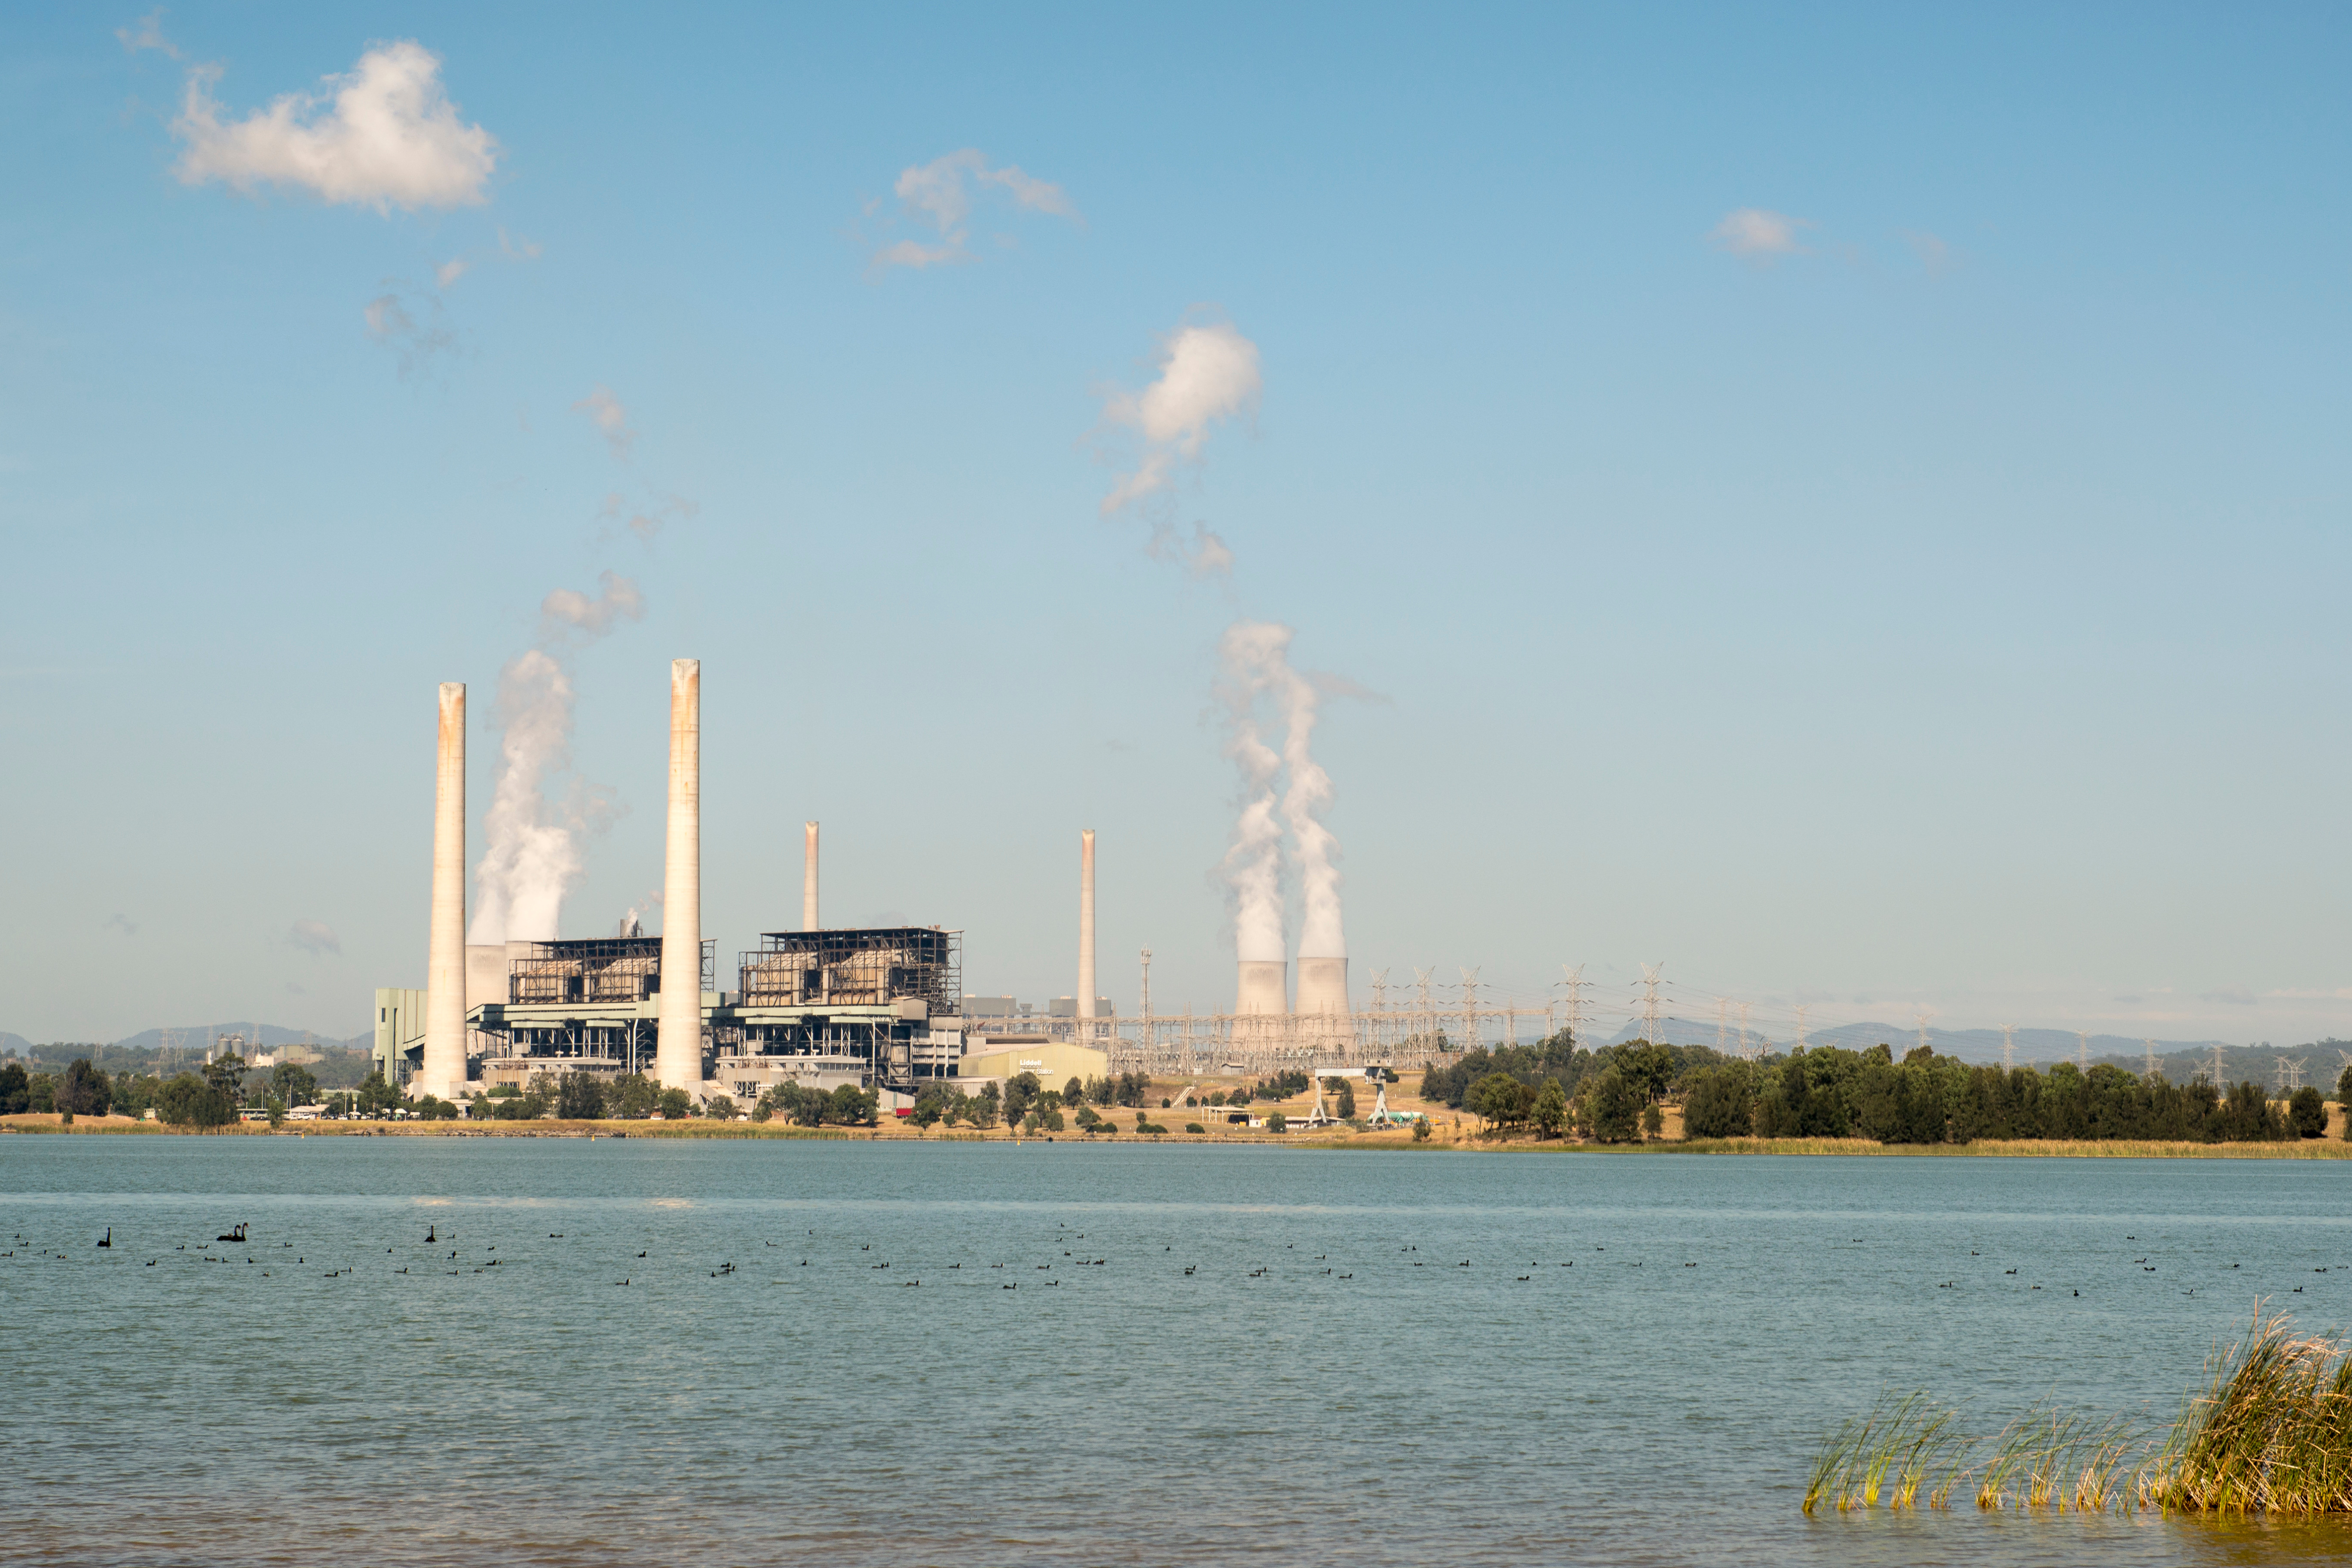
Topic image:Wonnarua Country– Muswellbrook. Photo credit: John Spencer/EPA (2016)Banner image:Topic image sits above Butjin Wanggal Dilly Bag Dance by Worimi artist Gerard Black. It uses symbolism to display an interconnected web and represents the interconnectedness between people and the environment.
Image source and description
Topic image:Wonnarua Country– Muswellbrook. Photo credit: John Spencer/EPA (2016)Banner image:Topic image sits above Butjin Wanggal Dilly Bag Dance by Worimi artist Gerard Black. It uses symbolism to display an interconnected web and represents the interconnectedness between people and the environment.
Greenhouse gas emissions 2024
Human activities release excessive greenhouse gases into our atmosphere, leading to increased temperatures and climate change.
NSW State of the Environment
This Greenhouse gas emissions 2024 page reflects the State of the Environment 2024 report as tabled in parliament for this section.
Overview
Greenhouse gases trap heat in earth’s atmosphere.
Though most are crucial to life on earth, their concentrations in the atmosphere have increased rapidly since the pre-industrial (before 1750) times (). A significant increase – 42% – has occurred over a relatively short period, from 1990 to 2019 ().
These increases are due to human activities and are driving global temperature increases and climate change ().
Among the anthropogenic (caused or influenced by human activity) greenhouse gases, carbon dioxide (CO2) has the highest atmospheric concentration followed by methane (CH4) and nitrous oxide (N2O) (; ).
Most of the carbon dioxide emissions in NSW come from burning of fossil fuels and industrial processes.
Methane emissions in NSW arise mostly from agricultural practices (mainly sheep and cattle digestive processes) and fugitive emissions from the extraction and transport of coal, oil and natural gas. The global warming potential of methane is 28 times that of carbon dioxide over a period of 100 years ().
In NSW, nitrous oxide comes mainly from pastures and crops using nitrogen fertilisers. Its global warming potential is 265 times that of carbon dioxide over 100 years ().
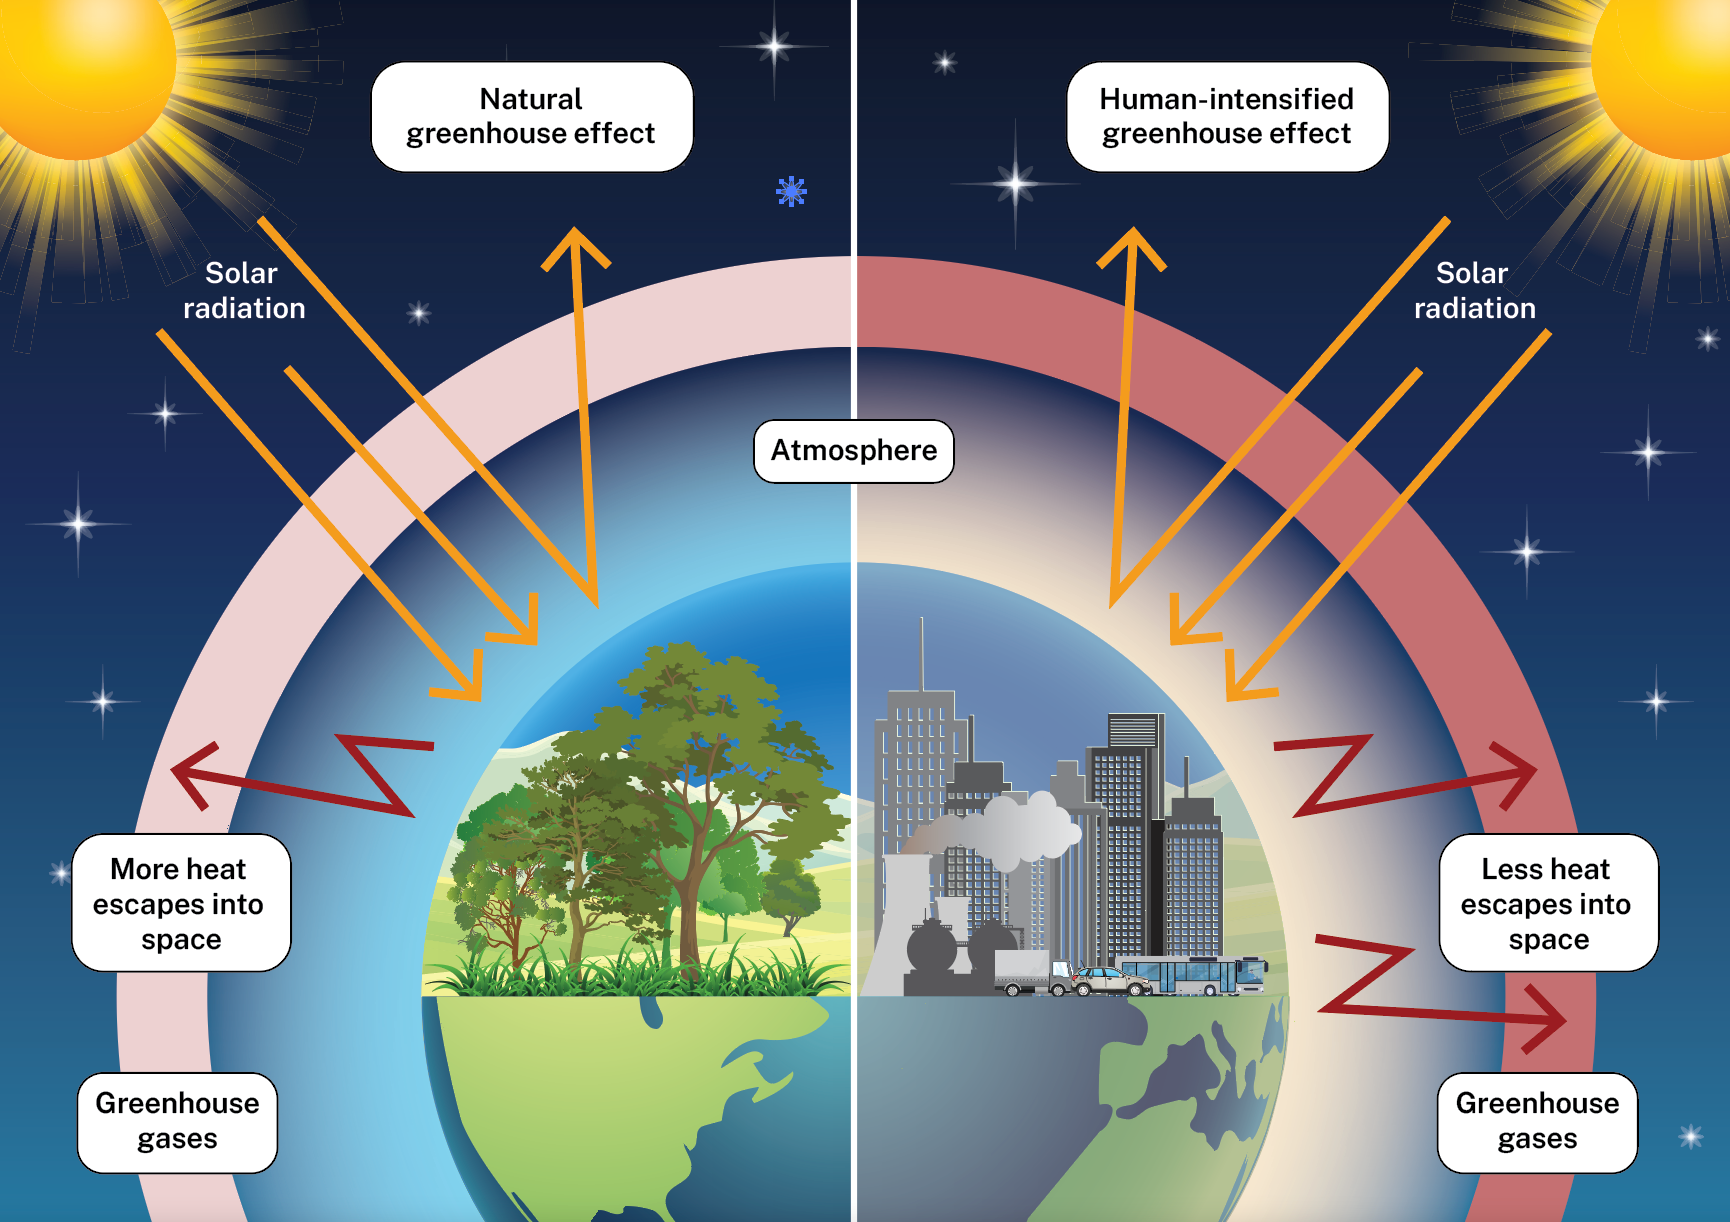
The greenhouse effect
The ‘greenhouse effect’ refers to how heat from the sun is trapped in earth’s atmosphere and influences temperatures.
Earth naturally absorbs energy from the sun in the oceans, soils and vegetation. As the surface warms up, most of this energy is re-radiated back into the atmosphere as infrared radiation (heat).
Greenhouse gases in the atmosphere trap some of this heat, preventing it from escaping into space. This trapped heat warms earth’s surface and lower atmosphere, creating a stable climate that supports life.
Human activities have intensified this effect by increasing the levels of greenhouse gases in the atmosphere. This leads to global warming and its associated impacts (see Image A2.1).
Image A2.1: Human activities intensify the greenhouse effect
The last time earth experienced carbon dioxide levels in the atmosphere as high as today was about 3 million years ago (). At that time, temperatures were 2.5 to 4°C higher, and sea levels were 5 to 25 metres higher, than in 1850 ().
Global temperatures over land and oceans in 2014–23 were 1.06–1.30°C above pre-industrial levels in 1850–1900 ().
Australia’s average temperature is now 1.51 ± 0.23°C warmer than in 1910 (), when the earliest national data became available.
The increase in overall temperature has been accompanied by variations in Australia’s rainfall patterns as well as by heightened frequencies and intensities of extreme weather-related events (). These have implications for ecosystems, livelihoods and the economy.
The rate of global sea levels rise have significantly increased since 1901 (). They are now rising at three times the rate in the early to mid-1900s. This increase in the past 100 years have been:
- 1.3 millimetres per year between 1901 and 1971 (71 years)
- 1.9 millimetres per year between 1971 and 2006 (35 years)
- 3.7 millimetres per year between 2006 and 2018 (13 years) ().
See and for more information on the impacts of changing climate on NSW.
Carbon sources
Under the Paris Agreement – the international treaty on climate change – Australia reports greenhouse gas emissions and removals according to defined sectors and sub-sectors. These sectors and sub-sectors encompass related processes and activities defined by the classification system of the United Nations Framework Convention on Climate Change (UNFCCC).
This standardised reporting enables comparison of emissions between countries and over time.
A major source of greenhouse gas emissions is the burning of fossil fuels, including coal, oil and natural gas, for electricity generation, manufacturing and transport. There are also fugitive emissions generated during processing and distribution of fossil fuels.
The greenhouse gas emissions sectors are defined in Table A2.1.
Table A2.1: United Nations Framework Convention on Climate Change (UNFCCC) classification system for sources of greenhouse gas emissions
| Sector | Definition |
|---|---|
| Stationary energy (electricity generation) | Emissions from fuel combustion in public thermal power stations |
| Stationary energy (excluding electricity generation) | Emissions released from on-site fuel combustion (other than for electricity generation) in manufacturing and primary industries, as well as in the commercial and residential building sectors |
| Transport | Emissions from fuel combustion in road, domestic aviation, rail, domestic shipping, off-road recreational vehicle activity and gas pipeline transport. (Emissions from the supply of the electricity that powers rail and electric vehicles are accounted for above, in ‘Stationary energy (including electricity generation)’) |
| Fugitive emissions | By-products of coal mining and natural gas extraction, processing, storage, transmission and distribution. Emissions (mostly methane) can be intentional or unintentional releases (for example, leaks) from coal mines, gas fields and industrial equipment |
| Agriculture | Dominated by methane produced by livestock due to the fermentation of plant matter in their stomachs and the way manure is managed |
| Industrial processes (sometimes referred to as industrial processes and product use) | Emissions resulting from industrial processes, including steel and steel production; the use of gases in products, such as refrigerant gases in imported equipment; and the use of fossil fuels as feedstocks for manufacturing |
| Waste | Emissions from solid waste disposal and treatment, and from domestic, commercial and industrial wastewater treatment and discharge. Most of the emissions are methane from anaerobic (in the absence of oxygen) decomposition of organic matter |
| Land use, land use change and forestry (LULUCF) | Emissions and removals associated with land management practices that affect the carbon stored in vegetation and soils |
Carbon sinks
Natural processes that absorb greenhouses gases as part of the carbon cycle are known as carbon sinks.
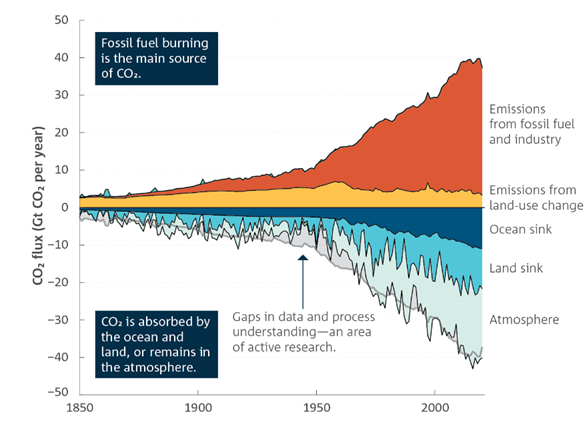
Although land (soils and plants) and oceans can absorb carbon dioxide from the atmosphere, serving as natural carbon sinks, human activities produce more carbon dioxide than nature can absorb.
More than half (about 56%) of global anthropogenic carbon dioxide emissions are absorbed by natural carbon sinks (). The rest builds up in the atmosphere (see Figure A2.1).
Figure A2.1: Global greenhouse gas emissions of CO2 from fossil fuels and land usage change, 1850–2021
Reducing emissions
There is an urgent need to radically reduce emissions in order to slow down global warming and mitigate the worst impacts of climate change ().
When comparing different greenhouses gas emissions, the amounts are expressed in terms of a common unit called carbon dioxide-equivalent (CO2-e). This accounts for the global warming potential of each gas compared with carbon dioxide. In this report, ‘carbon emissions’ or simply ‘emissions’ is used as shorthand to refer to ‘carbon dioxide equivalent emissions’.
Australia, along with all parties to the Paris Agreement, aims to hold the increase in global average temperatures to well below 2°C above pre-industrial levels and to try hard to limit the temperature increase to 1.5°C.
Under the Paris Agreement and the Australian Climate Change Act 2022, Australia has committed to reduce its emissions to 43% below 2005 levels by 2030 and to reach net zero by 2050 ().
See the topic for more information about what the NSW Government is doing to achieve these targets.
This is a challenging task, because while Australia makes a relatively small contribution to global emissions, it has one the highest per capita emissions in the world (see Map A2.1). This rate, almost three times the global average, is due to a heavy reliance on non-renewable energy sources and transport powered by fossil fuels ().
As the most populated state, NSW contributes about one quarter of Australia’s total greenhouse gas emissions.
Map A2.1: Global per capita greenhouse gas emissions, 2022
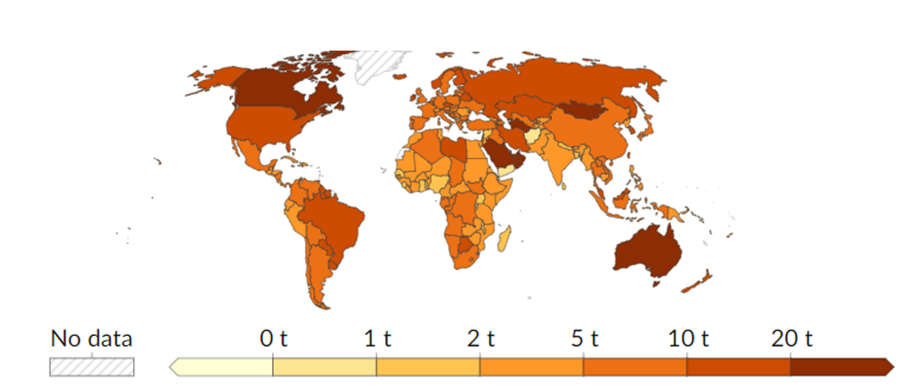
Notes:
Australia was the tenth largest emitter per capita in 2022.
The emissions shown in this map are based on global warming potentials from the IPCC Sixth Assessment Report.
Status of NSW emissions
Greenhouse gas emissions in NSW continue to slowly decline.
NSW net emissions in 2021–22 were 111 Mt CO2-e, 27% lower than in 2004–05 (153 Mt CO2-e) (). Although it has been ‘decarbonising’ or reducing emissions from fossil fuel combustion, the stationary energy (electricity generation) sector remained the biggest contributor to NSW emissions.
Consistent with national goals, NSW has set emission reduction targets through the Climate Change (Net Zero Future) Act 2023. This and other key legislation and policies that influence NSW emissions are detailed in Table A2.2.
See the topic to see the progress of emission reduction initiatives in NSW.
Table A2.2: Current key legislation and policies related to greenhouse gas emissions in NSW
| Legislation or policy | Purpose |
|---|---|
| Climate Change (Net Zero Future) Act 2023 | The main features of the Act are:
|
| Protection of the Environment Operations Act 1997 | Sets the statutory framework for managing air quality in NSW. It contains provisions for the operation of industrial plant to prevent air pollution that exceeds regulatory standards; the prohibition of burning to reduce smoke pollution during certain weather conditions; and the management of smoke from domestic premises. |
| EPA’s Climate Change Policy and Climate Change Action Plan 2023–26 | Outline a comprehensive regulatory approach and set of actions to address the causes and consequences of climate change in NSW. They include actions to support licenced industries to decarbonise and build resilience to climate change. |
| Net Zero Plan Stage 1: 2020–2030 | Sets the foundation for NSW action on climate change. It outlines policies and actions for NSW to achieve net zero emissions by 2030. |
| NSW Climate Change Policy Framework | Maximises the economic, social and environmental wellbeing of NSW in the context of a changing climate and of current and emerging international and national policy settings and actions to address climate change. It also defines the NSW Government’s role in reducing carbon emissions and adapting to the impacts of climate change. |
| NSW Climate Change Fund | Supports activities that reduce the impacts of climate change, including reductions in energy consumption and carbon emissions. It was established in 2007 under the Energy and Utilities Administration Act 1987. |
Notes:
See the Responses section for more information about how is being addressed in NSW.
Other federal legislative frameworks also affect emission reduction in NSW:
- The Safeguard Mechanism requires Australia’s highest emitters, including the mining, manufacturing, oil and gas production, transport, waste industries, to reduce the emissions they directly emit to the atmosphere. This is enacted through the National Greenhouse and Energy Reporting Act 2007 and other legislation, and is administered by the Clean Energy Regulator.
- The Fuel Quality Standards Act 2000 regulates the quality of fuel supplied in Australia to reduce the level of pollutants and emissions, facilitate adoption of better technology and allow the more effective operation of engines.
Related topics: | | | | |
Status and trends
Greenhouse gas indicators
Greenhouse gas indicators include (see Table A2.3):
- Global atmospheric concentrations of greenhouse gases are increasing (getting worse). Levels of carbon dioxide, methane and nitrous oxide have all increased significantly since 1850. In Australia, as globally, these emissions come mostly from the burning of fossil fuels (see Global atmospheric concentrations of greenhouse gases).
- Annual net NSW greenhouse gas emissions are decreasing (getting better), owing to decarbonisation of the stationary energy (electricity generation) sector. Decarbonisation means reducing greenhouse gas emissions produced by the combustion of fossil fuels. Despite this decrease, projections show that NSW is not guaranteed to meet its emissions reductions target by 2030 (see NSW greenhouse gas emissions).
See the topic for more information on NSW’s progress to its emissions reduction targets. - Annual NSW per capita greenhouse gas emissions are decreasing (getting better), mostly owing to the decoupling of emissions from population and economic drivers. Decoupling means that an increase in population (or gross state product) does not automatically equal an increase in emissions per capita (or gross state product). Despite this decrease, our per capita emissions are still far higher than the global average (see NSW emissions per capita and gross state product).
These indicators aligns to the 'climate change' planetary boundary. Globally, this boundary has been crossed (see ).
Table A2.3: Greenhouse gas emissions indicators
| Indicator | Environmental status | Environmental trend | Information reliability |
|---|---|---|---|
| Global atmospheric concentrations of greenhouse gases | Getting worse | Good | |
| Annual net NSW greenhouse gas emissions | Getting better | Good | |
| Annual NSW per capita greenhouse gas emissions | Getting better | Good |
Notes:
Indicator table scales:
- Environmental status: Good, moderate, poor, unknown
- Environmental trend: Getting better, stable, getting worse
- Information reliability: Good, reasonable, limited.
See to learn how terms and symbols are defined.
See the page for more information about how indicators align.
Global atmospheric concentrations of greenhouse gases
Global atmospheric concentrations of carbon dioxide, methane and nitrous oxide continue to rise to record levels ().
In 2023, the globally averaged surface concentrations of major greenhouse gases reached new highs. According to the World Meteorological Organization:
- Carbon dioxide concentration reached 420 ± 0.1 parts per million (ppm), an increase of 151% relative to its pre-industrial (before 1750) concentration of 278.3ppm
- Methane concentration reached 1934 ± 2 parts per billion (ppb), an increase of 265% from its pre-industrial concentration of 729.2ppb
- Nitrous oxide was 336.9 ± 0.1ppb, an increase of 125% from its pre-industrial concentration of 270.1ppb.
The build-up of these greenhouse gases in the atmosphere is unequivocally due to emissions from human activities ().
Find out more about ppm and ppb as units of measurement.
Global greenhouse gas emissions
Global emissions continue to rise, increasing by about 45% between 1990 and 2020, from 32.7 gigatonnes (Gt) of CO2-e to 47.5Gt CO2-e (see Figure A2.2).
During this period, fossil fuel combustion for electricity generation and transport contributed the most (74%).
Emissions dropped in 2020 owing to effects from the COVID-19 pandemic. Emissions are now almost back to pre-COVID levels ().
Figure A2.2: Global greenhouse gas emissions (Gt CO2-e), 1990–2021
Notes:
All greenhouse gas emissions (including carbon dioxide, methane, nitrous oxide and others) are expressed as CO2-e calculated from global warming potential values from the IPCC Sixth Assessment Report. Global emissions in this figure are reported in calendar years.
LULUCF = Land use, land use change and forestry.
Australian greenhouse gas emissions
It is estimated that net Australian greenhouse gas emissions were 461.7 megatonnes (Mt) CO2-e in 2021–22 ().
Emissions continued to decline overall (see Figure A2.3).
- The land use, land use change and forestry sector has acted as a carbon sink since 2015, whereas it was previously a net emitter.
- Emissions from the stationary energy (excluding electricity generation), transport, agriculture and industrial processes sectors have increased. Therefore, more effort is needed for Australia to reach its net zero targets.
Figure A2.3: Australian net greenhouse gas emissions (Mt CO2-e), 1990–2022
Notes:
Years shown are financial years and so cover the 12 months ending 30 June of that year. Emissions are based on the UNFCCC classification system used for reporting Australia's greenhouse gas emission inventory. Emissions are expressed as CO2-e calculated from global warming potential values from the IPCC Fifth Assessment Report.
LULUCF = Land use, land use change and forestry.
Australia’s emissions are projected to reduce to 358 Mt CO2-e by 2030 (). This represents a 42% decline relative to 2005 levels. This decline is due primarily to the decarbonisation of the electricity sector.
See the topic for emissions projections and the topic for more information about renewable energy.
NSW greenhouse gas emissions
Net NSW greenhouse gas emissions were 111 Mt CO2-e in 2021–22, 27% lower than 2005 levels of 153 Mt CO2-e ().
These emissions peaked in 1989–90 and have since generally trended downward, largely owing to decarbonisation of electricity generation and increased capacity of land use, land use change and forestry as a carbon sink (see Figure A2.4).
See the topic for more information about decarbonisation of the electricity sector.
The findings for different sectors are:
- Stationary energy (electricity generation) emissions remained the biggest contributor (39%) to NSW emissions in 2021–22, followed by transport (21%) then agriculture (18%).
- Stationary energy (electricity generation) emissions decreased by 26% in 2021–22 relative to 2005 levels due to uptake of renewable energy.
- Transport emissions dipped due to COVID-related restrictions in 2020. By 2021–22, they had decreased by 2% relative to 2005 levels.
- Agriculture fell by 7% in 2021–22 relative to 2005 levels. Reducing methane emissions from livestock is technically challenging.
- Waste emissions decreased by 22% in 2021–22 relative to 2005 owing to improved capture of landfill gas (methane) and less waste ending up in landfills.
- The land use, land use change and forestry sector has acted as a carbon sink since 1993, contributing significantly to the reduction in net emissions in NSW.
Figure A2.4: Net NSW greenhouse gas emissions (Mt CO2-e), 1990–2022
Notes:
Years shown are financial years and so cover the 12 months ending 30 June of that year. Emissions are based on the UNFCCC classification system used for reporting Australia's greenhouse gas emission inventory. Emissions are expressed as CO2-e calculated from global warming potential values from the IPCC Fifth Assessment Report.
LULUCF = Land use, land use change and forestry.
NSW emissions continue to slowly decline relative to 2005 levels. Increases in population and economic growth mean there is still more to be done to reach our emissions reduction targets, including our net zero target by 2050.
Emissions are projected to reduce by 44–50% below baseline 2005 levels by 2030 and by 65–70% by 2035 according to NSW DCCEEW’s emissions projections update in 2023 ().
See the topic for emissions projections.
NSW emissions per capita and gross state product
NSW is decoupling emissions from both population and gross state product: even as our population and gross state product grow, advances in technology and structural shifts across the economy continue to reduce net emissions (Figure A2.4) and net emissions per capita (Figure A2.5).
Decoupling means that an increase in population (or gross state product) does not automatically equal an increase in emissions per capita (or gross state product).
Despite the downward trend, NSW emissions per capita are still far higher than the global average, meaning there is more to be done to continue to decouple these emissions.
Figure A2.5: Change in NSW energy emissions relative to population and gross state product, 1990–2022
The State’s population is now almost 8.4 million (). A post-COVID-era migration spike saw NSW’s annual population growth rate reach 2.3%, the highest since 1950 ().
The larger population comes with greater energy use, transport, waste generation and goods production and their associated emissions. Yet since 1990, greenhouse gas emissions per capita have fallen by 47% from 29.12 to 13.66 CO2-e per capita in 2021–22.
See the topic for more information.
The NSW economy, as measured by gross state product, increased by 1.8% in 2021–22 from the previous year, reflecting greater economic activity after bushfires, drought and initial impacts of COVID ().
Since 1990, greenhouse gas emissions per dollar of gross state product in the NSW economy have fallen by 68% from 0.5 to 0.16kg CO2-e per dollar in 2021–22.
See the topic for more information.
NSW emissions by greenhouse gas type
During 2005–2022, about two-thirds of NSW net emissions were carbon dioxide (see Figure A2.6). Most of these emissions came from burning of fossil fuels and industrial processes.
Methane accounted for about 28% of net emissions, mostly from agriculture (sheep and cattle digestive processes) and fugitive emissions from the extraction and transport of coal, oil and natural gas.
While methane is a powerful greenhouse gas, it’s lifetime in the atmosphere is relatively short. This suggests that reducing methane emissions could quickly slow down the rate of global warming. Australia is signatory to the Global Methane Pledge, which is about taking fast global action on reducing methane emissions.
Nitrous oxide accounted for about 3% of net emissions, mostly from pastures and crops using nitrogen fertilisers.
As carbon dioxide emissions decline because of less fossil fuel burning, attention must be turned to reducing hard-to-reduce methane and nitrous oxide emissions.
Figure A2.6: NSW greenhouse gas emissions by type of gas (Mt CO2-e), 2005–22
Notes:
Years shown are financial years and so cover the 12 months ending 30 June of that year.
‘Other’ gases include hydrofluorocarbons, perfluorocarbons, sulphur hexafluoride.
Pressures and impacts
Population and economic activity
As the NSW population grows and economic activity increases, effects on emissions will continue.
While the energy sector is decoupling from these drivers, it is still, to date, based primarily on fossil fuels. This means that reductions in emissions from the decarbonisation of energy sources may be tempered by the overall increase in demand.
Emissions from agriculture, transport and waste are expected to increase with population and economic activities. Economic pressures will influence decision-making in industries, such as mineral and coal mining (see the Decarbonising high emitting industries section below for more details).
See the , , and topics for more information.
Decarbonising high emitting industries
NSW’s high emitting industries in the mining and manufacturing sectors are a crucial part of the State and national economies.
Decarbonising these industries is challenging because implementing cleaner alternatives to existing processes are sometimes too costly or not yet possible with current technology.
Achieving decarbonisation in these industries will require ongoing investment on assets, infrastructure and low-carbon fuels.
Economic pressures contributing to the complexity of decarbonising heavy industry must also be considered.
For instance, the mining industry contributes to NSW economic activity, especially in regional areas. Certain mines are essential to producing emissions-reducing technologies such as electric vehicle batteries, as they are a source of critical minerals, such as copper, lithium and cobalt.
Fossil fuel-powered transport
Transport is on track to be the highest greenhouse gas emitter in NSW in 2030, accounting for 25% of the State’s total emissions by that time.
See the and topics for more information.
The transport sector’s decarbonisation relies on increasing the number of low- or zero-emissions vehicles. These include electric vehicles (EVs), which are powered entirely by electricity stored in batteries, plug-in hybrid EVs that can run on both traditional fuel and electricity, and hydrogen fuel-cell EVs. Vehicles powered solely by renewable energy do not emit greenhouse gases.
Although the number of EVs in NSW have doubled between 2022 and 2024, EVs are a small fraction of the total number of vehicles (). As of January 2024, EVs made up just 0.8% (52,572) of road vehicle registrations in NSW ().
Existing barriers, such as high upfront cost and limited charging infrastructure are preventing the uptake and widespread use of EVs. The introduction of the NSW Electric Vehicle Strategy and the Commonwealth Government's New Vehicle Efficiency Standard are aiming to overcome these barriers.
Other forms of transport, such as heavy road vehicles, shipping and aviation, currently have limited low emissions alternatives that are cost effective.
Lack of economical emission reduction technology means that aviation emissions are projected to more than double from 0.8Mt CO2-e in 2020–21 to 2Mt CO2-e in 2029–30. This adds to the challenge of decarbonising the transport sector.
See the topic for more information.
Agriculture and land clearing
The production of both livestock and crops is projected to increase in NSW as our population continues to grow.
Producers already have options to optimise pasture quality and herd productivity. Options to reduce methane production by livestock, the largest contributor to agricultural emissions, are limited.
Technologies are not yet commercially available, and landholders face significant barriers to cost or implementation.
The clearing of primary forest (defined as land which has been forest since 1972) has declined since 1990. Reducing it further remains an important focus for reducing greenhouse gas emissions as it affects the future potential for carbon sequestration (capturing and storing atmospheric carbon dioxide) by the land sector, an important carbon sink.
The clearing of secondary forest or regrowth remains high.
The potential role of carbon offsets through tree planting may be at risk, as some farming groups worry that such action could drive up land prices by competing for land used for agriculture.
See the topics for more information regarding land clearing.
Responses
Mechanisms have been put in place to ensure the delivery of renewable energy infrastructure and to better manage energy demand in NSW.
These mechanisms will advance decarbonisation in the energy sector and maximise reductions in emissions.
NSW may fall short of its emission targets owing to challenges in decarbonising key sectors, especially under pressures from population and economic growth.
Research and innovation have been funded to develop technology for hard-to-reduce emissions, in line with recently legislated emission targets and climate commitments.
Implementing legislation and policies
The Climate Change (Net Zero Future) Act 2023 legislated the State’s emission reduction targets (see Table A2.2 for reduction targets) and created the independent Net Zero Commission.
The Net Zero Commission will direct the State’s progress towards net zero emissions. Implementation across government is anticipated to drive action in key sectors, including electricity, manufacturing, transport and agriculture.
The NSW Net Zero Plan Stage 1: 2020–2030 was released in 2020 as the foundation of the State’s action on climate change and goal to reach net zero emissions. It is monitored and updated as global and national trends in policy and technology evolve.
See the topic for more information.
The NSW Environment Protection Authority (EPA) has a critical role in protecting the environment from the threat of climate change and supporting NSW to achieve its net zero emissions target by 2050.
The EPA’s Climate Change Policy and Climate Change Action Plan 2023–26 supports and builds on the NSW Government’s climate change policies and initiatives, helping industry to decarbonise and build greater preparedness and resilience to climate change risks.
Some of the key actions include supporting industries to prepare climate change mitigation and adaptation plans, and publishing industry-specific guidance on best practice in emissions reduction. The EPA is also establishing a greenhouse gas monitoring network, particularly for fugitive methane emissions.
Ensuring energy supply and managing demand
The NSW Electricity Infrastructure Roadmap is the State’s 20-year plan to transform our electricity system.
This transition to net zero includes:
- supporting the private sector to deliver at least 12 gigawatts of new renewable energy generation and 2 gigawatts of long-duration storage by 2030. A new target of an additional 12 gigawatt hours by 2034 was announced in October 2024 ()
- implementing five Renewable Energy Zones, for the generation, storage and transmission of renewable energy to homes, businesses and industry
The NSW Energy Security Safeguard helps ensure our energy system is more reliable, affordable and sustainable. The schemes within the safeguard create incentives to deliver cost-effective energy savings, reduce peak demand and increase the production of green hydrogen.
See the topic for more information.
Reducing transport emissions
The NSW Electric and Hybrid Vehicle Plan is helping to kickstart electric vehicle (EV) uptake.
This plan supports electrifying the State Government fleet, installing charging infrastructure and raising awareness through an online NSW EV guide.
The NSW Electric Vehicle Strategy commits to a 2035 target for most new cars sold to be battery or fuel cell EVs. Financial incentives were available for EV purchases from September 2021 to December 2023 (). There is ongoing work to fully electrify NSW Government passenger fleet by 2030 and develop fast charging stations across NSW, among other initiatives.
See the topic for more information on EVs and the topic for updates on the State's EV strategy.
Reducing industry emissions
Funding for high emitting industries
NSW’s Net Zero Industry and Innovation Program is the State’s approach to support the manufacturing and mining sectors to decarbonise. It has funding opportunities for three focus areas:
- building infrastructure and increasing the capability of NSW supply chains for low emissions industries
- transitioning plant, equipment and other assets to low emission alternatives
- clean technology innovations to progress from the laboratory to the real world.
Developing a green hydrogen industry
The NSW Hydrogen Strategy is a plan to develop a green hydrogen industry in NSW. Green hydrogen is a clean fuel derived from splitting water in a process called electrolysis. It can drive decarbonisation in not just in the industrial sector, but also in the transport and energy sectors.
Green hydrogen technology is developing rapidly. Over $100 million has been allocated to develop hydrogen hubs in the Hunter, Illawarra and Moree regions. These hubs are where producers and users of green hydrogen are located together.
Generating carbon credits
The NSW Primary Industries Productivity and Abatement program supports farmers and land managers to reduce emissions, improve carbon management and enhance biodiversity on their land.
The program funds projects to register carbon reduction activities and generate and generate Australian Carbon Credit Units (ACCUs), which are bought and sold in the carbon offsets market. In 2023, the NSW Government awarded $6.8 million to six project partners in the NSW primary industries and land sector.
The creation of ACCUs could provide additional revenue for farmers and land managers.
Of note, ACCUs can be generated through other methods including energy efficiency, reducing landfill and waste emissions, and carbon capture and storage, among others.
See the Australian Government Clean Energy Regulator website for more information about ACCU scheme methods.
See the topic for more details and updates on the Net Zero Industry and Innovation Program, NSW Hydrogen Strategy and NSW Industries Productivity and Abatement Program.
Future opportunities
About 35% of emission reductions needed to reach global net zero emissions by 2050 come from technologies that are still in development ().
The NSW Decarbonisation Innovation Study 2023, developed by the Office of the NSW Chief Scientist and Engineer, provides valuable insight into the opportunities for NSW to reduce emissions and capitalise on its competitive advantages to transition and grow the economy.
Identifying the State’s competitive advantages can help direct resources to key areas. The study identifies these advantages across key factors of production:
- Policy landscape and certainty – enables businesses to make long-term plans, fostering growth and innovation.
- Economy structure and reduced exposure to global risks – a diversity of industry sectors in NSW, including finance, manufacturing, tourism and services, helps mitigate risks from global economic fluctuations.
- Natural resources and infrastructure assets – rich wind, solar, hydro and bioenergy resources help directly decarbonise the energy sector and offer indirect electrification across the economy.
- Innovation and research capability – NSW hosts world-class research infrastructure, which attracts leading expertise to contribute to research projects and to collaborate with business.
- A strong intellectual property framework – encourages researchers and entrepreneurs to bring ideas to market and stimulates further innovation.
- Education and workforce – internationally recognised universities provide employees with the skills needed to adapt to evolving industries.
- Industry and business capacity – NSW has a strong track record of exporting goods and services to international markets supported by established ports, transportation networks and trade infrastructure.
The study outlines 47 broad foundational and sector-specific opportunities to help NSW to continue evolving its approach to the net zero transition.
It highlights several opportunities and next steps that relate more directly to emission reduction:
- Circular economy – accelerating decarbonisation progress through local supply of recycled/reused/repurposed clean economy technologies, materials and goods.
- Clean sustainable fuels and energy carriers – maximising sector-coupling opportunities enabled by ‘Power-to-X’ technologies (which convert renewable energy and sustainable materials into power fuels and clean chemicals) for accelerated rollout of renewable energy projects to decarbonise hard-to-reduce industries.
- Energy efficiency and productivity – implementing energy-efficient technologies, optimising industrial processes and adopting energy-saving practices to reduce energy waste, reduce emissions and enhance competitiveness.
- Electric mobility and services – developing and deploying technologies and services to support a multi-modal approach to transport.
- Long-haul transport and non-road machinery – developing and deploying alternative fuel technologies with supporting infrastructure for hard-to-electrify transport.
- Embodied carbon for building and infrastructure – developing and deploying low-emission construction materials and technologies, and using government procurement to increase uptake of low-emission construction materials and modular designs.
- Biomanufacturing and synthetic biology – advancing bioengineering technologies, processes and services in simple organisms (such as algae and yeast) for low-carbon materials and products.
- Agri-tech and decarbonisation – developing and deploying agricultural technology and enabling technologies to support agriculture and land decarbonisation.
The study notes the continued importance of strong leadership and collaborative efforts between researchers, industries, communities and governments in driving further innovation, scaling up decarbonisation efforts and achieving ambitious climate targets.
The NSW Government routinely updates policies and strategies to incorporate the State’s emission reduction goals and targets. Stages 2 and 3 of the Net Zero Plan Stage 1: 2020–2030 will be developed ahead of 2030 and 2040, respectively.
The State Infrastructure Strategy, Future Transport Strategy 2056, Greater Sydney Region Plan and other regional plans will be updated to ensure that they continue to deliver on good environmental outcomes.