Summary
In 2016, greenhouse gas emissions for NSW were 131.6 million tonnes CO2-e. Emissions peaked in 2007 and are now 18.7% lower than 2005 levels. Emissions have declined across most economic sectors, with the exception of transport, which has undergone almost uninterrupted growth in emissions.
In 2016, NSW emissions were about 17 tonnes CO2-e per capita. This is below the national average of 21.8 tonnes per capita. Both are much higher than the global average of 6.6 tonnes per capita recorded last in 2014.
Stationary energy (primarily from electricity generation) is the largest source of emissions (51%) and these follow the overall pattern. Together, the stationary energy and transport sectors represent 72% of total NSW emissions, and forecasts indicate the emissions from both will grow in the future.
The NSW Government has an aspirational objective of achieving net-zero emissions by 2050. This was established as a long-term objective in 2016 within the Climate Change Policy Framework for NSW.
Related topics: Energy Consumption | Climate Change
NSW indicators
| Indicator and status | Environmental trend |
Information reliability |
|
|---|---|---|---|
| Atmospheric concentrations of greenhouse gases |
|
Getting worse | ✔✔✔ |
| Annual NSW greenhouse gas emissions |
|
Getting better | ✔✔✔ |
| Annual NSW per capita greenhouse gas emissions |
|
Getting better | ✔✔✔ |
Notes:
Terms and symbols used above are defined in How to use this report.
Context
Greenhouse gases occurring naturally in the atmosphere, along with physical processes (such as solar heat absorption by land, vegetation, oceans and atmospheric dust), act to maintain an average global surface temperature of about 14°C, which would otherwise be about –20°C (IPCC 2007, p.946). However, the dominant cause of recent global warming has been human-induced greenhouse gas emissions and not natural climate variability (BOM & CSIRO 2016).
The impacts of increased greenhouse gas concentrations and Climate Change is more fully explored in the Climate Change topic.
Since the beginning of the industrial era (about the mid-18th century), the increased use of fossil fuels, along with agricultural and land-use changes, have led to a build-up of greenhouse gases in the atmosphere. These gases include carbon dioxide (CO2), methane and nitrous oxide (IPCC 2014). This build-up is causing extra heat to be trapped by the atmosphere, resulting in an increase in global surface temperatures (IPCC 2007, p.4).
Concentrations of the major greenhouse gases now substantially exceed the highest concentrations of the past 800,000 years, as recorded in ice cores. The mean rates of increase in atmospheric concentrations over the past century are unprecedented in the last 22,000 years (IPCC 2013).
In terms of both volume and effect, CO2 is the largest single contributor to human-induced emissions, being responsible for approximately 76% of the change in the climate observed since pre-industrial times (IPCC 2017). The last time CO2 concentrations were comparable to these modern levels was 10 to 15 million years ago, when the world climate was, on average, 3 to 6°C warmer than at present and sea levels were much higher (Tripati et al. 2009; Allison et al. 2011).
Since the start of the industrial period, the global mean temperature has risen by 1.1°C. The warmest 10 years on record have occurred since 1998. Each year since 1985 the global mean temperature has been higher than the 1961–90 average (BOM & CSIRO 2016).
Temperatures in the Australasian region have risen to their highest levels in more than a thousand years (Figure 5.1). Since 1910, Australia’s climate has warmed by 1°C, heat events and extreme fire weather have increased, and rainfall patterns have changed (BOM & CSIRO 2016).
Status and Trends
Global greenhouse gas emissions
In 2016, annual global human-induced greenhouse gas emissions reached 49.3 ± 0.5 Gt CO2-e (gigatonnes of CO2 equivalent) excluding emissions from Land Use, Land Use Change and Forestry (Oliver et al. 2017). About 73% of global emissions in 2016 arose from fossil fuel (i.e. coal, oil and gas) combustion and industrial processes (EDGAR Emissions Database for Global Atmospheric Research; Oliver et al. 2017).
Global emissions (excluding Land Use, Land Use Change and Forestry) have slowed in growth over the 2013 to 2016 period with calculated increases of 1.0%, 0.2% and 0.5% from the combustion of fossil fuels and industrial processes (Oliver et al. 2017). These rates are lower than the long-term average of 1.6% over the period 1990–2016. However, emissions are projected to increase by 2% in 2017 (Le Quéré et al. 2018). Economic and population growth are key drivers of global CO2 emissions, but in recent years their effects are being moderated by a decoupling of the global economy from energy consumption (Oliver et al. 2017, p.14).
Australian greenhouse gas emissions
Using the estimation and reporting rules of the Intergovernmental Panel on Climate Change (IPCC) and the United Nations Framework Convention on Climate Change (UNFCCC), 525 Mt CO2-e of greenhouse gases were emitted in Australia during 2016 (DEE 2018a volume 1, p.xi). While its contribution to global emissions is small, Australia is one of the highest per capita emitters of greenhouse gases in the world (IEA 2017, p.130). Australia’s per capita emissions from fuel combustion (15.83 tonnes CO2-e per person in 2015) were significantly higher than the Organisation for Economic Cooperation and Development (OECD) average of 9.18 tonnes CO2-e per person (IEA 2017, p.130).
Australia has committed to the Paris Climate Agreement, and has set its Intended Nationally Determined Contributions (INDC) target to reduce emissions by 26–28 per cent below 2005 levels by 2030. More detail on the Paris Agreement and its aims is provided in the context section of the Climate Change topic.
NSW greenhouse gas emissions
In 2016, NSW’s greenhouse gas emissions were 131.6 Mt CO2-e, which was 18.7% lower than in 2005. Using the estimation and reporting rules of the IPPC and the UNFCCC, NSW’s emissions predominantly arise from the energy sector, which incorporates stationary energy and transport emissions, followed by agriculture, industrial processes and waste. Emissions in NSW peaked in 2007 and have since fallen (Figure 5.1).
NSW’s net emissions follow the general trend for the combined energy, agriculture and industrial processes sources. However, since 2008 they have been moderated by the effect of the Land Use, Land Use Change and Forestry category, becoming a net sink of emissions rather than a source (Figure 5.1).
Current and projected climate change impacts for NSW from increasing greenhouse gas emissions are described in the Climate Change topic.
Figure 5.1: Total NSW greenhouse gas emissions, 2005–16
NSW emissions components
The combustion of fossil fuels account for 80% of NSW emissions, which includes fugitive emission of 11% from coal mining (Figure 5.2). In NSW, stationary energy emissions (primarily fuel combustion for electricity and other gas use) increased by 4% since 1990, due to population and economic growth. This increase is tempered by:
- energy efficiency improvements
- the deployment of gas-fired power stations
- increased energy generation from renewable sources
- a shift in the structure of the NSW economy towards sectors that are less intensive for energy use and greenhouse gas emissions (see the Economic Activity and the Environment topic).
Figure 5.2: NSW greenhouse emissions components, 1990–2016
Notes:
* Includes fuel combustion for manufacturing industries and construction etc
** 94% of NSW fugitive emissions come from coal mining
Electricity generation and use in NSW is expected to resume growing, albeit slowly (see
topic).
The transport sector is the fastest growing component of NSW-generated greenhouse gases. Although transport energy consumption was relatively stable from 2011 to 2016 (see
topic), the sector is a significant source of greenhouse gas emissions for NSW because of its growth rate and the size of its contribution to total emissions, which was 20.8% in 2016.
The Land Use, Land Use Change and Forestry sector has gone from being a net generator of emissions to a net sink for emissions. This principally reflects the impact of declines in emissions from land clearing and enhanced sinks from the development of new forests, the regeneration of bush and forests after clearing, and existing forest management (DEE 2018b).
NSW greenhouse gas emissions by economic sector
Total greenhouse gas emissions arising from the direct consumption of energy and fuel as well as industrial processes, along with indirect sources of emissions arising from the generation of electricity, can all be attributed to their end-use sectors (Figure 5.3).
In 2016, the largest contributor of greenhouse gas emissions in NSW was the residential sector, which included emissions from private transportation (33.5 Mt CO2-e, about 26% of NSW's total emissions). This was followed closely by manufacturing (30.1 Mt, about 23%) and mining and construction (26.7 Mt CO2-e, about 21%).
Figure 5.3: NSW greenhouse gas emissions by end-use sector and emissions type, 2016
Notes:
Values are rounded. Totals may not match due to rounding.
Pressures
Temperature warming
Changing greenhouse gas concentrations will alter the heat balance of the atmosphere, resulting in global warming. For most of the past 2,000 years, global atmospheric concentrations of greenhouse gases have been fairly stable and only since the Industrial Revolution (c. 1750) have they increased significantly. This trend is also seen in the Australasian region (Figure 5.4).
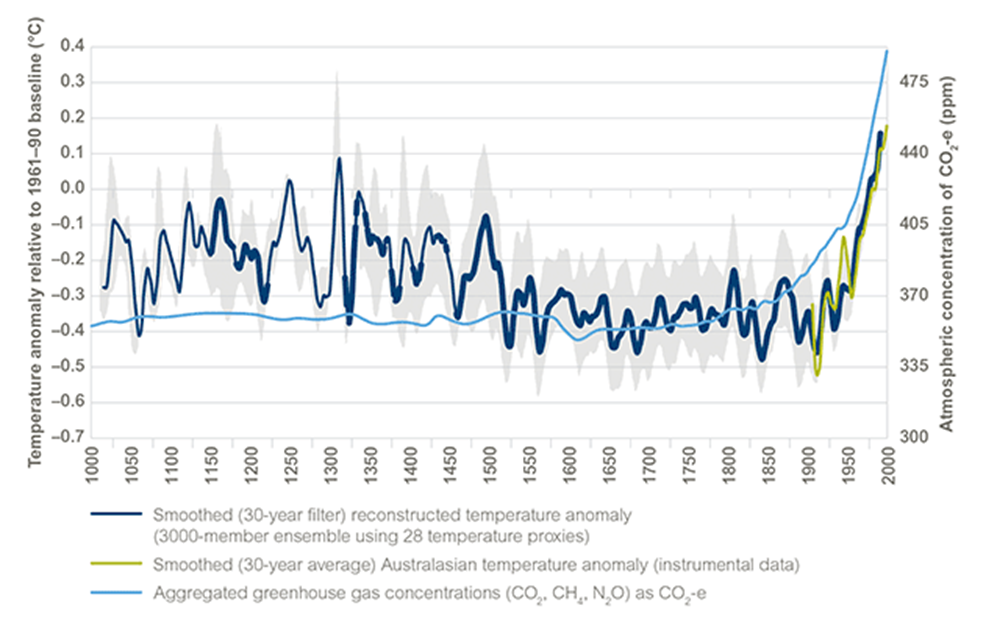
Figure 5.4: Australasian summer temperature reconstruction, temperature observations and CO2-e, since AD 1000
Notes:
This temperature reconstruction is based on 28 temperature proxies from the Australasian region and was generated using multivariate principal component regression. The most reliable periods of the reconstruction are shown by the thick sections of the dark blue line with less reliability indicated by the thin dark blue line. The light green line represents the instrumental data. Statistical error bands from the regression analysis are shown in light grey.
The light blue CO2-e line is composed of the sum of the atmospheric concentrations of three main greenhouse gases (CO2, CH4 and N2O; as measured in ice cores from Law Dome, Antarctica) multiplied by their individual radiative efficiencies relative to CO2.
Climate change
The accumulation of greenhouse gas emissions in the Earth’s atmosphere is the main environmental pressure leading to global warming and changes in climate. The impacts on climate that are already occurring and projections of future changes are described in the 'Changes in climate' section of the Climate Change topic. These impacts include increasing air and ocean temperatures, greater variability and changes in the seasonality of rainfall and rising sea levels.
In turn, the induced changes in climate described in Change in climate section will act as environmental pressures that have broad impacts on a wide range of biophysical systems. These are described in the 'Environmental impacts of climate change' section of the Climate Change topic. They include increasing extreme weather events, such as storms and floods; increased coastal erosion and inundation; less favourable climate conditions for many species, ecosystems and agricultural systems; and impacts on human health and wellbeing.
Global emissions
The extent of the impacts of climate change will ultimately be determined by the actions the world’s nations take globally to reduce greenhouse gas emissions and the level at which greenhouse gases in the atmosphere can be stabilised. In 2016, a total of 196 (98%) of the world’s nations signed the Paris Climate Agreement to limit global average temperature rise to well below 2°C, while aiming for a safe 1.5°C target, with each party to the agreement pledging national contributions to reducing greenhouse gas emissions (UNFCCC 2015).
In 2017, a UNFCCC analysis of 189 countries, covering 99% of the emissions of parties to the convention, found that reductions are not yet sufficient to put the world on track to limit global temperature rise to 2°C (UNFCCC 2017). In effect, worldwide emission reductions of around 5% per year would be required. This corresponds to limiting cumulative emissions, post-1750, to the equivalent of 1 trillion tonnes of carbon (Allen et al. 2009). Business-as-usual activities will see the 1 trillion tonne level exceeded in about 17 years (University of Oxford 2009).
A UN Intergovernmental Panel on Climate Change (IPCC) report (IPCC 2018) found that global net human-caused emissions of carbon dioxide (CO2) would need to fall by about 45% from 2010 levels by 2030, reaching net zero around 2050. The report highlights that a number of climate change impacts could be avoided by limiting global warming to 1.5ºC compared to 2ºC, or more.
Environmental drivers
In the SoE framework, the economy and population are seen as drivers of environmental change rather than direct pressures. Figure 5.5 shows the relationship between economic growth, population, energy use and greenhouse gas emissions from 1990 until the present. The figure shows a steady decoupling of the economy from greenhouse gas emissions over this time. There is, however, a much stronger relationship between the levels of energy use and population growth over the same period.
The relationship between energy use, greenhouse gas emissions, population and the economy is more fully explored in the Economic Activity and the Environment topic. This demonstrates a 60% decoupling of greenhouse gas emissions from economic growth (gross state product, or GSP) since 1990.
Figure 5.5: Trends in NSW energy use, compared with key NSW statistics, 1990–2017
Future energy supply and demand
In recent years, electricity consumption has declined in NSW. This is due to a variety of economic factors, such as increased local generation by residential and commercial users and improvements to energy efficiency (see the
topic). In addition, there has been a decline in the emissions intensity of electricity generation from the National Electricity Market (NEM) (Saddler 2018).
Nevertheless, population and economic growth from 2018–19 to 2036–37 is projected to be sufficient to increase electricity demand. However, the demand from the grid is expected to remain steady as consumers increasingly opt for more onsite power generation and storage (see the
topic). Emissions from the electricity generation sector in NSW are expected to decline over the coming decades with the announced closure of 4.64GW of coal-fired power stations, representing 45% of the existing fleet of coal-fired power stations. The rate of this decline will be determined by replacement technology, which in turn will be influenced by government policy, changes in technology cost and consumer demand.
Demand for gas has been stable over the past three years and is forecast to remain at its current level over the next 10 years (AEMO 2017a and AEMO 2017b). The Australian Energy Market Operator (AEMO) predicts a number of uncertainties could impact residential and commercial demand, including weather and population variances, responses to changing energy prices and bills, and gas to electric appliance switching.
Responses
There are two main strategies for response to climate change – mitigation and adaptation.
Mitigation of climate change describes the actions taken to limit or reduce the extent of global warming by reducing the levels of human induced greenhouse gas emissions, and the actions taken to remove greenhouse gas emissions from the atmosphere. Adaptation is the actions taken to reduce, moderate or adjust to the expected or actual negative effects of climate change, and take advantage of new opportunities.
This section outlines the key mitigation responses to greenhouse gas emissions in NSW, with some further policies and programs outlined in the Energy Consumption topic. Adaptation responses to climate change are outlined in the Responses section of the Climate Change topic.
Legislation and policy
NSW Climate Change Policy Framework
The NSW Climate Change Policy Framework (OEH 2016) includes aspirational objectives to achieve net zero emissions by 2050 and make NSW more resilient to a changing climate. The framework states the NSW Government’s endorsement of the Paris Agreement and sets out policy directions for mitigation, such as boosting energy productivity and reducing household and business energy bills.
The government’s net zero objective is supported by other policies as described below.
NSW Climate Change Fund
The NSW Climate Change Fund (CCF) was established in 2007 under Part 6A of the Energy and Utilities Administration Act 1987 to provide funding to reduce greenhouse gas emissions and the impacts of climate change associated with water and energy activities. The CCF has typically funded programs for energy efficiency, renewable energy and climate change adaptation.
Using energy more efficiently
The NSW Energy Efficiency Action Plan (EEAP) (OEH 2013) ran over a four-year period to July 2017 and implemented measures that reduced the cost of consumers’ energy bills and improved economic performance. The EEAP contained 30 actions to grow the market for energy saving products and services and demonstrated NSW’s leadership in energy efficiency.
The Energy Affordability Package and Energy Efficiency Package supports low-income households in social and private housing to save energy. This support package includes:
- An appliance replacement offer which provides eligible households with the opportunity to replace their existing inefficient fridge or television with a new efficient appliance at a discounted cost
- Upgrading more than 20,000 rental homes to enable low-income renters to benefit from energy efficient lighting, heating, and hot water systems
- Partnering with social housing providers to install energy efficiency measures at social housing properties.
Government Resource Efficiency Policy
The NSW Government is leading by example through the Government Resource Efficiency Policy (GREP) (OEH 2014). This policy responds to rising resource costs and economic, environmental and community impacts by setting measures, targets and minimum standards that will drive resource efficiency in the areas of energy, water, waste and clean air for Government. This is through energy efficiency projects, encouraging renewable energy development (e.g. mid-scale solar development) and reducing waste generation.
The NSW Government also supports various state and national standards that are coordinated through the Council of Australian Governments (COAG), such as:
- Greenhouse and Energy Minimum Standards (GEMS), which regulates energy efficiency and standards for appliances and other products (see Energy Consumption topic)
- National Australian Built Environment Rating System (NABERS), which rates buildings using measured environmental impacts
- the National Construction Code, which sets out minimum standards for energy efficiency in building design and construction.
These standards are complemented by NSW's Building Sustainability Index (BASIX), a compulsory ratings system for new residential buildings and renovations. BASIX aims to improve water with compulsory targets for energy efficiency and improving waste management and indoor air quality. The NSW Government estimated that in 2015, BASIX homes had reduced emissions of greenhouse gases by over 4 million tonnes (DPE 2015).
Lower emissions energy
NSW supports the Australian Government’s 2014 Renewable Energy Target (RET) of 33,000GWh of renewable generation by 2020. The NSW Renewable Energy Action Plan (REAP) (NSW T&I 2013) positions NSW to offer increased renewable energy at the lowest cost to customers. The REAP contains 24 actions to attract renewable energy investment, build community support and grow renewable energy expertise.
Under the RET and the Renewable Energy Action Plan, the use of renewable energy sources for electricity has more than doubled in proportion between 2008 and 2017 from 6.1% to 15.8% (11,469GWh) of total energy consumption in NSW (see Energy Consumption topic).
In June 2018, more than 420,000 households and small businesses across NSW had solar photovoltaic (PV) systems, representing an installed capacity of 1.6GW (Clean Energy Regulator data).
The NSW Government also has policies beyond these plans that help reduce greenhouse gas emissions from energy. These include mandating biofuel supply in NSW to help support the development of a market for cleaner and alternative fuels. Biofuels, such as ethanol and modified vegetable oil (biodiesel), can reduce greenhouse gas emissions, create jobs in regional NSW, help farmers and reduce reliance on foreign fuel imports.
In addition, government actions to support public transport use can help reduce energy use and greenhouse gas emissions from the transport sector (see Transport topic).
Programs
Carbon sequestration
Careful land management can avoid greenhouse gas emissions by sequestering (storing) carbon in the plants and soil. It can also protect biodiversity and maintain landscape values.
As public lands in NSW (around half the state) store about 1.5 billion tonnes of carbon, the NSW Government is working to improve the management of carbon across all public lands (e.g. see NSW Legislative Council 2013) and in land covered by agreements for private land conservation.
The Australian Government’s Emissions Reduction Fund provides incentives for storing carbon in the agriculture and forestry sectors as well as for emissions avoidance across the economy. This program now integrates the former Carbon Farming Initiative that ran between September 2011 and December 2014. There are over 200 ERF projects in NSW, many of which sequester carbon in trees and vegetation.
Helping households be more energy efficient
The following programs support households to reduce greenhouse gas emissions by becoming more energy efficient and saving money on their energy bills.
Home Energy Action
Expanded in September 2017, the $50 million Home Energy Action (HEA) Program works in partnership with community housing providers, the community services sector and industry to deliver energy efficiency improvements to households experiencing energy stress and to improve household comfort, health and wellbeing.
The program operates three streams:
- Social Housing Upgrades – a co-investment model with social housing providers across the state to install energy efficient retrofit measures on public, community and Aboriginal housing. Retrofit measures include solar panels, ceiling insulation, draught proofing, LED lighting, heat pump hot water systems, split system air-conditioning and energy performance upgrades for new build projects. These upgrades reduce energy bills and increase comfort for tenants.
- Appliance Replacement Offer – replaces old fridges and televisions with new energy efficient models at discounted prices, to eligible households directly or through community service organisation partners.
- Energy Hardship Assist – a co-investment model to deliver subsidised solar panels, in partnership with energy retailers, to customers in social housing.
More efficient homes for low-income tenants
Announced in August 2018, this new program provides $24.5 million in discounts for upgrades to more than 20,000 homes rented by low-income tenants, so they can benefit from energy efficient lighting, heating and hot water systems. The program will also provide guidance to help landlords choose appropriate energy saving technologies for the type of house and climate zone.
Helping communities be more energy efficient
The following programs support businesses and households to reduce greenhouse gas emissions by becoming more energy efficient.
Household and small business upgrade program
This five-year program was launched in April 2018 to help households and small businesses save energy and money. It will provide up to $44m in incentives to help them upgrade to energy efficient equipment, such as lighting and air-conditioning.
Energy Savings Scheme
The Energy Savings Scheme (ESS), established in 2009, is the longest running energy efficiency certificate trading scheme in Australia. The scheme creates incentives for households and businesses to invest in energy efficient products and services by reducing the upfront cost of upgrades. The ESS helps to build a sustainable energy efficiency market by encouraging the private sector to develop products and services that are scalable and sustainable, helping households and businesses to reduce their energy use.
Helping businesses be more energy efficient
The following programs support businesses to reduce greenhouse gas emissions by becoming more energy efficient.
Energy savings for energy intensive manufacturers
On 20 August 2018, the NSW Government announced a new program to help businesses stay competitive by reducing their energy costs. The program will provide assistance for approximately 250 manufacturing businesses to install energy efficient equipment, such as upgraded boilers, refrigeration, and metering technology to help track their energy use.
Energy Management Services
The Energy Management Services Program provides blended learning (including online modules, webinars, tools and guidance), training, coaching and technical support that help businesses and business service providers to adopt proven energy management practices that reduce energy use and associated emissions. The program participates in industry engagement, partnership development and dissemination of information to showcase best practice in energy management.
Sustainability Advantage
The Sustainability Advantage Program works with organisations to solve complex sustainability challenges. The program collaborates with businesses on innovative projects and shows how they can be leaders in their communities. Members of the program achieve savings of more than $100 million every year, directly supporting the Government’s target of achieving net zero emissions by 2050.
NABERS
NABERS (the National Australian Built Environment Rating System) is a rating system that measures the energy, water and waste impact of buildings in Australia using a star scale. NABERS can be used to rate a variety of buildings, including office buildings, office tenancies, apartment buildings, shopping centres, hotels and data centres.
The highly regarded program has assessed 81% of office space in Australia with improvements of 8.5% in energy efficiency, 383,000 tonne reductions in annual greenhouse gas emissions, 11% in water efficiency and 1.6 billion litres of water saved.
Helping government agencies and local councils be more energy efficient
The following programs support government agencies and local councils to reduce greenhouse gas emissions by becoming more energy efficient.
More efficient street lighting
On 20 August 2018 the government announced $12.5 million of funding to help local councils upgrade 60,000 energy inefficient street lights to LEDs. This will lead to around $22 million in energy bill savings by 2035, which will enable councils to free up funding for local services and infrastructure.
Sustainable Government
The Sustainable Government Program works closely with NSW Government agencies to help them lead the way on sustainability action and reduce the impact of government activities. The program provides tailored services and support to help agencies develop sustainability plans and embed sustainability leadership. To date, the program has delivered 71 sustainability projects across 144 sites resulting in $70 million in savings to government.
Future opportunities
Energy generation is becoming less carbon intensive and this trend is expected to continue. Combined with energy efficiency measures, emissions from electricity generation should decrease in coming decades. Complementary research and development into cost-effective technologies to reduce generation emissions will continue. For example:
- carbon mineralisation – the Coal Innovation NSW Fund is partnering with the Australian Government and Orica in Mineral Carbonation International, a project trialling a new technology that permanently and safely stores CO2 by transforming captured emissions into forms of carbonate rock for potential use as new green building materials in the construction industry
- improving combustion efficiency, such as by chemical looping air separation technologies to produce oxygen for use in oxy-fuel combustion power stations; and the direct carbon fuel cell (both are being funded by the Coal Innovation NSW Fund)
- enabling systems and technologies for very high penetration renewable energy generation.
Reduction of emissions from power generation will bring a greater focus on reducing emissions from industrial processes and transport. Additional opportunities include capturing fugitive emissions, such as methane from landfill waste decomposition; and waste heat from industrial processes.
The NSW Government has recently set a high-level direction for addressing transport-related emissions with the Future Transport 2056 Strategy. The strategy includes commitments towards reducing energy intensity of NSW passenger transport and support for zero emissions vehicles (TfNSW 2018). Further gains can also be expected by continuing to improve light and heavy vehicle efficiency.
There are opportunities within the agriculture and forestry sectors to mitigate greenhouse gas emissions through practice changes that are both profitable and sustainable.
Key opportunities being investigated by NSW Department of Primary Industries (DPI) in conjunction with the Commonwealth Government include:
- increased soil organic carbon
- increased perennial vegetation in agriculture
- reduced methane emissions from livestock
- reduced emissions from nitrogenous fertilisers
- utilisation of agricultural and forestry residues for bioenergy and biochar.
References
References for Greenhouse Gas Emissions
ABARES 2016, Australian Energy Statistics: Energy update 2016, Australian Bureau of Agricultural and Resource Economics and Sciences, Canberra [www.industry.gov.au/Office-of-the-Chief-Economist/Publications/Pages/Australian-energy-statistics.aspx]
ABS 2014, Australian Historical Population Statistics, 2014, cat. no. 3105.0.65.001, Australian Bureau of Statistics, Canberra [www.abs.gov.au/AUSSTATS/[email protected]/allprimarymainfeatures/632CDC28637CF57ECA256F1F0080EBCC?opendocument]
ABS 2017, Australian National Accounts: State Accounts, 2016–17, cat. no. 5220.0, Australian Bureau of Statistics, Canberra [www.abs.gov.au/AUSSTATS/[email protected]/allprimarymainfeatures/E6765105B38FFFC6CA2568A9001393ED?opendocument]
ABS 2018, Regional Population Growth, Australia, 2016–17, cat. no. 3218.0, Australian Bureau of Statistics, Canberra [www.abs.gov.au/AUSSTATS/[email protected]/allprimarymainfeatures/B7616AB91C66CDCFCA25827800183B7B?opendocument]
AEMO 2016, National Gas Forecasting Report 2016, Australian Energy Market Operator, Melbourne [www.aemo.com.au/Gas/National-planning-and-forecasting/National-Gas-Forecasting-Report]
AEMO 2017a, Integrated System Plan Consultation December 17 For the National Electricity Market, Australian Energy Market Operator, Melbourne [www.aemo.com.au/Electricity/National-Electricity-Market-NEM/Planning-and-forecasting/Integrated-System-Plan]
AEMO 2017b, Gas Statement of Opportunities, Australian Energy Market Operator, Melbourne [www.aemo.com.au/Gas/National-planning-and-forecasting/Gas-Statement-of-Opportunities]
Allen MR, Frame DJ, Huntingford C, Jones CD, Lowe JA & co-authors 2009, ‘Warming caused by cumulative carbon emissions: Towards the trillionth tonne’, Nature, 458, pp. 1,163–6 [www.nature.com/articles/nature08019]
Allison I, Bindoff NL, Bindschadler R, Cox PM, de Noblet N, England MH, Francis JE, Gruber N, Haywood AM, Karoly DJ, Kaser G, Le Quéré C, Lenton TM, Mann ME, McNeil BI, Pitman AJ, Rahmstorf S, Rignot E, Schellnhuber HJ, Schneider SH, Sherwood SC, Somerville RCJ, Steffen K, Steig E, Visbeck M & Weaver A 2011, The Copenhagen Diagnosis: Updating the world on the latest climate science, 2nd edn, Elsevier Science & Technology, Oxford [www.elsevier.com/books/the-copenhagen-diagnosis/leading-scientists/978-0-12-386999-9]
Boden TA, Marland G & Andres RJ 2017, Global, Regional, and National Fossil-Fuel CO2 Emissions, Carbon Dioxide Information Analysis Center, Oak Ridge National Laboratory, US Department of Energy, Oak Ridge, Tenn., USA. DOI: 10.3334/CDIAC/00001_V2017 [http://cdiac.ess-dive.lbl.gov/trends/emis/meth_reg.html]
BOM & CSIRO 2016, State of the Climate Report 2016, Bureau of Meteorology and CSIRO, Canberra [www.bom.gov.au/state-of-the-climate]
BP 2017, Statistical Review of World Energy, BP p.l.c., London [www.bp.com/en/global/corporate/energy-economics.html]
Davis SJ, Caldeira K & Matthews HD 2010, ‘Future CO2 emissions and climate change from existing energy infrastructure’, Science, 329(5997), pp. 1,330–3 [dx.doi.org/10.1126/science.1188566]
DEE 2017, Australia’s Emissions Projections 2017, Department of the Environment and Energy, Canberra [www.environment.gov.au/climate-change/publications/emissions-projections-2017]
DEE 2018a, National Inventory Report 2016: Volume 1, Department of the Environment and Energy, Canberra [www.environment.gov.au/climate-change/climate-science-data/greenhouse-gas-measurement/publications/national-inventory-report-2016]
DEE 2018b, State and Territory Greenhouse Gas Inventories 2016, Department of the Environment and Energy, Canberra [www.environment.gov.au/climate-change/climate-science-data/greenhouse-gas-measurement/publications/state-and-territory-greenhouse-gas-inventories-2016]
Gergis J, Neukom R, Gallant A & Karoly D 2016, ‘Australasian Temperature Reconstructions Spanning the Last Millennium, Journal of Climate, vol. 29, pp. 5,365–92 [https://journals.ametsoc.org/doi/pdf/10.1175/JCLI-D-13-00781.1 (PDF 2.4MB)]
Hartmann DL, Klein Tank AMG, Rusticucci M, Alexander LV, Brönnimann S, Charabi Y, Dentener FJ, Dlugokencky EJ, Easterling DR, Kaplan A, Soden BJ, Thorne PW, Wild M & Zhai PM 2013, ‘Observations: atmosphere and surface’, in: Climate Change 2013: The physical science basis – contribution of Working Group I to the Fifth Assessment Report of the Intergovernmental Panel on Climate Change, Stocker TF, Qin D, Plattner G, Tignor MMB, Allen SK, Boschung J, Nauels A, Xia Y, Bex V & Midgley P (eds), Cambridge University Press, Cambridge [https://www.ipcc.ch/report/ar5/wg1/]
IEA 2011, CO2 Emissions from Fuel Combustion: Highlights – 2011 Edition, International Energy Agency, Paris [www.iea.org/media/statistics/co2highlights.pdf (PDF 1.7MB)]
IEA 2017, CO2 Emissions from Fuel Combustion: Highlights – 2017 Edition, International Energy Agency, Paris [www.iea.org/publications/freepublications/publication/CO2EmissionsfromFuelCombustionHighlights2017.pdf (PDF 4.6MB)]
IPCC 2007, Climate Change 2007: The physical science basis – contribution of Working Group I to the Fourth Assessment Report of the Intergovernmental Panel on Climate Change, Solomon S, Qin D, Manning M, Chen Z, Marquis M, Averyt K, Tignor M & Miller H (eds), Cambridge University Press, Cambridge [www.ipcc.ch/publications_and_data/publications_ipcc_fourth_assessment_report_wg1_report_the_physical_science_basis.htm]
IPCC 2013, Climate Change 2013: The physical science basis – contribution of Working Group I to the Fifth Assessment Report of the Intergovernmental Panel on Climate Change, Stocker TF, Qin D, Plattner G, Tignor MMB, Allen SK, Boschung J, Nauels A, Xia Y, Bex V & Midgley P (eds), Cambridge University Press, Cambridge [www.ipcc.ch/report/ar5/wg1]
IPCC 2014a, Climate Change 2014: Synthesis Report – contribution of Working Groups I, II and III to the Fifth Assessment Report of the Intergovernmental Panel on Climate Change, Core Writing Team, Pachauri, RK & Meyer, L (eds), The Intergovernmental Panel on Climate Change, Geneva, Switzerland [https://archive.ipcc.ch/pdf/assessment-report/ar5/syr/SYR_AR5_FINAL_full_wcover.pdf (PDF 11.2MB)]
IPCC 2014b, Climate Change 2014: Synthesis Report, Summary for Policymakers, Core Writing Team, RK Pachauri and LA Meyer (eds), The Intergovernmental Panel on Climate Change, Geneva, Switzerland [https://archive.ipcc.ch/pdf/assessment-report/ar5/syr/AR5_SYR_FINAL_SPM.pdf (PDF 3.2MB)]
Le Quéré C, Andrew RM, Friedlingstein P, Sitch S, Pongratz J, Manning AC, Korsbakken JI, Peters GP, Canadell JG, Jackson RB, Boden TA, Tans PP, Andrews OD, Arora VK, Bakker DCE, Barbero L, Becker M, Betts RA, Bopp L, Chevallier F, Chini LP, Ciais P, Cosca CE, Cross J, Currie K, Gasser T, Harris I, Hauck J, Haverd V, Houghton RA, Hunt CW, Hurtt G, Ilyina T, Jain AK, Kato E, Kautz M, Keeling RF, Klein Goldewijk K, Körtzinger A, Landschützer P, Lefèvre N, Lenton A, Lienert S, Lima I, Lombardozzi D, Metzl N, Millero F, Monteiro PMS, Munro DR, Nabel JEMS, Nakaoka S-I, Nojiri Y, Padin, XA, Peregon A, Pfeil B, Pierrot D, Poulter B, Rehder G, Reimer J, Rödenbeck C, Schwinger J, Séférian R, Skjelvan I, Stocker BD, Tian H, Tilbrook B, Tubiello FN, van der Laan-Luijkx IT, van der Werf GR, van Heuven S, Viovy N, Vuichard N, Walker AP, Watson AJ, Wiltshire AJ, Zaehle S & Zhu D 2018, ‘Global Carbon Budget 2017’, Earth System Science Data, 10, pp. 405–48 [https://doi.org/10.5194/essd-10-405-2018]
NSW Legislative Council 2013, Management of public land in New South Wales, NSW Parliament, Legislative Council, General Purpose Standing Committee No. 5, Report no. 37, Sydney [www.parliament.nsw.gov.au/committees/inquiries/Pages/inquiry-details.aspx?pk=1677#tab-reportsandgovernmentresponses]
NSW T&I 2013, Renewable Energy Action Plan, NSW Trade & Investment, Sydney [https://energy.nsw.gov.au/renewables/renewable-energyoffers/renewable-energy-action-plan]
OEH 2013, NSW Energy Efficiency Action Plan, Office of Environment & Heritage, Sydney [www.environment.nsw.gov.au/energyefficiencyindustry/energy-efficiency-policy.htm]
OEH 2014, Government Resource Efficiency Policy, Office of Environment & Heritage, Sydney [https://www.environment.nsw.gov.au/government/policy.htm]
OEH 2016, NSW Climate Change Policy Framework, New South Wales Government and Office of Environment & Heritage, Sydney [www.environment.nsw.gov.au/-/media/OEH/Corporate-Site/Documents/Climate-change/nsw-climate-change-policy-framework-160618.pdf (PDF 2.4MB)]
Olivier JGJ, Schure KM & Peters JAHW 2017, Trends in global CO2 and total greenhouse gas emissions: Summary of the 2017 Report, PBL Netherlands Environmental Assessment Agency, The Hague [www.pbl.nl/en/publications/trends-in-global-co2-and-total-greenhouse-gas-emissions]
Saddler H 2018, National Energy Emissions Audit Electricity Update February 2018, Canberra [www.tai.org.au/content/audit-february-electricity-update]
Steffan W, Hughes L, Alexander D & Rice M 2017, Cranking up the Intensity: Climate Change and Extreme Weather Events, Climate Council of Australia, Sydney [www.climatecouncil.org.au/resources/cranking-intensity-report/]
TfNSW 2018, Future Transport 2056, Transport for NSW, Sydney [https://future.transport.nsw.gov.au/]
Tripati AK, Roberts CD & Eagle RA 2009, ‘Coupling of CO2 and ice sheet stability over major climate transitions of the last 20 million years’, Science, 326(5958), pp. 1394–98 [dx.doi.org/10.1126/science.1178296]
USGS 2017, Mineral Commodities Summaries: Cement, US Geological Survey [https://minerals.usgs.gov/minerals/pubs/commodity/cement/]
UNFCCC 2015, Paris Agreement: Decision – CP.21, United Nations Framework Convention on Climate Change, 30 November to 13 December 2015, Paris, France [https://unfccc.int/sites/default/files/resource/docs/2015/cop21/eng/10a01.pdf (PDF 0.5MB)]
UNFCCC 2017, National Inventory Submissions 2017, United Nations Framework Convention on Climate Change, Paris, France [http://unfccc.int/national_reports/annex_i_ghg_inventories/national_inventories_submissions/items/9492.php]