 Image source and description
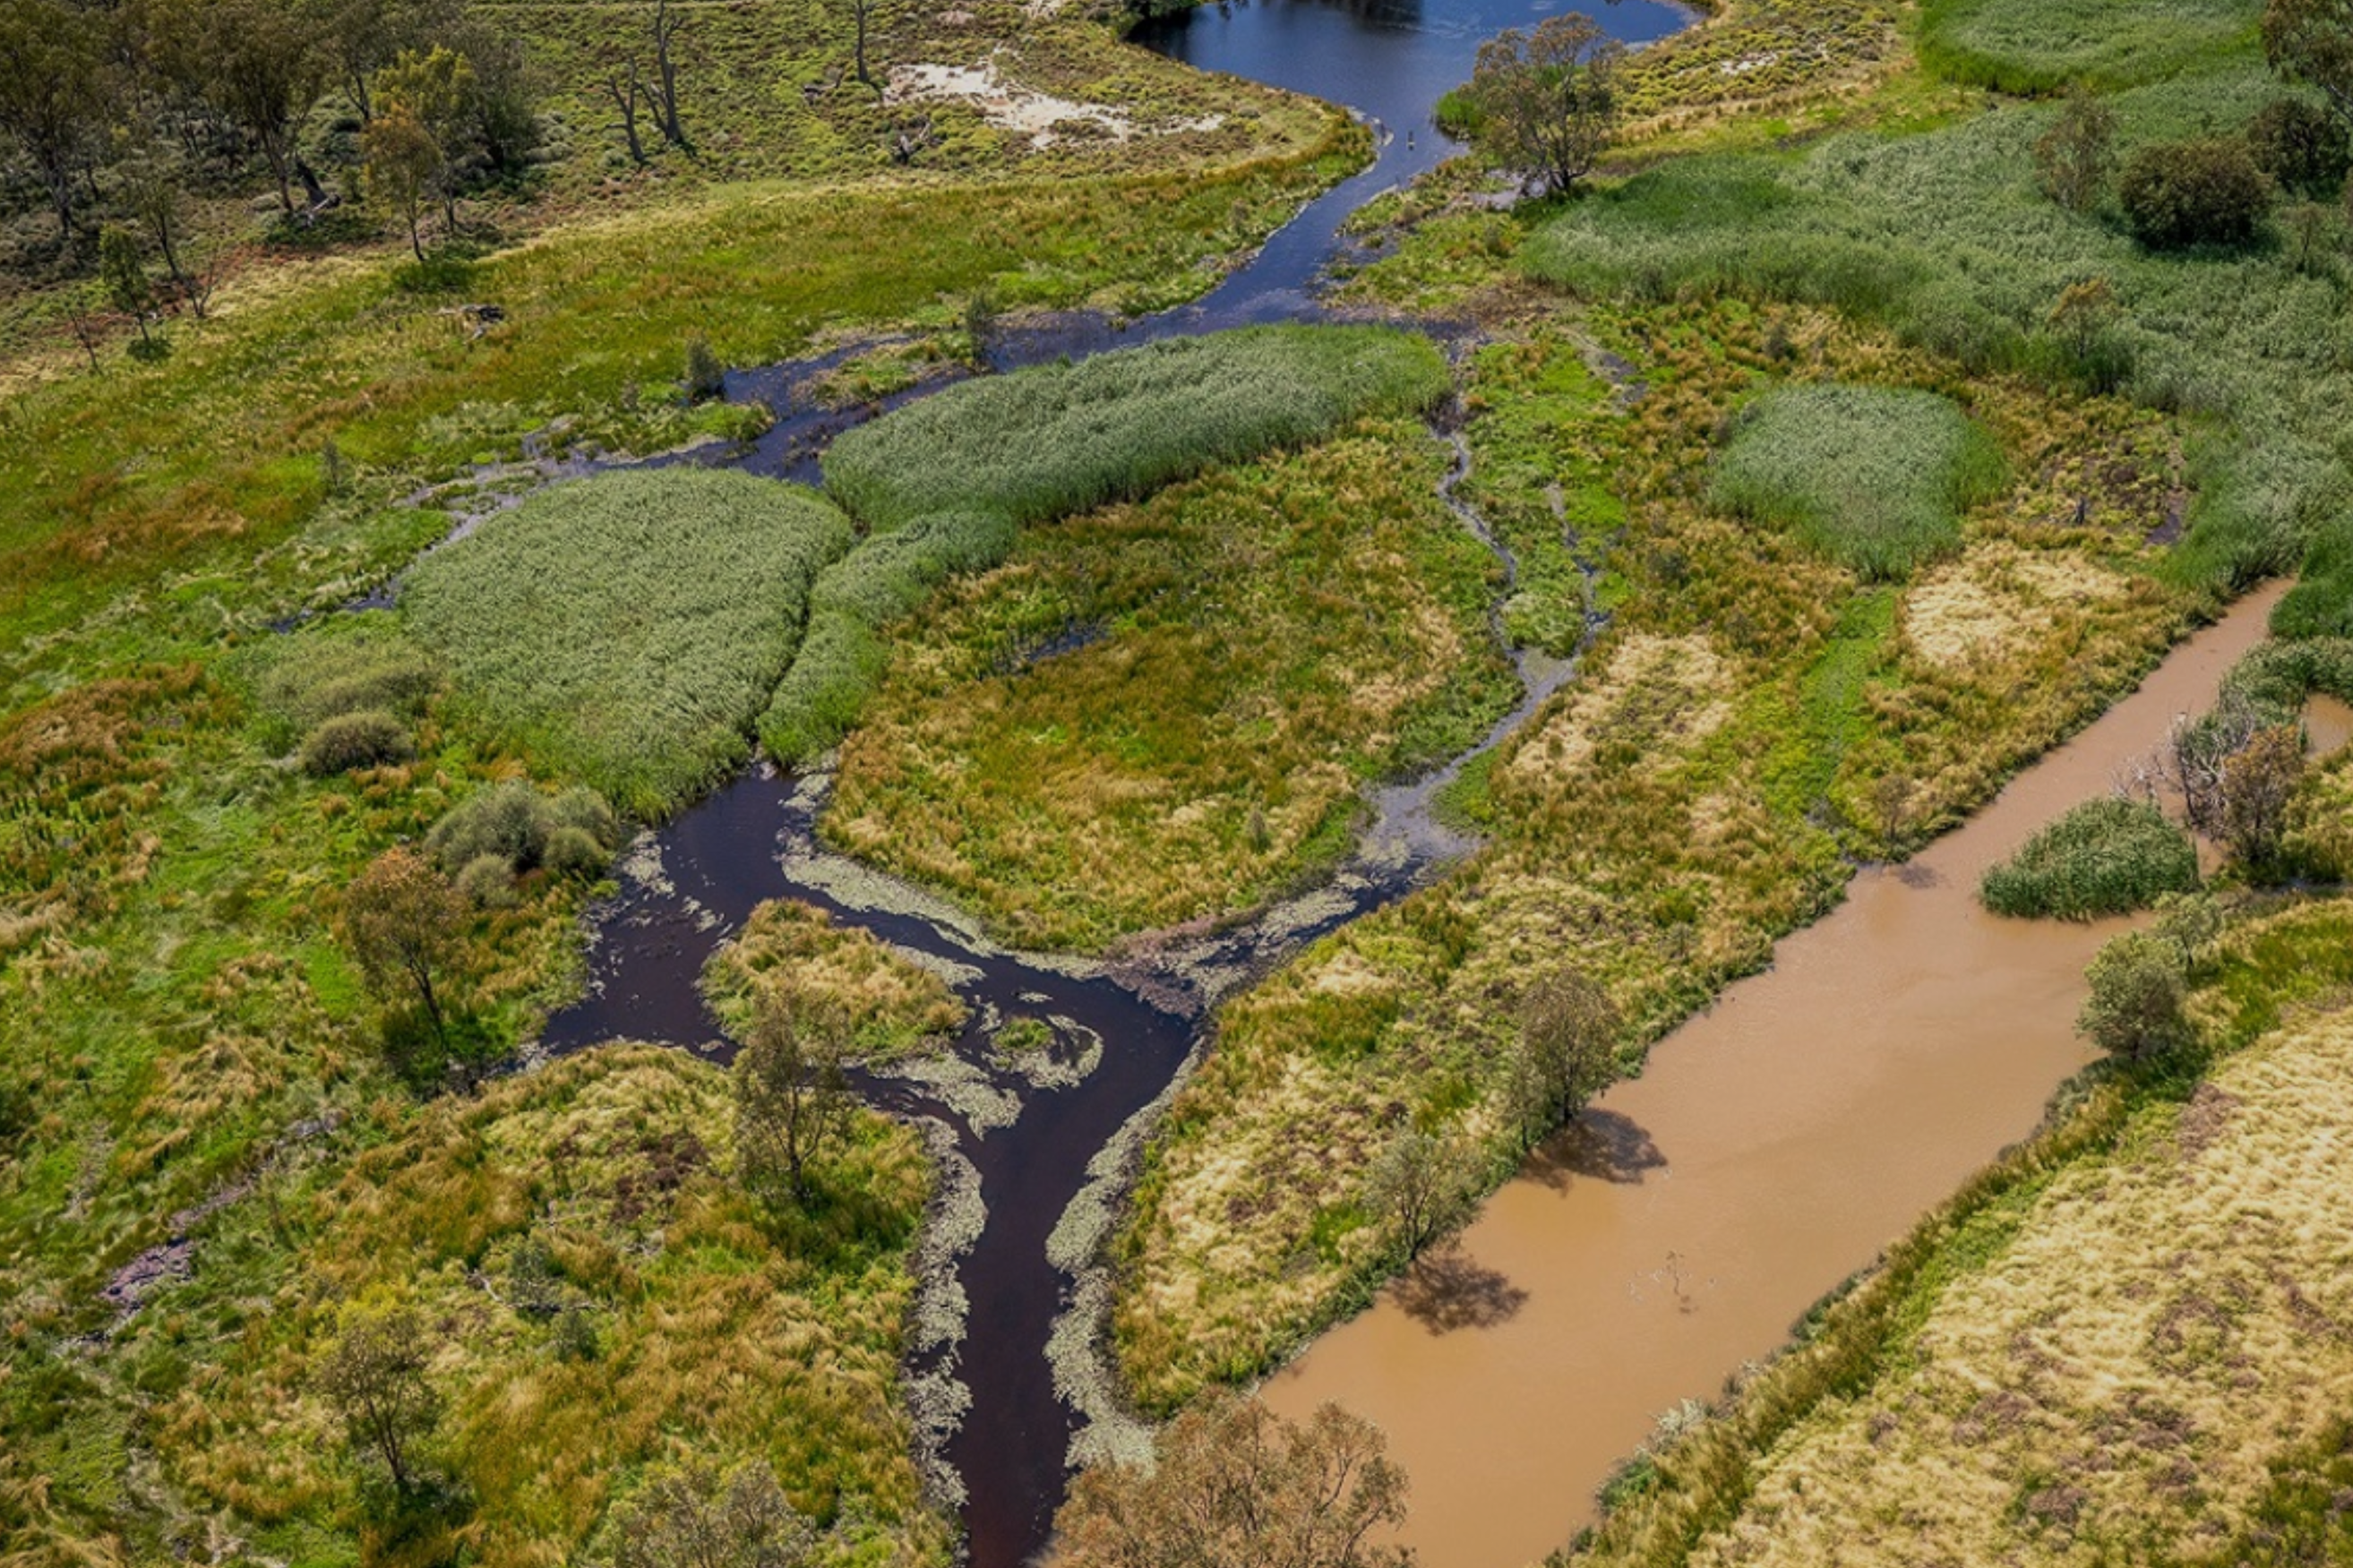
Topic image:Wailwan Country–Macquarie Marshes. Photo credit: John Spencer/DCCEEW (n.d.)Banner image:Topic image sits above Butjin Wanggal Dilly Bag Dance by Worimi artist Gerard Black. It uses symbolism to display an interconnected web and represents the interconnectedness between people and the environment.
Image source and description
Topic image:Wailwan Country–Macquarie Marshes. Photo credit: John Spencer/DCCEEW (n.d.)Banner image:Topic image sits above Butjin Wanggal Dilly Bag Dance by Worimi artist Gerard Black. It uses symbolism to display an interconnected web and represents the interconnectedness between people and the environment.
Rivers and wetlands 2024
Declines in river and wetland health are reducing biodiversity of water-dependent plants and animals, including waterbirds, fish, frogs and turtles.
NSW State of the Environment
This Rivers and wetlands 2024 page reflects the State of the Environment 2024 report as tabled in parliament for this section.
Overview
‘For First Peoples, water is a sacred source of life. The natural flow of water sustains aquatic ecosystems that are central to our spirituality, our social and cultural economy and wellbeing. The rivers are the veins of Country, carrying water to sustain all parts of our sacred landscape. The wetlands are the kidneys, filtering the water as it passes through the land’ ().
Rivers and wetlands are critical components of a healthy environment. They support our cities and towns, as well as irrigation, grazing and many industries. They provide the ecosystem services needed for good water quality and supply, and habitats for a wide range of plants and animals, including threatened species.
Rivers and wetlands are intrinsically connected to each other, by groundwater or surface water. The systems include the rivers themselves, the riparian zones (where water meets land), floodplains, billabongs, lakes, swamps, marshes and bogs.
Rivers and wetlands provide each other with water, sediments and nutrients. Wetlands can act as filters and improve the quality of water in rivers.
The plants and animals making up the ecosystems of rivers and wetlands have adapted to the natural cycles in water flow. Disruption of these cycles – for example by drought or human activity – harms them.
Rivers and wetlands can recover from infrequent drought. But they struggle to recover if droughts become more frequent or if human activity disrupts water flow.
See the topic for information on coastal wetlands, including saltmarsh and mangroves.
Rivers and wetlands in NSW
Rivers
There are 58,000km of rivers and major streams in NSW ().
The Great Dividing Range separates NSW into east and west. The coastal strip to the east of the Range has rivers that flow to the East Coast. This includes the large catchments of the Clarence River on the North Coast, the Hunter River flowing to the coast at Newcastle, and the Hawkesbury–Nepean River, which almost encircles the Sydney Basin.
To the west of the Divide are the rivers of the Murray–Darling Basin. In the south of the basin, the Lachlan and Murrumbidgee rivers flow into the Murray River under high flow conditions. Rivers in the north of the basin flow into the Darling–Baaka, which then joins the Murray River in the far south-west of the State.
Wetlands
Wetlands are areas of land covered or saturated with fresh, brackish or salt water that is generally still or slow moving. The water can also sit just below the surface.
An area doesn’t need to be permanently wet to qualify as a wetland. Flooding or saturation can happen cyclically or intermittently. The area just needs to be wet for long enough for its plants and animals to be adapted to – or even dependent on – wet conditions for at least part of their life cycle.
There are more than 20,000 wetlands across NSW.
Based on Landsat (satellite) imagery, wetlands covered about 4.5 million hectares of NSW, or about 6% of the State ().
Our biggest wetlands are in the Murray–Darling Basin and include the Ramsar-listed wetlands, such as the Macquarie Marshes. Many wetlands are coastal and include estuaries, coastal lakes and lagoons. NSW also has a few freshwater wetlands on the Tablelands and in the high Alpine regions.
NSW protects wetlands by:
- including them within the National Parks and Wildlife Service reserve system (see NPWS parks)
- listing them in the Directory of Important Wetlands of Australia (DIWA) ()
- protecting them under the Convention on Wetlands of International Importance (Ramsar convention).
NSW has 13 Ramsar-listed wetlands. All of them overlap with DIWA-listed wetlands.
Why river and wetland health matters
In the driest inhabited continent on earth, Australia, the rivers and wetlands of NSW have been central to human life for tens of thousands of years (). They are highly valuable ecosystems that provide clean water and extensive habitats for fish, waterbirds and vegetation (). In many areas of NSW, connection between rivers, wetlands and groundwater is fundamental to ecosystem health and clean water.
People in NSW use waterways for many purposes. They are a source of water for drinking and other domestic purposes, and a place for recreation and tourism, including fishing, swimming and boating. Rivers are essential for agriculture and all types of industry, including mining and electricity generation.
Rivers and wetlands can increase personal wellbeing and create a sense of place, belonging and community.
Clean water is necessary for a healthy planet. Changes to freshwater use may result in abrupt unacceptable changes to Earth’s environment (). In their recent planetary health check, assessed global use of freshwater as operating beyond the safe zone. This increases the risk of environmental change that reduces liveability on the planet.
Maintaining river and wetland ecosystems is vital for the health and wellbeing of Aboriginal communities. Flowing rivers are central to the identity, health and cultural continuity of Aboriginal peoples, underpinning their connection to Country and their duty to care for downstream communities ().
For Aboriginal peoples, water is a living thing and intrinsic to culture. Flowing rivers are central to community health and wellbeing, food security, cultural education and employment opportunities ().
‘First Nations Peoples have rights and a moral obligation to care for water under their law and customs. These obligations connect across communities and language groups, extending to downstream communities, throughout catchments and over connected aquifer and groundwater systems’ ().
The rivers and wetlands of NSW are vital to the continued existence of many of its unique animals, plants and ecological communities.
Wetlands perform multiple environmental functions, including:
- helping to reduce the impacts from storm damage and flooding
- maintaining good water quality in rivers
- recharging groundwater
- storing carbon
- helping to stabilise climatic conditions
- controlling pests
- acting as important refuge sites for animals and plants.
Condition of NSW rivers and wetlands
Rivers
Nearly all (97%) of the State’s rivers and major streams have been substantially modified by land use change, extraction of water and damage to bordering vegetation ().
The River Condition Index is assessed across NSW. It measures river condition using water quality and flow, and biological and geomorphological data. The 2023 update shows that coastal rivers and those in the Far West of the State were in good or moderate condition. Rivers through the middle of the State rate as poor or very poor.
Wet weather in the last few years has increased nutrient loads in rivers. More than 80% of the 140 monitoring sites recorded high nutrient loads in more than a quarter of their samples.
Salinity within NSW river systems is good: 135 of the 140 sites were rated ‘good’ during 2021–23.
Fish provide an indication of the health of rivers. Healthy rivers have plenty of fish of different species. Mass deaths of fish (fish deaths) indicate poor river health. Since January 2021, 190 fish death events have been investigated. A significant event occurred on the Darling–Baaka in March 2023 and was declared a state emergency ().
See the Fish kills section of this topic for more information.
Wetlands
Wetland health is indicated by the variety of plants and animals within them, and the area that is inundated.
Assessment of wetland vegetation rated 17 of 28 inland wetlands as ‘poor’, but only 4 of 19 coastal wetlands as ‘poor’.
The annual Eastern Australian Waterbird Survey provides information on both the area inundated and the number of waterbirds in each of 50 species. The survey in 2023 found inundation in the surveyed areas was below the long-term median.
Waterbird abundance showed more birds than usual following the past two wet springs. Both the number of species nesting and overall breeding numbers were near median (middle) values for the years since 1983.
Surveys of frogs found good conditions for breeding in the Gwydir, Macquarie and Lowbidgee wetland systems.
NSW has seven native species of turtles, three of them listed as threatened. Recent surveys found high abundance of six of the species but listed the other as rare.
See Wetland animals section of this topic for more information.
Key threats
Since colonisation, river and wetland health has been threatened by changes to water flow, increased sediment, release of water at the wrong temperature or the wrong time, and pollution from urban runoff, agriculture and industry.
Due to dispossession, many Aboriginal peoples have lost their ability to fulfill their roles as caretakers of the waters to sustain their traditional life, culture, languages and knowledges (). This harms the health of rivers and wetlands.
Rivers and wetlands in NSW are under pressure from:
- regulation of river flows by dams and weirs
- extraction of water from rivers and groundwater
- clearing of riverside and wetland vegetation
- floodplain harvesting that interferes with natural flow patterns
- diffuse-source water pollution, including agricultural runoff and urban stormwater
- sedimentation from runoff and the erosion of land and riverbanks
- invasive plant and animal species
- stock access and grazing
- climate variability and the impacts of climate change.
Wetlands are also particularly threatened by development, such as housing, industry and roads.
Management and regulation
Addressing the declining health of river and wetland ecosystems is a global concern.
Some jurisdictions have given rivers human rights to help to improve their protection. Examples include the Whanganui River in New Zealand and the Ganga (Ganges) and Yamuna rivers in India.
Rivers and wetlands are managed in NSW by a variety of government agencies and organisations. These include:
- the NSW Department of Climate Change, Energy, the Environment and Water (NSW DCCEEW), through the:
- DCCEEW Water Group – research, policy and management
- DCCEEW BCS Group (Biodiversity, Conservation and Science) – ‘water for the environment’ management, policy and research, including:
- programs relating to flows and connectivity, wetland vegetation, waterbirds, and other animals such as fish, frogs and turtles
- programs for the NSW portion of the Murray–Darling Basin
- National Parks and Wildlife Service (NPWS) – management of rivers and wetlands within the National Parks estate, and research
- Water NSW – the operator of most dams and weirs in the State
- NSW Department of Primary Industries and Regional Development (DPIRD) – research and policy on improving native fish populations and key aquatic habitats.
NSW also has an extensive regulatory framework to manage the extraction of water from our rivers under the NSW Water Management Act 2000.
Under this Act, the entire State is covered by Water Sharing Plans. These plans allocate water among users – agriculture, industry, towns and the environment. Water extraction under these plans requires an appropriate licence and metering equipment so the volumes of water taken can be measured.
The NSW Environment Protection Authority (EPA) regulates activities that may pollute water entering rivers and wetlands.
Table W1.1 lists current legislation and policies that contribute to the management of our river and wetland ecosystems.
Table W1.1: Current legislation and policies for rivers and wetlands in NSW
| Legislation or policy | Summary |
|---|---|
| NSW Water Management Act 2000 | Recognises the need for allocation and provision of water for environmental health of rivers and groundwater, and provides water licence holders with secure access and trade opportunities |
| NSW Coastal Management Act 2016 | Establishes the framework and overarching objects for coastal management. Its purpose is to manage the use and development of the coastal environment in an ecologically sustainable way for the social, cultural and economic wellbeing of the people of NSW |
| Protection of the Environment Operations Act 1997 | Part 5.3 prohibits the pollution of waters |
| Murray–Darling Basin Plan | Sets the amount of water that can be taken from the Murray–Darling Basin while leaving enough to maintain the environmental health of the river |
| NSW Long-Term Water Plans | Guides and informs water management (including water for the environment) for environmental outcomes by setting objectives, targets and water requirements for plants, waterbirds, fish and other species, such as frogs, over 5-, 10- and 20-year timeframes |
| NSW Water Strategy 2021 | Sets the overarching vision for 12 regional and two metropolitan water strategies, tailored to the individual needs of each region in NSW |
| State Environmental Planning Policy (Resilience and Hazards) 2021 | Chapter 2 covers how development proposals are assessed if they are in a coastal zone. It is supported by detailed mapping |
| Water Resource Plans | Outlines how each water resource area aims to achieve community, environmental, economic and cultural outcomes and ensure that State water management rules meet the Murray–Darling Basin Plan objectives. The plans reflect current arrangements that are working and incorporate new arrangements that strengthen water management at a local level. |
| Water Sharing Plans | Provides rules for the allocation and sharing of water between water users and environmental needs. They are provided for different regions and water sources within NSW |
Notes:
See the Responses section of this topic for more information about how rivers and wetlands are managed in NSW.
Water for the environment
Water is set aside specifically to support the health of rivers, wetlands and floodplains across NSW. More information is available in the topic.
Related topics: | |
Status and trends
Rivers and wetlands indicators
Four indicators are used to assess the status and trends of rivers (see Table W1.2), and three indicators to assess the status and trends of wetlands (see Table W1.3).
Rivers
- River condition index for NSW rivers measures the overall health of rivers using six datasets: riparian vegetation cover, hydrological stress, biodiversity condition, geomorphic condition, catchment disturbance and water quality index. This indicator is assessed as moderate status and trend of getting worse with values in the Murray–Darling Basin scoring particularly poorly (see River health).
This indicator aligns to the ‘biosphere integrity’ planetary boundary. Globally, this boundary has been crossed (see ). - Nitrogen and phosphorus levels measures water quality by the levels of these nutrients in rivers. They are used to indicate river health as excessive nutrients can reduce oxygen levels or contaminate drinking water. This indicator is assessed as moderate status and stable trend (see Nutrients).
This indicator aligns to the ‘modification of biochemical flows’ planetary boundary. Globally, this boundary has been crossed (see ). - Salinity measures the concentration of dissolved salts in water. This indicator is assessed as good status and stable trend (see Salinity).
- Health of fish communities measures the number of juvenile fish developing into adults, the distribution of fish species, and the total number and mass of fish in river systems. It is used as an indicator of river health as fish communities need the right water flow and quality to live. This indicator is assessed as poor status and trend of getting worse, with poor outcomes across all measures, and an increase in fish kill events (see Health of fish communities).
This indicator aligns to the ‘biosphere integrity’ planetary boundary. Globally, this boundary has been crossed (see ).
Table W1.2: NSW indicators (rivers)
| Indicator | Environmental status | Environmental trend | Information reliability |
|---|---|---|---|
| River condition index for NSW rivers | Getting worse | Reasonable | |
| Nitrogen and phosphorus levels | Stable | Reasonable | |
| Salinity | Stable | Reasonable | |
| Health of fish communities | Unknown | Reasonable |
Notes:
Indicator table scales:
- Environmental status: Good, moderate, poor, unknown
- Environmental trend: Getting better, stable, getting worse
- Information reliability: Good, reasonable, limited.
See to learn how terms and symbols are defined.
Wetlands
- Wetland extent measures the area of wetlands that are inundated, and the total area of wetlands in the public and private protected area system. This indicator is assessed as moderate status and trend of getting worse due to decreasing areas of inundation. Significant area was recently added to the protected area system (see Extent).
- Wetland condition measures wetland and riparian vegetation to indicate the ecological function of the wetlands. This indicator is assessed as moderate status and trend of getting worse, with many surveyed plant communities declining, particularly in the Murray–Darling Basin (see Condition).
- Waterbird abundance and breeding measures the total number of waterbirds, species diversity and nesting using data from the Eastern Australian Waterbird Survey. This indicator is assessed as poor status and trend of getting worse due to ongoing reduction in suitable inundated wetland habitat (see Waterbirds).
These indicators align to the ‘biosphere integrity’ planetary boundary. Globally, this boundary has been crossed. See the page for more information.
Table W1.3: NSW indicators (wetlands)
| Indicator | Environmental status | Environmental trend | Information reliability |
|---|---|---|---|
| Wetland extent | Getting worse | Limited | |
| Wetland condition | Getting worse | Limited | |
| Waterbird abundance and breeding | Getting worse | Good |
Notes:
Indicator table scales:
- Environmental status: Good, moderate, poor, unknown
- Environmental trend: Getting better, stable, getting worse
- Information reliability: Good, reasonable, limited.
See Indicator guide to learn how terms and symbols are defined.
River health
River health is measured by the condition of various ecological indicators, including water quality, biodiversity, and habitat availability.
River condition
The River Condition Index provides a readily available assessment of river condition in NSW and applies to all rivers in the State.
This index assesses the health of NSW rivers using a combination of:
- riparian vegetation cover – condition of vegetation along river channels
- hydrological stress – level of stress caused by changes in flows due to dams, weirs and other infrastructure
- biodiversity condition – condition of aquatic communities
- geomorphic condition – condition of stream channels and banks
- catchment disturbance – indicative level of land use change in a catchment
- water quality index – relative indicator of long-term water quality.
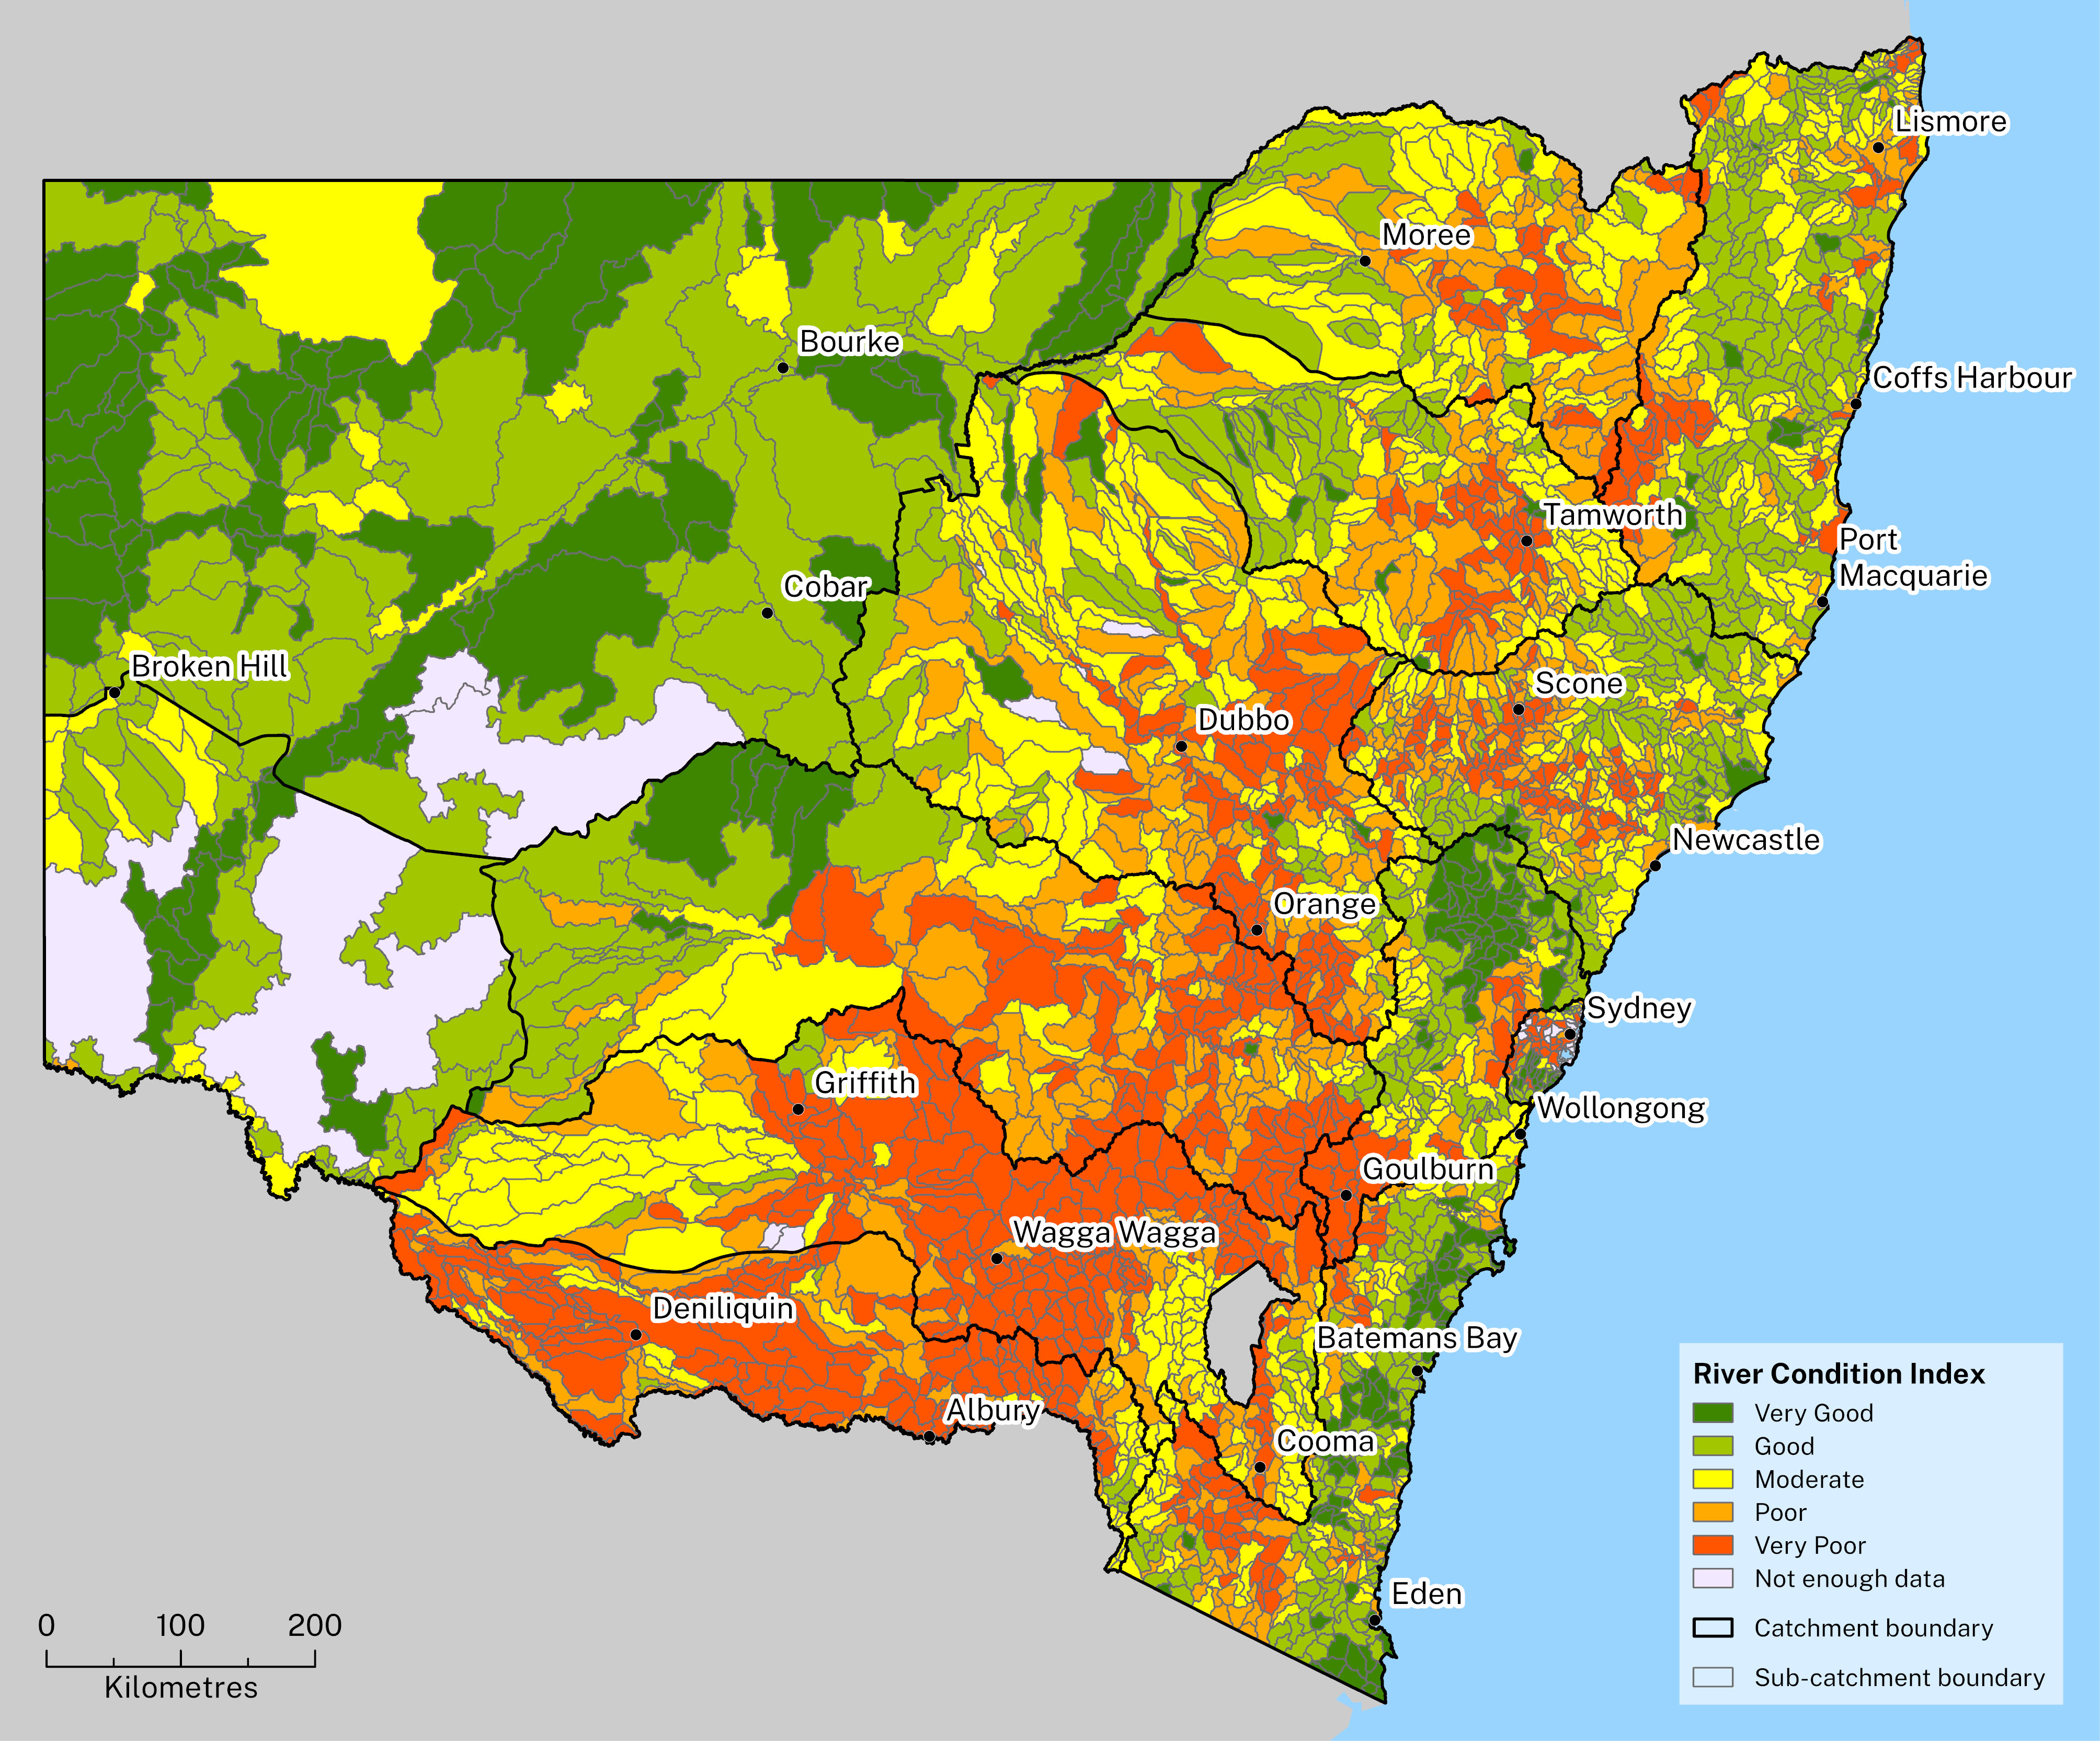
The 2023 index update shows that river conditions tend to be worse in the southern and central western regions of NSW than in the far western region (see Map W1.1). Index values are lower in many areas than the assessment in 2018 ().
Many areas within the Murray–Darling Basin are in ‘poor’ or ‘very poor’ condition, whereas coastal areas generally range from ‘moderate’ to ‘very good’ condition.
The index focuses on western measures of environmental health and does not include Aboriginal cultural indicators of the health of Freshwater Country.
A shared language of water management is often absent between Aboriginal communities and water authorities. Technical jargon can hinder effective communication and understanding of Indigenous knowledge and values ().
The Aboriginal Waterways Assessment tool provides a method to assess the cultural value and cultural health of waterways (). It has not yet been widely applied in NSW.
See the NSW River Condition Index for more information.
Map W1.1: River Condition Index value in NSW catchments
Notes:
River Condition Index scores are not comparable between the 2012 and 2023 versions, as some datasets used in 2012 were no longer collected or available for the 2023 update. Some of the new sub-indices may perform as better indicators of change. This second iteration sees changes in the rating of conditions since 2012, as well as the introduction of the Water Quality Index.
Water quality
Two important measures of water quality in rivers are the amount of nutrients and the salinity (amount of salt).
Regular monitoring helps identify sources, track trends over time, and inform management strategies so they can reduce harms to both ecosystems and communities (). Monitoring is conducted at 141 sites.
Water quality is assessed using different measures depending on location. Coastal sites use the National Guidelines for Fresh and Marine Water Quality. Inland sites use the Murray–Darling Basin Plan water quality targets (Basin Plan 2012, Schedule 11).
Nutrients
Excessive nutrients can lead to algal blooms (eutrophication), which deplete oxygen levels in water and harm aquatic life. High nutrient levels can also contaminate drinking water supplies, posing risks to human health.
Nutrient load is assessed using the concentrations of nitrogen and phosphorus. The current target for water quality is that at each site, fewer than 75% of samples exceed the guideline concentration for that site. Guideline concentrations are generated based on local conditions. See NSW Water Quality and River Flow Objectives for information on these guidelines.
Monitoring sites have been given a rating based on the proportion of samples reporting an exceedence. The ratings are ‘good’ (fewer than 25% of observations), ‘moderate’ (25% to 50%), ‘poor’ (50% to 75%) and ‘very poor’ (more than 75%).
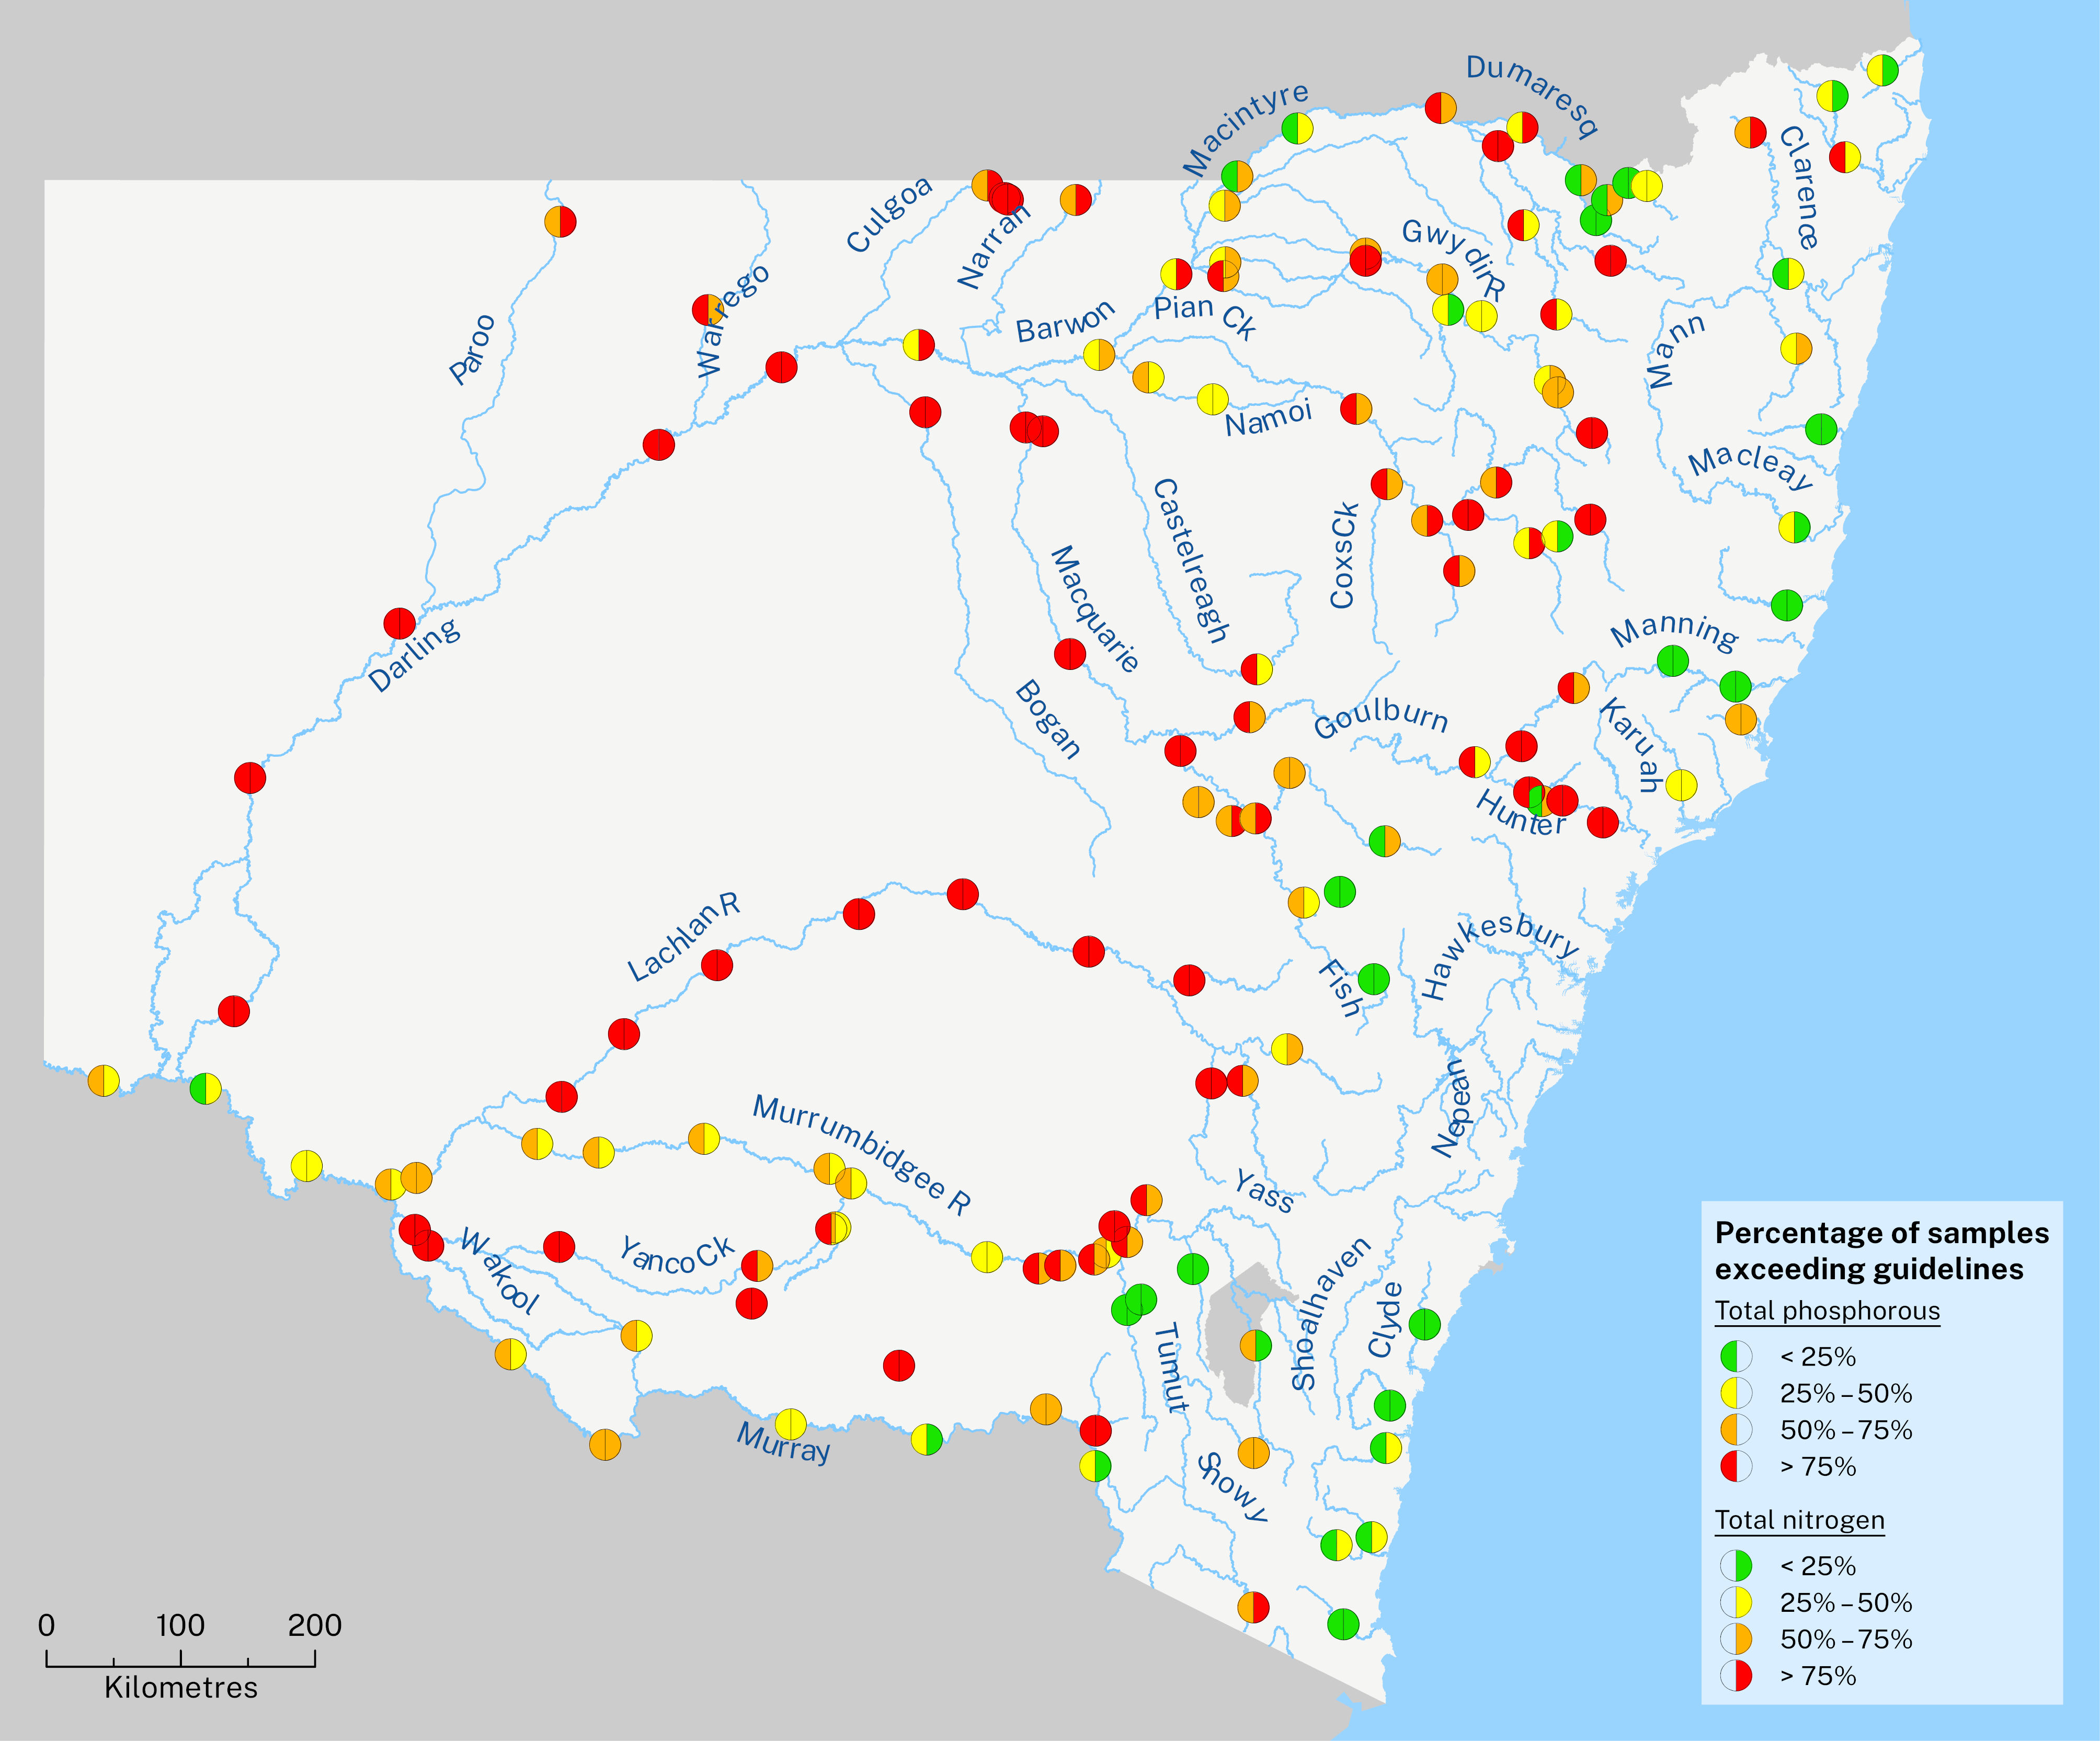
Water quality ratings from 2021 to 2023 were generally better at sites on the coast (see Map W1.2). Those on the North and South coasts had better water quality than those in the Hunter region and inland.
The target of fewer than 75% of observations exceeding guideline concentrations was not met at 50 sites (36%) for nitrogen and 58 sites (41%) for phosphorus.
See the topic for more information on coastal catchment water quality.
Map W1.2: Exceedance of water quality targets for total nitrogen and total phosphorus, 2021–23
Notes:
Data show the percentage of water samples from NSW streams with nitrogen and phosphorus concentrations that exceeded water quality targets from 2021 to 2023 (that is, they were above accepted targets).
Nutrient concentrations are generally higher in wetter years owing to more runoff (). Major flooding resulted in high nutrient concentrations at sites in:
- the lower Lachlan River
- the lower Macquarie River
- the Hunter River
- Billabong Creek
- the middle and lower Darling–Baaka River.
Higher nutrient levels were also recorded in the upper Murray River catchment. This was due to heavy rainfall following the 2019–20 Black Summer bushfires. The high rainfall carried ash as well as soil into waterways in this region ().
More sites exceeded the nitrogen and phosphorus targets in 2021–23 than in 2018–20 (see Figure W1.1).
- There were increases in the numbers of sites rated very poor (red segment) for both nitrogen (from 22 to 50 sites) and phosphorus (from 24 to 58 sites).
- There was a decrease in the number of sites rated good (green segment) for nitrogen (from 52 to 22 sites).
- Across NSW, 76 sites (54%) had a worse rating for total nitrogen and 78 sites (56%) had a worse rating for total phosphorus than in the previous reporting period.
- There were improvements at only 14 sites in total nitrogen and 3 sites in total phosphorus.
Figure W1.1a: Rating of exceedances in nitrogen targets for 2018–20 and 2021–23
Figure W1.1b: Rating of exceedances in phosphorous targets for 2018–20 and 2021–23
Salinity
Salinity refers to the concentration of dissolved salts in water. It is expressed as parts per thousand (ppt) or Practical Salinity Units. Practical Salinity Units is measured using electrical conductivity and reported as microsiemens per centimetre (µS/cm) or converted to grams per litre (g/L) ().
Salinity levels in NSW waterways remain generally stable, although they rise and fall depending on the season.
River salinity is caused when water laden with salt is discharged from areas suffering from dryland or irrigation salinity, or when salty water is discharged by mining or industry. This is particularly of concern in the Murray and Murrumbidgee catchments and the Hunter River.
Salinity influences the distribution and abundance of species because different organisms have differing tolerances to salinity levels. Changes in salinity can disrupt breeding and feeding patterns, resulting in fewer organisms. This results in reduced ecosystem stability and poorer biodiversity.
Increased salinity can also threaten freshwater resources and harm agriculture by reducing soil fertility.
Monitoring salinity is essential for managing water quality and making sure that human activities and natural ecosystems that depend on freshwater can be maintained (; ).
Salinity is continuously monitored at many sites in the Murray–Darling Basin to determine long-term salinity trends. Salinity levels are assessed against targets in the Australian Government’s Salinity Management Strategy.
The NSW Government also sets a target for the overall salinity in a river system, against which salinity is assessed.
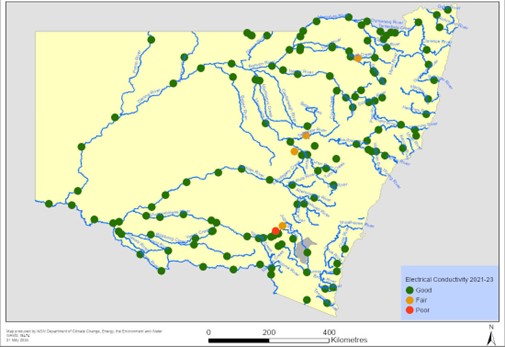
Most of the 141 sites assessed for electrical conductivity against the Australian drinking water guidelines () were rated as good (see Map W1.3).
The five monitoring sites that did not receive a good rating are in catchments with known salinity issues due to high salt loads stored in the soil and underlying geology.
Four of these were rated as fair – Myall Creek in the Gwydir Valley, the Little and Talbragar rivers in the Macquarie Valley, and Jugiong Creek in the Murrumbidgee Valley). Muttama Creek in the Murrumbidgee Valley was rated as poor.
Salinity in the Hunter River is managed through the Hunter River Salinity Trading Scheme.
Map W1.3: Salinity rating targets 2021–23
Notes:
Electrical conductivity measured in microsiemens per centimetre (µS/cm):
Good = 0–938 µS/cm
Fair = 939–1406 µS/cm
Poor = 1407–1875 µS/cm
Very poor = 1876 µS/cm or greater
Salinity levels in most streams remain relatively stable (see Table W1.4). Variations are generally attributable to changes in flow conditions.
In Chile, drought increased salinity in rivers through both increased evaporation and decreased dilution of saltier inflows (). Both slower flows and drier weather increased salinity because the salt in the river is dissolved in less water. With less water in rivers, the naturally saltier groundwater entering rivers is diluted less.
In NSW, saline inflow occurs from the use of groundwater and from mining.
Increased streamflow and major flooding across NSW in 2021–23 flushed accumulated salts from waterways and diluted saline inflows, resulting in a return to lower salinity ().
Table W1.4: Comparison of salinity ratings across State of the Environment reporting periods
| Rating | 2015–17 | 2018–20 | 2021–23 |
|---|---|---|---|
| Good | 130 | 126 | 135 |
| Fair | 5 | 9 | 4 |
| Poor | 4 | 4 | 1 |
| Very poor | 1 | 1 | 0 |
Health of fish communities
The health of fish communities is an important indicator of the health and function of rivers (). Fish communities need the right flows of water to support in-stream habitat and to provide them with food. Without the right flows, they suffer, as rivers and catchments are not functioning as they should (; ).
The health of freshwater fish is measured by the long-term trends for fish species in:
- recruitment – how many juvenile fish develop into adults
- distribution – spatial spread of fish species through river network
- abundance and biomass – how many fish there are and their total mass in river systems; abundance and biomass are related, but increased abundance after spawning events may not significantly influence biomass until fish mature.
Floods can trigger large recruitment events, while droughts reduce abundance. There is naturally large variation in abundance between species and across regions because of the high variability of the State's climate. Long-term data is needed to show trends in health.
The health of freshwater fish communities is poor. Relative abundance of key species in the Murray-Darling basin is stable but there has been a marked increase in fish kill events. The trend in health is assessed as uncertain.
The number of fish kill events has increased significantly since 2019, from an average of 21 for the years 2009–18 to an average of 69 for the years 2019–2023.
Fish health in the Murray–Darling Basin
Freshwater fish communities across the NSW Murray–Darling Basin have been monitored using standardised methods since the mid-1990s. Key programs currently collecting data include the NSW Government’s Murray–Darling Basin Plan Environmental Outcomes Monitoring – Fish program () and the Murray–Darling Basin Authority’s Fish Survey program.
The NSW Murray–Darling Basin Plan intends to ensure that the rivers, wetlands and floodplains are restored to a healthy and resilient state. The Basin-wide environmental watering strategy sets targets to measure progress on this goal. Some of these targets relate to fish health.
The most recent assessment shows that only 83 of the 193 targets had been achieved ()
Distribution
Overall distributions of many species in the NSW Murray–Darling Basin have remained stable over the past 30 years (). The distribution of both silver perch and trout cod has decreased.
Silver perch is now restricted to isolated locations in the southern basin and upper reaches of some northern tributaries. This change likely occurred before 2018.
Trout cod now appears restricted to the Murrumbidgee and Murray systems. It has not been recorded in the Macquarie catchment since 2018.
Abundance and biomass
Standardised monitoring for abundance and biomass of key freshwater fish species began in the mid-1990s (). There is substantial variation both between species and within species in different regions.
Most species were in a significantly depleted state at the time and there has been no clear change in the overall status of native fish populations over recent decades.
It is difficult to estimate the abundances and biomass of native fish that can be supported under current conditions due to the degraded state of rivers in the Murray–Darling Basin compared to pre-colonisation conditions.
See the NSW DPIRD Fish Monitoring Reports website for specific trends in biomass for key species. A full summary on fish outcomes can be found in the NSW Basin Plan Matter 8 report ().
Abundance
Long-term abundance trends for many of the key species in the Murray–Darling Basin remain relatively stable (see Figure W1.2). Widespread flooding in 2022 promoted large spawning events and a large abundance of juvenile carp. These are unlikely to survive in the longer term.
Figure W1.2: Relative abundance of key species in the NSW Murray–Darling Basin, 1994–2023
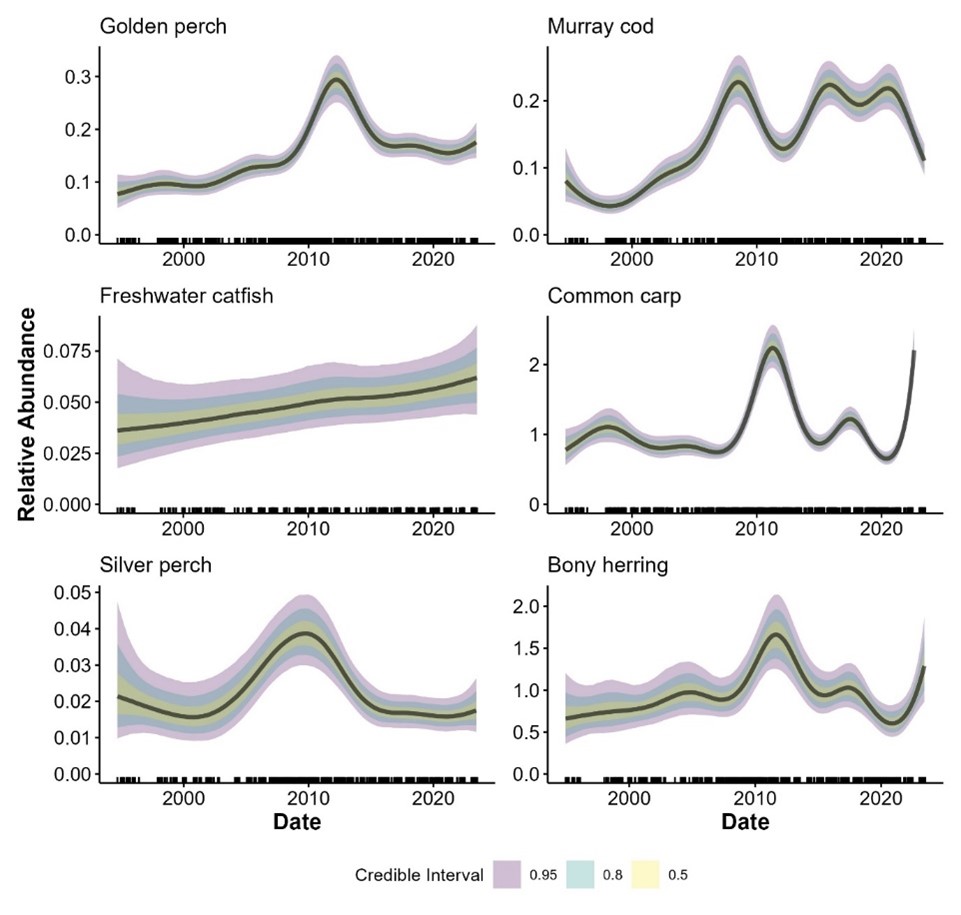
Notes:
Graphs show relative abundance of species across time.
Colours show various levels of confidence around the biomass estimates.
Biomass
Increased abundance of golden perch and freshwater catfish species (see Figure W1.2) contrasts with decreases in biomass (see Figure W1.3): there are more fish, but they are smaller, indicating that conditions do not support them in growing to adulthood.
Long-term biomass trends for many of the key species in the Murray–Darling Basin remain relatively stable (see Figure W1.3). Murray cod biomass has increased since the 1990s.
Increases in biomass tend to occur in years following significant freshwater flows.
Common carp are an established invasive species in most inland waterways. Overall, biomass has been relatively stable since the 1990s and the species has likely reached carrying capacity in most areas of the NSW Murray–Darling Basin.
The average proportion of total fish biomass made up by common carp across sites in this area is about 57%, although there are locations where common carp contributes close to 100% ().
Large numbers of common carp juveniles are often produced in response to flooding events, but these do not seem to substantially alter the overall biomass in the longer term.
Figure W1.3: Relative biomass of key species in the NSW Murray–Darling Basin, 1994–2023

Notes:
Numbers are unitless and show relative biomass of species across time.
Species biomass cannot be compared between species using these charts.
Colours show various levels of confidence around the biomass estimates.
Fish kills
Fish mortality events, also known as fish kills, can occur at any time. They are most likely in summer or following sudden changes in temperature and river flows. These changes can reduce the amount of oxygen dissolved in the water and thus kill fish.
The DPIRD maintains a statewide database of reported fish kill events in NSW (see Figure W1.4), holding more than 1,600 records dating back to the early 1970s. It is the lead agency for coordinating responses to such events.
There has been a marked increase in fish kill events since 2019. From 2009 to 2018, the number of fish kill events each year was between 12 and 32 with an average of 21. The years 2019–23 ranged from 45 to 81 with an average of 69.
Figure W1.4: Freshwater fish kill events reported, 2009–23
Flows and water volumes vastly improved across most of NSW from 2021 to 2023. This followed intense drought conditions that covered most of the State from 2017 to 2020. The improved conditions provided opportunities for native fish recovery across most of NSW.
Recent fish kill events
Despite these improvements, significant fish deaths occurred in key areas.
Since January 2021, the NSW Government has investigated more than 190 fish death events. This included 80 events in coastal locations and more than 70 in inland river systems.
In March 2023, a large-scale fish death occurred in the 40-kilometre reach of the Darling–Baaka River between Menindee Main Weir and Weir 32, next to Menindee. The incident was declared a formal state emergency and associated emergency management protocols were followed ().
The NSW Government responded to the fish death event through its emergency management arrangements. The NSW Environment Protection Authority (EPA) led the Environmental Services Functional Area (EnvSFA) incident response.
Between March and July 2023, the EPA worked closely with NSW DCCEEW, Science and Insights Division to conduct water quality monitoring in the Darling–Baaka River near Menindee.
It is estimated that tens of millions of fish died during the event ().
The bony herring, an important totemic species along the Darling–Baaka River, was the main species affected during this event. It is a short-lived, fast-growing species that booms in times of floods and can die off in large numbers as river flows return to normal ().
The fish kill area overlaps the area affected during 2018–19.
A secondary fish death event affected adult golden perch within the Menindee Weir 32 pool in February 2024. It is estimated more than 100 fish died during the event.
Water quality parameters that typically affect fish health were within or near normal range during this period, including dissolved oxygen, temperature, salinity and pH (acidity).
Testing for pesticide residue and other toxins completed in early February by NSW DCCEEW and EPA found no adverse results. Government agencies are continuing to test for other toxins and are taking more sediment samples.
See the and topics for more information.
The recent fish deaths affecting the Darling–Baaka River have been devastating to the Barkandji people, for whom the Baaka River has served as a cultural, spiritual and economic lifeline for tens of thousands of years ().
Their deep connection to the river is evidenced by the creation of intricate fish trap systems, which have supported their livelihoods and cultural practices (). These structures represent a sophisticated understanding of hydrology and ecology, far predating modern water management practices ().
The Barkandji people continue to maintain these ancestral fishing practices in Wilcannia and Menindee to this day, manipulating the riverbed with rocks to control water flow and create fish enclosures ().
Wetland health
Wetland health is indicated by the variety of plants and animals within them and the area that is inundated.
Natural rainfall and flooding events are beneficial for both coastal and inland wetland vegetation.
The present condition and extent of inland wetlands reflects more than a century of unsustainable land and water management practices (; ). The reduction in both health and area reduces the resilience of our wetlands to increasing climate extremes.
Many areas are losing their ecological function owing to increased pressures from cropping and grazing over the past century, and increased demands on water usage and the structures to meet them (; ; ). This means that they are no longer able to support the plants and animals that rely on them to survive.
An important resource for assessing trends is the Eastern Australian Waterbird Survey. The survey has been conducted since 1983. Information presented here is from the 2023 report ().
In October each year, 10 aerial surveys monitor up to 200 wetlands (; ). These surveys cover areas 30 kilometres (km) wide, at every 2 degrees of latitude across eastern Australia.
They cover all water bodies larger than 1 hectare (ha), including estuaries, coastal lakes, rivers, swamps, floodplain wetlands, saline lakes, dams, reservoirs and impoundments.
The inundated area has been decreasing since 1983. Only two of the last 10 years had inundation greater than the median value for the period (see Figure W1.5).
Figure W1.5: Inundated wetland area (h in eastern Australia, 1983–2023
Notes:
Total wetland area inundated (in hectares) in annual survey transects.
Data derive from annual aerial survey in 10 aerial survey bands in eastern Australia, 1983–2023.
The NSW DCCEEW’s Murray–Darling Basin Monitoring, Evaluation and Reporting program monitors inundation area in selected Murray–Darling Basin wetlands using satellite images. The wetlands monitored are the Gwydir Wetlands, Lowbidgee floodplain, Lower Lachlan Wetlands, Macquarie Marshes, Barmah–Millewa Forest and Narran Lakes.
The satellite imagery can provide information every five days. It complements information from the Eastern Australian Waterbird Survey by providing information throughout the year.
In 2022–23, more than 1 million hectares was inundated across these wetlands.
Wetland extent
Wetland extent has grown with significant additions to protected areas. A little over 12% of wetland is protected (see Table W1.5).
In 2021–24, 186,536ha of wetland was added to the combined public and private protected area system in NSW. This included 150,103ha reserved or acquired under the NSW National Parks and Wildlife Act 1974.
Many of these wetland additions, both coastal and inland, include areas listed in the Directory of Important Wetlands in Australia.
Inland wetlands
In 2021–24, inland wetland areas in the public and private protected area system in NSW increased by 186,162ha (see Table W1.5). This included 149,738ha reserved or acquired by the NSW National Parks and Wildlife Services (NPWS) for the reserve system in:
- Brindingabba National Park
- Culgoa National Park
- Doodle Comer Swamp Nature Reserve
- Paroo–Darling National Park
- Comeroo Station (recently acquired)
- Thurloo Downs Station (recently acquired).
Table W1.5: Extent of inland (west of the Great Dividing Range) wetland types and their inclusion in NSW protected areas in 2024
| Wetland type | Total area (ha) | % in protected areas (as at end of March 2024) | Protected area | Area in protected areas (ha) (June 2021) | Area in protected areas (ha) (March 2024) | Reserved or acquired from June 2021 to March 2024 |
|---|---|---|---|---|---|---|
| Floodplain wetland | 4,008,881 | 13% | NPWS reserves | 329,602 | 478,077 | A |
| Other | 7,296 | 42,974 | – | |||
| Freshwater lake | 296,071 | 8% | NPWS reserves | 21,205 | 22,434 | B |
| Other | 251 | 996 | – | |||
| Reservoir | 84,645 | 4% | NPWS reserves | 3,402 | 3,429 | – |
| Other | 16 | 18 | – | |||
| Saline wetland | 18,542 | 4% | NPWS reserves | 0 | 6 | – |
| Other | 745 | 751 | – | |||
| Total | 4,408,139 | 12% | NPWS reserves | 354,208 | 503,946 | – |
| Other | 8,219 | 44,733 | – |
Notes:
A: Brindingabba National Park, Culgoa National Park, Doodle Comer Swamp Nature Reserve*,Cuttaburra Nature Reserve, Thurloo Downs Station* (recently acquired).
B: Paroo–Darling National Park, Thurloo Downs Station*.
*NPWS acquired but not yet reserved (included in both protected area categories).
Other = public or private protected areas.
Protected areas = lands protected securely and in perpetuity.
Information on wetlands is available from DCCEEW n.d. and NPWS n.d.
Coastal wetlands
In 2021–24, coastal wetlands in the public and private protected area system in NSW increased by 374ha (see Table W1.6). This included 365ha reserved or acquired for the national park system in:
- Killalea Regional Park
- Lake Innes Nature Reserve
- Clybucca Aboriginal Area
- Yuraygir National Park
- Seven Mile Beach National Park.
Table W1.6: Extent of coastal (east of the Great Dividing Range) wetland types and their inclusion in NSW protected areas in 2024
| Wetland type | Total area (ha) | % in protected areas (as at end of March 2024) | Protected area | Area in protected areas (ha) (June 2021) | Area in protected areas (ha) (March 2024) | Reserved or acquired from June 2021 to March 2024 |
|---|---|---|---|---|---|---|
| Coastal lagoons and lakes | 66,589 | 28% | NPWS reserves | 18,775 | 18,796 | A |
| Other | 77 | 79 | – | |||
| Estuarine Wetland | 111,527 | 14% | NPWS reserves only | 14,918 | 15,210 | B |
| Other | 283 | 284 | – | |||
| Floodplain Wetland | 15,429 | 30% | NPWS reserves only | 4,546 | 4,595 | C |
| Other | 37 | 39 | – | |||
| Freshwater Lake | 2,095 | 11% | NPWS reserves only | 235 | 235 | – |
| Other | 5 | 5 | – | |||
| Reservoir | 38,098 | 2% | NPWS reserves only | 601 | 604 | – |
| Other | 6 | 9 | – | |||
| TOTAL | 233,738 | 17% | NPWS reserves only | 39,075 | 39,440 | – |
| Other | 407 | 416 | – |
Notes:
A: Killalea Regional Park, Lake Innes Nature Reserve, Clybucca Aboriginal Area*.B: Killalea Regional Park, Yuraygir National Park.
C: Seven Mile Beach National Park*.
*NPWS acquired but not yet reserved (included in both protected area categories).
Other = public or private protected areas.
Protected areas = lands protected securely and in perpetuity.
Wetland plants
Environmental flows provide benefits for wetlands, reduce the impact of dry and drought conditions and increase vegetation resilience to extreme climate or weather.
Murray–Darling Basin
Across the NSW Murray–Darling Basin, tree community conditions change in response to wet and dry periods. Different species reflect changes in wetland conditions over varying periods of time.
Non woody vegetation refers to wetlands with shrubs and grasses, including water couch marsh grassland or sedgeland. These plants respond quickly to changing conditions and reflect short-term weather conditions. Prolonged dry weather replaces these wetland species with grasses and shrubs that prefer drier conditions.
Woody vegetation refers to trees, including the coolabah and the river red gum. These species respond slowly to environmental conditions and reflect longer-term changes. Their deeper roots can support them during dry periods and drought.
See the topic for more information.
Floodplain vegetation condition has been assessed in the State’s inland water management areas (Map W1.4). The map shows conditions in 2023–24 and, where condition in 2020–21 is available, whether they have improved, stayed the same or declined ().
Woody vegetation has been assessed at 16 sites, four in the south of the basin (Murray, Murrumbidgee, Lachlan) and 12 in the north of the basin (Northern streams, Barwon–Darling, Border Rivers, Gwydir, Namoi, Macquarie). Eight of these had a previous assessment.
Non woody vegetation was assessed at 10 sites, five in each of the south and the north.
Woody vegetation was assessed as poor at 11 of the 16 sites. Four sites had the same assessment, three were worse and one was better.
Non woody vegetation had better overall condition than woody vegetation. Five of the 12 sites were assessed as poor. Three had the same assessment, three were worse and two were better.
The vegetation condition is markedly worse in the northern Murray–Darling Basin than in the south. For non woody vegetation, two of the seven in the north were assessed as good while all five in the south were good. For woody vegetation, 9 of the 12 in the north were poor while two in the south were poor and two were good.
Map W1.4: Community conditions of surveyed plant community types across the NSW inland water management areas
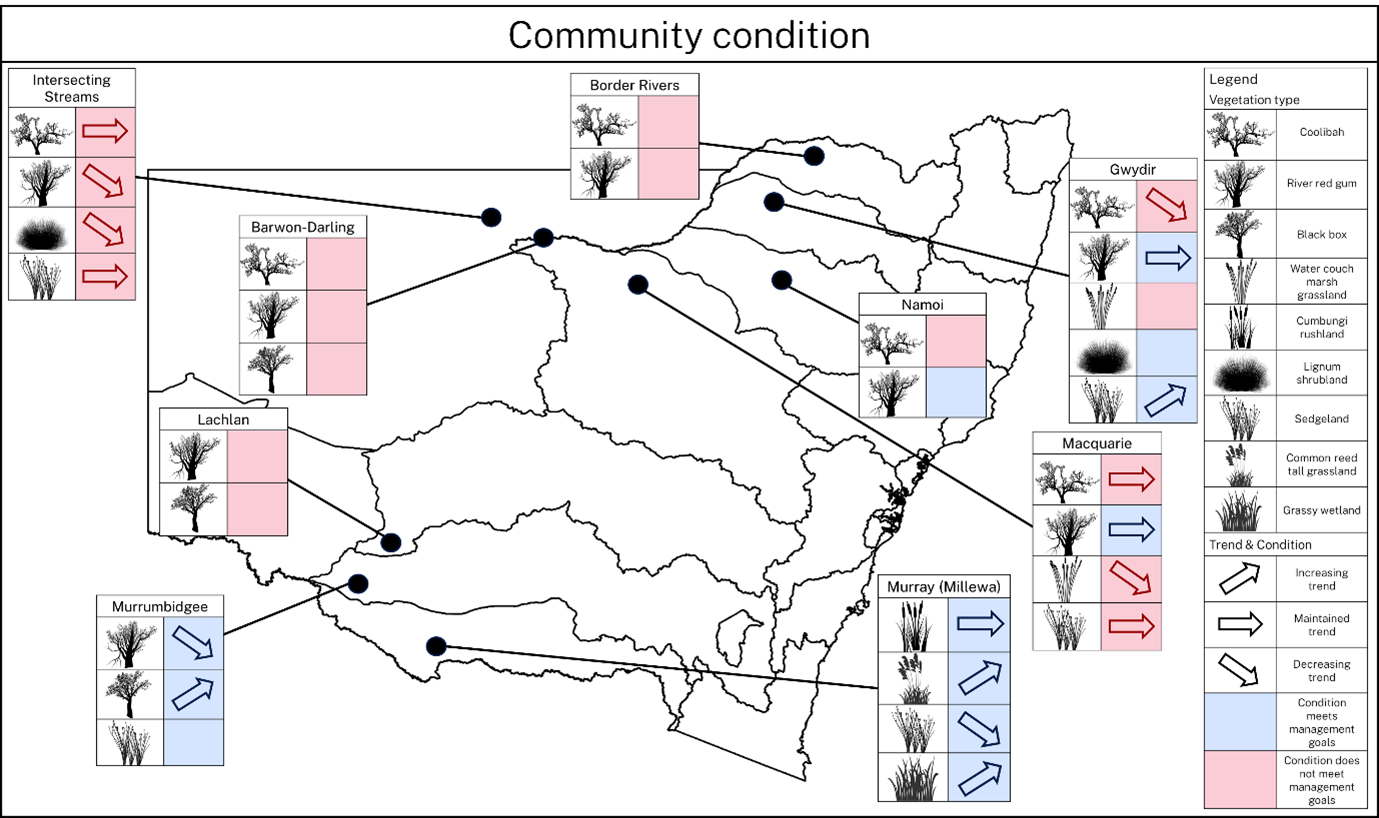
Notes:
Arrows indicate trends based on available data from 2020–21 to 2023–24. Absence of an arrow indicates data were available for only one of these years.
Colour indicates the most recently assessed community condition.
Pink: a condition of intermediate/poor or below does not meet the management goals.
Blue: a condition of intermediate or above does meet the management goals.
The viability of tree populations across the State establishes whether there are enough young trees to replace older trees as they die. If there are not enough young trees (called recruits), these populations are considered not viable.
Semi-arid eucalypts, including river red gum (Eucalyptus camaldulensis), coolabah (Eucalyptus Coolabah) and black box (Eucalyptus Largiflorens), are extremely long-lived, living from decades to centuries. If enough recruits survive to the first adult size class, then these populations will remain viable as long as their water needs are met.
Many communities appeared to have viable population structures but insufficient recruitment between 2021 and 2023 ().
See the DCCEEW website for more information on woody vegetation viability in NSW.
Coastal riparian areas
Coastal riparian vegetation is assessed by the Riparian Vegetation Condition Index, a component of the 2023 River Condition Index (). The index is a scale of 0 to 100 based on:
- structural type (woody or non woody)
- naturalness (native or non-native)
- landscape connectivity (fragmentation and patch size).
The index has a 5-point category: ‘very poor’ (0–20), ‘poor’ (21–40), ‘moderate’ (41–60), ‘good’ (61–80) ‘very good’ (81–100) (see Map W1.5).
Riparian (riverside) vegetation was generally better along the rivers and streams of the NSW South Coast and poorer in the northern areas around the Tweed, Brunswick and Richmond rivers and in the Coffs Harbour catchment.
Map W1.5: Riparian vegetation condition in coastal areas by Water Sharing Plan boundary areas
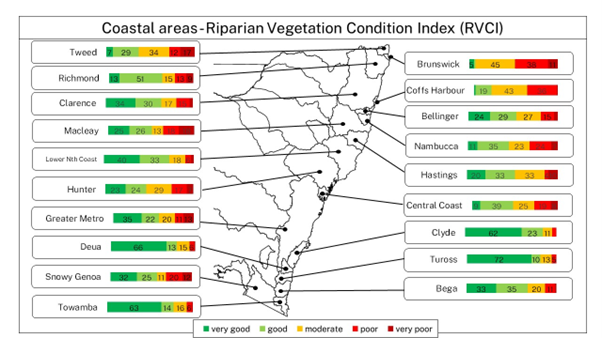
Notes:
Bar charts indicate the total area of each condition category within each boundary area, shown as a percentage of the total area.
While the index is effective at estimating and indicating condition at a statewide scale, it has limitations.
The scores do not reflect species composition, structural integrity, tree health or community condition. In addition, they are calculated only for a 30-metre-wide buffer zone on either side of streams and do not consider vegetation further away, even though it can contribute to river and wetland health.
See the topic for more information.
Wetland animals
Wetland health is shown by the abundance and diversity of its animals. Pressures adversely affecting a wetland’s overall function will be seen in changes to animal abundance.
Wetlands are rich in biodiversity. This report provides data on three representative wetland animal species: waterbirds, frogs and turtles.
Waterbirds
The Eastern Australian Waterbird Survey has revealed a long-term decline in waterbirds since 1983 ().
While the total waterbird abundance increased over the last three years, long-term trends indicate a decline overall.
Data on waterbirds collected by the survey include:
- abundance – total number of waterbirds
- breeding species diversity – number of breeding species
- breeding index – counts of nests and broods of breeding species.
Abundance
Total waterbird abundance increased from 162,824 waterbirds in 2020 to 579,641 in 2023 (see Figure W1.6). This is above the long-term median of 256,094 and is the 7th highest record in 41 years.
Long-term trends in total waterbird abundance and number of breeding species show a decline overall, notably in the abundance of ducks, herbivores, large wading birds and shorebirds ().
Figure W1.6: Waterbird abundance in eastern Australia, 1983–2023
Notes:
Abundance is the total number of waterbirds counted in the spring aerial surveys (100,000).
The long-term decline in waterbird abundance reflects the reduction in suitable inundated wetland habitat due to alteration of flows in regulated rivers in the Murray–Darling Basin ().
Availability of wetland habitat is a major driver of waterbird abundance, breeding and diversity. Reductions in habitat area and persistence due to climate change, river regulation and water extraction have resulted in long-term declines, particularly in the Murray–Darling Basin. Purchases and timed releases of environmental water to support breeding or habitat condition may offset some the impacts of regulation ().
Breeding species diversity and breeding index
Waterbird breeding species diversity and the breeding index were above the long-term median in spring 2023 but had significantly decreased from 2022, when large breeding events were recorded in the NSW Murray–Darling Basin (see Figures W1.7 and W1.8).
Figure W1.7: Waterbird breeding species diversity in eastern Australia, 1983–2023
Notes:
Species diversity is the number of species breeding counted in the spring aerial surveys.
The waterbird breeding index relates to the estimated number of nests and broods. (A brood is a family of chicks cared for at the same time.)
Figure W1.8: Waterbird breeding index in eastern Australia, 1983–2023
Notes:
Breeding index is the estimated number of nests or broods counted in hundreds of thousands in the spring aerial surveys.
Frogs
The presence of these species and their breeding activity have been monitored across three inland wetland regions from 2014 to 2022 (see Figure W1.9). The detection of flow-dependent frog species and breeding activity were stable over this period ().
Flow-dependent frog species are those known to breed in response to wetland filling, regardless of rainfall. Breeding activity includes male calling, egg masses, tadpoles and recently changed (metamorphosed) juvenile frogs.
In recent years, delivery of water for the environment to inland wetland systems has supported frog breeding by providing refuge habitat during dry times and enhancing inundation extent and duration at key sites during wetter periods.
One species that has benefited from widespread flooding in spring-summer 2016, 2021 and 2022, and delivery of water for the environment is the nationally vulnerable southern bell frog (Litoria raniformis). This species has expanded into new wetland sites in the Lachlan, Murrumbidgee and Murray catchments in recent years (; ; ).
The presence of these species and breeding activity have been monitored across three inland wetland regions from 2014 to 2022 (see Figure W1.9).
Figure W1.9: Proportion of surveyed sites that supported frog breeding activity, 2014–22

Notes:
Flow-dependent frog species: species known to breed in response to wetland filling, regardless of rainfall, and therefore of particular interest for environmental water management.
Breeding activity: includes male calling, egg masses, tadpoles and recently metamorphosed juvenile frogs.
Gwydir and Macquarie: collected through the NSW DCCEEW Biodiversity, Conservation and Science Group for the Water for the Environment program.
Lowbidgee data: collected by Charles Sturt University funded by the Commonwealth Environmental Water Holder Long-Term Intervention Monitoring and Flow Monitoring, Evaluation and Research programs.
NSW Long-Term Water Plans set out the ecological objectives and targets for flow-dependent frog species that were developed as part of the ‘Other species’ theme. Baselines for flow-dependent frog targets were developed using available data and expert opinion (DPE 2023).
Freshwater turtle populations
NSW has seven freshwater turtle species and one subspecies. Three of these are currently listed as threatened.
Freshwater turtles hold significant cultural, spiritual and ecological value for Aboriginal peoples. Turtles are deeply embedded in Aboriginal traditions such as Dreamtime stories, artworks, ceremonial practices and traditional food sources (). This is evident from the more extensive motifs of turtles in rock art than of other fauna.
The specific importance of freshwater turtles varies across different Aboriginal communities ().
Targeted, species-specific monitoring is undertaken by universities and partnerships between the NSW Government and freshwater turtle ecologists. The assessment of turtle species health draws upon recent conservation, advice documents, monitoring reports and scientific literature published within the last six years (see Table W1.7).
Freshwater turtle populations are unlikely to be subject to major fluctuations in abundance or distribution within short timeframes, because of their slow maturation, longevity, and high egg and hatchling mortality (; ).
The assessment of freshwater turtle populations in NSW uses four key metrics (; ; ):
- abundance status – graded as uncertain, moderate to high, low or rare
- abundance trend – graded as uncertain, stable, increasing or decreasing
- distribution status – graded as uncertain, widespread, fragmented or confined
- distribution trend – graded as uncertain, stable, increasing or decreasing.
The abundance status of seven of the species or subspecies is graded as moderate to high in most valleys (see Table W1.7). The critically endangered Bellinger River helmeted turtle is graded as rare, primarily owing to a rapid disease-related population crash in 2015 ().
The abundance trend of most species was either uncertain, owing to a lack of information, or decreasing, owing to a range of perceived threats, including fox predation, novel viruses and drought.
The distribution status of most species is widespread, with trends either uncertain or decreasing. The endangered Manning River helmeted turtle is graded as fragmented and uncertain. The endangered Bellinger River helmeted turtle is graded as confined but stable.
Table W1.7: Freshwater turtle population status before and during reporting period, 2024
| Turtle species | Relevant valleys | Abundance status; trend | Distribution status; trend | Confidence | Source(s) |
|---|---|---|---|---|---|
| Broad-shelled turtle (Chelodina expansa) | Northern NSW Murray–Darling Basin catchments | moderate to high; uncertain | widespread; uncertain | low | (1) |
| Southern NSW Murray–Darling Basin catchments | uncertain | uncertain | not applicable | not applicable | |
| Eastern long-necked turtle (Chelodina longicollis) | All NSW Murray–Darling Basin catchments | moderate to high; uncertain | widespread; uncertain | medium | (1), (2), (3) |
| All coastal NSW catchments | moderate to high; uncertain | widespread; uncertain | low | (2), (3) | |
| Murray River turtle (Emydura macquarii) | All NSW Murray–Darling Basin catchments | moderate to high; uncertain | widespread; uncertain | low | (1), (3) |
| Clarence | moderate to high; uncertain | widespread; uncertain | low | (6) | |
| Bellinger *Introduced | moderate to high and increasing | widespread; stable | medium | (6), (7), (8) | |
| Manning *Introduced | low abundance but increasing | confined but increasing | low | (6) | |
| Hunter | moderate to high and stable | widespread; stable | medium | (1), (4), (5) | |
| Sydney *Introduced | moderate to high; increasing | fragmented; uncertain | low | (9) | |
| Richmond, Tweed, Brunswick, Macleay, Hastings, Hawkesbury, Macquarie–Tuggerah Lakes, Wollongong coast | uncertain | uncertain | not applicable | not applicable | |
| Western sawshell turtle (Myuchelys bellii) *Endangered | NSW Border Rivers, Namoi, Gwydir | moderate to high; stable | widespread; stable | high | (1), (10), (11) |
| Bellinger River helmeted turtle (Myuchelys georgesi) *Critically endangered | Bellinger | rare; stable | confined; stable | high | (1), (7), (8), (12) |
| Common sawshell turtle (Myuchelys latisternum) | Richmond, Tweed, Brunswick | moderate to high; uncertain | widespread; uncertain | low | (1) |
| Manning River helmeted turtle (Myuchelys purvisi) *Endangered | Manning | moderate to high; uncertain | widespread; uncertain | medium | (1), (13) |
Threats to freshwater turtle populations
Freshwater turtle populations are under pressure from a combination of known and potential threats, including:
- dams, weirs and other built structures, which prevent movement up and down streams
- removal of large logs and other instream habitats
- trampling of nests by stock and predation of eggs by foxes
- reduced permanency of wetlands and water bodies through water extraction and climate change
- degradation of the riparian (riverside) zone and invasive weeds.
Some threats affect specific life stages. For example, predation or damage of turtle nests affects eggs and hatchlings. Drying of aquatic refuges because of drought and water extraction may affect all life stages.
Adult mortality is particularly concerning, as it takes many years for freshwater turtles to reach maturity and they have low rates of reproductive success. This makes the survival of mature adults extremely important for population persistence.
The likelihood and severity of threats may vary with time or location, with some risks more evident in specific areas (for example, road kills near development).
Most recorded turtle deaths reported by TurtleSAT between 2012 and 2023 were road kills of eastern long-neck turtles, particularly during the nesting season, when females seek nesting sites (), and around areas with significant development, such as Sydney.
Greater awareness and delivery of targeted conservation measures may reduce these threats. This is particularly important during specific times, such as nesting periods, and in certain locations.
Effective conservation efforts must also prioritise collaboration with Aboriginal peoples, incorporating their knowledge and perspectives to ensure the long-term protection of these culturally and ecologically important species ().
Pressures and impacts
Changes to river flows
The way that water flows in a river system (known as the river flow regime) plays an important role in creating and maintaining the physical habitat of river channels. These channels are being altered by regulation, extraction and climate change.
Installation of dams, weirs, diversion channels and offtakes allows us to move water within river systems for extraction by communities and industry. Such alteration of natural flow patterns can have significant impacts on the health of river, floodplain, wetland and estuarine ecosystems.
Changes to flow can affect the health of Country, including the health and wellbeing of Aboriginal peoples. Recent surveys of Aboriginal communities in Western NSW revealed that loss of river connectivity and access to water significantly harms their mental and physical health ().
Decreasing the volume of water flowing down rivers can harm the function of rivers and wetlands, favour invasive species such as carp, and reduce native plant, fish and waterbird numbers by:
- reducing water levels
- changing the transport of sediments and nutrients
- reducing the connectivity of the river with floodplains and wetlands.
It can also change the composition of these communities, increasing vulnerability and making species more susceptible to climate change and invasive species (; ).
Waterway infrastructure
Built structures, such as dams and weirs, present a physical barrier that prevents the safe migration of many fish up and down river systems and the flow of sediments downstream.
All Australian native fish need to migrate to spawn, seek food and shelter, and avoid predators and other threats, such as poor water quality and drying habitats.
The ability of native fish to migrate in NSW has been significantly constrained by the construction of more than 300 dams and weirs that help manage the State’s water resources.
As barriers to fish, these structures have contributed to a 90% decline in native fish populations since colonisation. Without specific, targeted intervention to restore fish passage, native fish populations will continue to decline towards extinction.
Dams permit cold water pollution, which has significant ecological, social, cultural and economic consequences. Cold water pollution occurs when the bottom cold layer of water from large, stratified (layered) storage dams is released downstream, resulting in detrimental effects over distances of up to 400 kilometres. The artificial drop in water temperature can disrupt the natural thermal regime that many aquatic species rely on for reproduction, feeding and growth.
This disruption can lead to reduced recruitment (breeding) and survival rates of fish and macroinvertebrates, ultimately harming biodiversity and the health of aquatic ecosystems (). These can have flow-on effects for local communities that depend on these ecosystems for cultural practices, recreation and economic activities, such as fishing.
Native fish may also be drawn into water pumps and diverted into channels, becoming injured or killed.
In the NSW part of the Murray–Darling Basin alone, more than 450 water pumps are operated for irrigation. This operation could lead to tens of millions of native fish being harmed by water extraction practices annually – estimated at 3.5 native fish per megalitre of water extracted ().
Catchment development
The development of catchments for urban and agricultural land use reduces wetland extent and changes the quality of surface water runoff that enters rivers and wetlands.
This has affected native fish populations throughout the freshwater environments of NSW. Nearly two-thirds of species and populations are listed as threatened under State or Commonwealth legislation.
Land clearing
Riparian (riverside) and aquatic habitats of NSW have suffered serious declines in quality and quantity since colonisation.
Reductions in areas of vegetation and native groundcover reduce water infiltration, increase runoff and increase soil erosion. The resulting larger volumes of sediment entering waterways reduces water quality. This is particularly an issue where clearing of riparian vegetation leads to:
- widening of river channels
- erosion at the headwaters of a stream
- increased sediment loads, which can smother aquatic habitats () and accelerate infilling of deep waterholes in rivers ().
Riparian land acts as the last line of defence for waterways, helping to stabilise banks, improve water quality, drive food webs and provide habitat. Protecting riparian vegetation is vital to support healthy population structures of native fish and for the recovery of threatened aquatic species.
Clearing for developments such as cropping, intensive agriculture and housing leads to a deterioration of water quality in rivers.
Livestock can disrupt wetland ecosystems when they are not constrained. The destruction of plants can increase erosion and interrupt the life cycles of aquatic animals.
Modification of water flow via levees and channels has major impacts on wetland extent and condition. See Changes to river flows above for more information.
Pollutants
The use of fertilisers, herbicides and insecticides in intensive agriculture has increased the loads of nutrients entering rivers and wetland areas. This can result in algal blooms, which can smother native macrophyte (large plant) and aquatic invertebrate communities.
Urban development has increased the concentrations of nutrients in rivers and wetlands. This is predominantly due to the release by sewage treatment plants of large volumes of water into rivers, and to high concentrations of heavy metals and chemicals in urban runoff.
Surface waters may also be contaminated with human-made chemicals. A notable example is the presence PFAS (per- and poly-fluoroalkyl substances) in some rivers and reservoirs. PFAS are particularly resistant to heat and chemicals. They have been widely used in fire-fighting foams and as waterproofing and stain protection in fabrics. Their chemical resistance means they persist in the environment for a long time. More information regarding these chemicals is available on the EPA website.
Invasive species
Invasive plants and animals put pressure on native populations, competing for resources and space.
Wetland degradation facilitates the establishment and spread of weed and pest species.
Weed species may compromise wetland biodiversity and habitat value, ecosystem function and water quality. Significant wetland weeds include Lippia, Salvinia and water hyacinth (; ).
Introduced domestic and feral animals may compete with, or prey upon, native wetland animals. These include foxes, goats and pigs. They can also reduce water quality and plant biomass and increase sedimentation and water turbidity (murkiness).
Introduced fish are a significant issue within NSW waterways, preying on fish and frog eggs, tadpoles and juvenile fish, and fundamentally altering food webs and habitats.
Common carp can exacerbate erosion in rivers when feeding near cleared banks in large numbers. They have become one of the dominant fish species and are found throughout most of the Murray–Darling Basin. Their abundance and biomass fluctuate widely, possibly in relation to recruitment waves associated with flood conditions.
Climate change
Increasing temperatures associated with climate change are exacerbating existing pressures on rivers and wetlands, changing water flows and harming catchment and riparian conditions.
Recent projections by the NSW Government indicate a warmer future, with an increase in mean temperature, potentially exceeding 4°C during this century under a high-emissions scenario ().
Increased temperatures will lead to increased evapotranspiration and demand by industry, reducing the availability and flow of water in rivers.
Uncertainty remains around the impact of climate change on rainfall patterns (). Projections suggest that NSW may experience overall reductions in precipitation.
Reduced water availability will mean that the flows that support ecosystems will be less likely to occur. Water for the environment is particularly important in supporting ecosystems when water availability is low.
Changes in water flow durations can affect the life cycle and distribution of many water-dependent species.
Changes in water availability affect the wetland inundation patterns that support vegetation. These may cause significant contraction of inland wetlands and change their ecological functions.
Reduced streamflow is expected to reduce habitat quality and quantity, limit interconnectivity, and limit movement of fish to seek out suitable habitat and spawn.
Coastal freshwater wetlands that rely on rainfall are also likely to be harmed by climate change under the projected drier conditions.
Estuaries will be further affected by projected sea level rise, which will alter tidal ranges and salinity distribution (), and by increases in sea surface temperatures. Possible impacts include:
- local collapse of fish populations
- declines in species distribution (as survival of species in their original ranges depends on their ability to migrate throughout river systems to maintain genetic diversity)
- disrupted breeding cues (especially from increases in water temperatures)
- altered competition and symbiotic relationships
- spread of disease
- altered fitness of fish across all life stages.
Understanding the climate change risks and impacts for aquatic animals, such as native fish, waterbirds, frogs and turtles, and their habitats will help support the development of appropriate adaptation and management actions.
This will increase resilience in populations and guide management actions. Actions such as relaxing constraints to ensure that water for the environment can be delivered when and where it is needed are crucial.
See the topic for more information.
Extreme climate and weather
Drought
The Australian landscape is adapted to natural drought conditions, with many species’ life cycles relying on natural variability in river flows.
However, prolonged or severe drought causes major disturbance to rivers and wetlands, reducing water availability for vegetation and refuge habitats for animals, and compounding the impacts on already stressed aquatic ecosystems.
Where the combined effects of drought conditions and water extraction build up over extended periods, they may exceed critical thresholds in the life cycles of some aquatic species. This threatens the resilience and recovery of populations of aquatic animals such as fish, frogs and birds.
Long-term changes to river conditions have already reduced native fish and waterbird populations, making them less resilient to further changes, such as those imposed by the decade-long Millennium Drought of the 2000s.
These changes to river conditions will also affect vegetation populations. Assessment of the viability of woody vegetation communities in the lower Namoi and lower Gwydir found too few juvenile trees ().
Large areas of NSW faced severe water shortages owing to drought from 2017 to early 2020, although since then, there has been a series of La Niña years that were wetter than average.
Water shortages are projected to become more frequent and severe as our climate changes ().
Bushfires
After a bushfire, ash, burnt material, soil and organic matter are washed into waterways. The impact on water quality can occur straight away and may persist for years after the fire. The severity of impacts varies depending on catchment conditions and rainfall intensity.
Materials washed into rivers and streams can change water chemistry, harming aquatic animals, such as fish and platypus, while also compromising town water supplies.
Fire affects other components of river condition for many years through changing habitat, removing plants along riverbanks, which allows more erosion, altering the shape of the river and reducing biodiversity.
Since the NSW bushfires in 2019–20, research has been undertaken into the impacts of bushfires on freshwater ecosystems and potential water management options (PDF 3.6MB).
See the topic for more information.
Responses
Licensing and regulation
The NSW Government has implemented and improved water licensing and regulatory measures since the NSW State of the Environment 2021. These measures are intended to improve water sharing equity between users and water for the environment.
Floodplain harvesting
Floodplain harvesting activities, such as the unlicensed taking of water from floodplain runoff, were integrated into the water licensing framework.
Licensing limits now provide regulatory certainty for users and regulate the take of water and the development of water storage infrastructure on floodplains in NSW. This ensures that water resources are now measured and managed within appropriate rules and limits.
Licensing and measurement of floodplain harvesting will return significant volumes of water to floodplains, rivers and creeks. The additional floodplain flows will benefit waterbirds, native fish and vegetation, particularly in the internationally recognised Gwydir Wetlands.
See the Licensing floodplain harvesting website for more information.
Long-term water strategies
NSW Water Strategy
The NSW Government has established the NSW Water Strategy, which outlines a plan to achieve sustainable water resources for people, places and ecosystems. The plan states seven priorities:
- Priority 1: Build community confidence and capacity through engagement, transparency and accountability.
- Priority 2: Recognise Aboriginal peoples’ rights and values and increase access to and ownership of water for cultural and economic purposes.
- Priority 3: Improve river, floodplain and aquifer ecosystem health and system connectivity.
- Priority 4: Increase resilience to changes in water availability.
- Priority 5: Support economic growth and resilient industries within a capped system.
- Priority 6: Support resilient, prosperous and liveable cities and towns.
- Priority 7: Enable a future-focused, capable and innovative water sector.
The 2021–22 Annual Progress Report on Water Strategy Implementation reports that of the 123 actions in the 2021–22 NSW Water Strategy Implementation Plan:
- 55% were complete or ongoing (have no end date)
- 26% were in progress with a revised timeline
- 15% were in progress
- 2% had closed
- 2% had not started.
The 2022–23 Annual Report Progress on Water Strategy Implementation updates progress but does not provide a progress summary.
The 2021–22 NSW Water Strategy Implementation Plan builds on the progress made since 2021 and identifies 42 actions to be taken over the next 2 years.
The first formal review of the NSW Water Strategy is due in 2026.
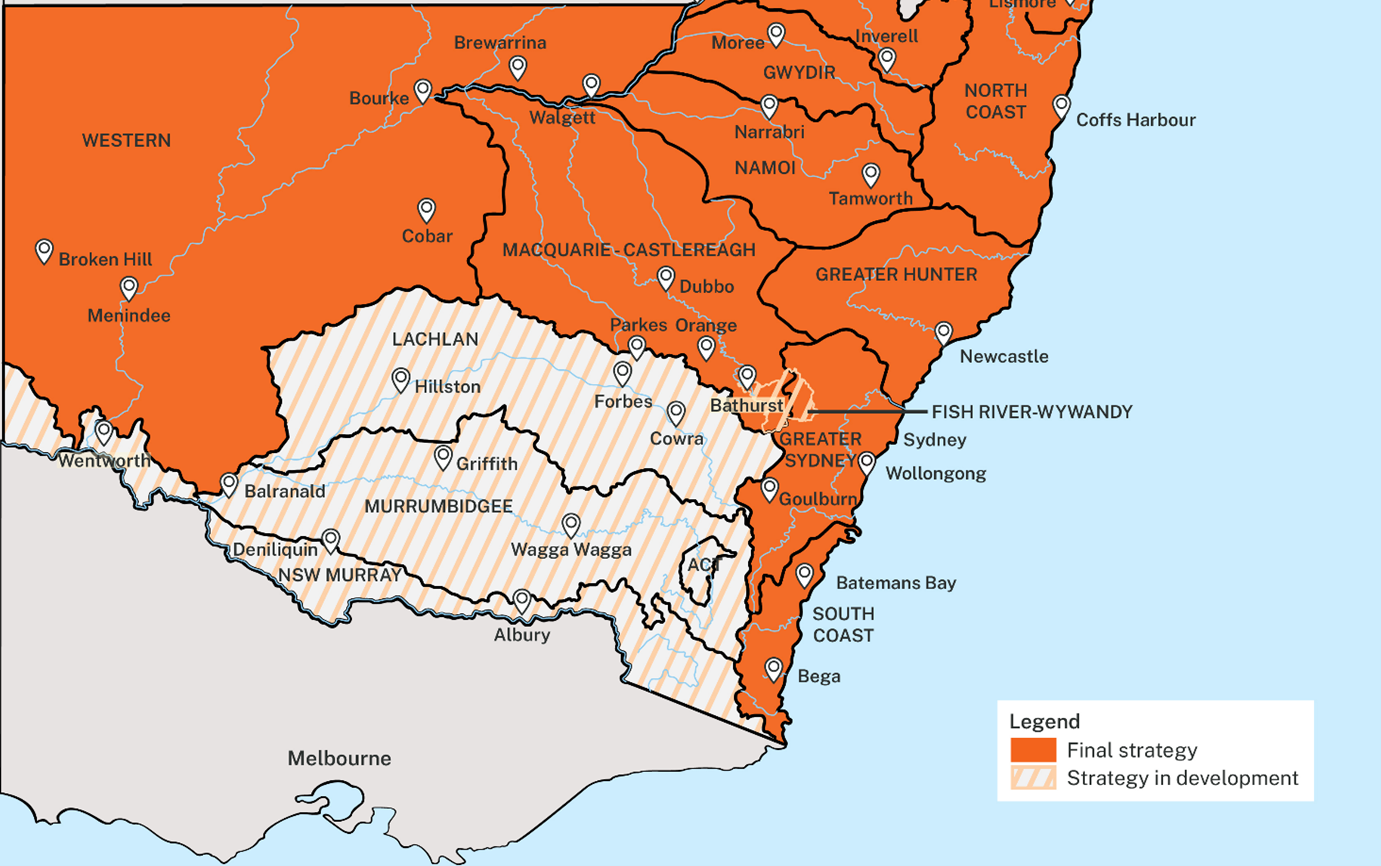
Regional and metropolitan water strategies
Regional and metropolitan water strategies work alongside the NSW Water Strategy to help prepare specific regions for a changing climate.
Most of these strategies have been finalised and are now being implemented (see Map W1.6). The final four regional water strategies are currently under development ().
Map W1.6: Regional and metropolitan water strategy program status as of 2023
Working with Aboriginal peoples
Aboriginal Water Program
The Aboriginal Water Program encapsulates how the NSW DCCEEW is embedding Aboriginal peoples in the planning and management of water in NSW.
NSW Aboriginal Water Strategy
The NSW Government is working with Aboriginal peoples to develop and implement a NSW Aboriginal Water Strategy to address the NSW Water Strategy Priority 2.
The strategy identifies opportunities to increase Aboriginal water rights and ensure that Aboriginal peoples are empowered to contribute to water management and planning decisions.
The strategy is underpinned by six principles relating to water that Aboriginal peoples identified as important:
- culture – water is central to Aboriginal culture and practices
- health and wellbeing
- caring for Country
- meaningful engagement
- economic benefit
- shared cultural and environmental benefits.
Cultural Watering Plans
Cultural Watering Plans aim to increase Aboriginal ownership of water for cultural and economic purposes.
The NSW Government will create an environment of two-way knowledge sharing. It will also investigate barriers to using Aboriginal Cultural Specific Purpose Access Licences and promote awareness of existing water access avenues.
Other NSW Government programs
The NSW Government is working with Aboriginal peoples to apply the processes developed in A Pathway to Cultural Flows in Australia.
Existing government strategies provide the principles and commitments for effective engagement and shared decision making, including:
- the Australian Government’s Closing the Gap
- the NSW Government’s OCHRE Plan
- the NSW Government’s Aboriginal Outcomes Strategy 2022–25.
Incident response programs
The Aboriginal Lands Flood Recovery Program provides support to managers of Aboriginal land in recovering from the 2022 floods through clean-up and restoration works. Assistance is currently being provided to three Local Aboriginal Land Councils in the Central West and the Riverina.
A joint Darling–Baaka water quality monitoring program commenced in mid-2023 following floods and the mass fish deaths in Menindee. The Program will run until June 2025 in three local government areas in partnership with the NSW DCCEEW and the Barkandji Native Title Group Aboriginal Corporation. The NSW Government’s full response to the Office of the Chief Scientist and Engineer’s review of this incident is available.
See the Environmental incidents section below for more information.
Environmental water
Water for the environment
Water that is allocated and managed specifically to improve the health of rivers, wetlands and floodplains is known as water for the environment.
Water for the environment is allocated to allow plants and animals to feed, breed, grow and remain resilient.
Over the past three years, water for the environment has been managed to restore a more natural flow regime in the regulated catchments of the NSW portion of the Murray–Darling Basin. This includes the Gwydir, Macquarie, Lachlan, Murrumbidgee and Murray rivers. The more natural flows have supported the waterbirds of large floodplain wetlands to breed during wet periods.
These flows enable fish to move up and down the rivers, inundate feeding habitat, and provide refuge habitat during dry periods for other wetland-dependent species, such as frogs and freshwater turtles.
Water for the environment is especially important during dry periods as it is often the only water available to plants and animals.
As part of the NSW Water for the Environment Program, the DCCEEW Biodiversity, Conservation and Science Group continues long-term monitoring of the priority indicators of wetland health related to environmental flow requirements: inundation patterns, vegetation, waterbirds and frogs.
Trends in environmental outcomes are assessed to evaluate the progress towards the targets of indicator objectives outlined in the NSW Long-Term Water Plans. The Murray–Darling Basin Plan requires reporting on ecological outcomes every five years. The most recent was released in October 2024. These reports are available on the Murray–Darling Basin Authority website.
Since 2020–21, water for the environment has been extended to other river catchments in the NSW portion of the Murray–Darling Basin: Lower Darling–Baaka, Namoi, Barwon–Darling and intersecting streams.
Outside of the Murray–Darling Basin, water for the environment is managed in the Snowy River and Hunter River catchments.
When implementing environmental flows, it is important to consider the cultural values of waterways ().
Although there is extensive Aboriginal knowledge of environmental flows, it has been largely overlooked. This can lead to unintended harms to cultural heritage, such as disturbing sacred sites or harming culturally significant species ().
In contrast, cultural water flows recognise the intricate relationship between people and Country, often involving precise timing and location of water delivery. Protection of culture requires that these considerations be included in managing environmental flows.
Reconnecting River Country Program
The Reconnecting River Country Program proposes to enable more flexible use of water for the environment and to increase the frequency and extent of inundation connecting rivers to their wetlands and floodplains. It works with Aboriginal peoples, landholders, public land managers and local communities.
Gwydir Reconnecting Watercourse Country Program
The Gwydir Reconnecting Watercourse Country Program seeks to increase the effectiveness of environmental water deliveries by working with watercourse landholders, water licence holders and the broader community to establish water corridors.
The program has three project areas:
- Gingham Watercourse
- Lower Gwydir Watercourse
- Lower Mehi River.
It is funded through the Northern Basin Toolkit and is currently in implementation phase.
Saving our Species program
The Saving our Species program develops conservation strategies for all threatened species and ecological communities in NSW. The strategies identify the critical threats affecting each target’s viability and the actions needed to secure them in the long term.
Alteration to the natural flow regimes of rivers, streams, floodplains and wetlands has been identified as a critical threat to 29 plants, 22 animals and 12 threatened ecological communities. Of these, 35 are currently under management through the Saving our Species program ().
Improving water quality
NSW Water Quality Governance Roadmap
The NSW Water Quality Governance Roadmap identifies initiatives to support continual improvement of water quality governance and broader reforms to it.
The development of the roadmap included research into arrangements and frameworks for water quality management and monitoring across NSW to better understand the challenges and opportunities for improvement. The research focused on better understanding of the regulatory framework and policy context, roles and responsibilities and existing programs.
Recognising the challenges of shared management of water quality across NSW, the roadmap presents a pathway for better integrating the management of land, water and natural resources in NSW to improve water quality management.
NSW Water Quality Monitoring Framework
The water quality framework project is a 12-month initiative to develop and implement a statewide system for collecting, managing, sharing, and accessing water quality data across government agencies.
The project aims to address the gaps and challenges identified by the Office of the Chief Scientist and Engineer’s report on fish deaths, and improve the environmental outcomes and public awareness of water quality issues. It involves collaboration and consultation with key stakeholders and will use existing tools and platforms, such as SEED and Water Insights.
Diffuse source water pollution governance framework
The Diffuse source water pollution governance framework will allow NSW Government agencies to work together to improve water quality by clarifying roles and responsibilities of each agency, and identifying strategies for managing pollution.
Improving river and catchment habitats
Fish passage and screening improvements
The NSW Fish Passage Strategy, developed in 2018, sets out a coordinated, 20-year plan to restore and improve native fish access to critical mainstem river and off-channel habitats below all major storage dams in NSW.
Since it started, it has helped attract more than $184 million in funding for fish passage amendments at more than 50 barriers.
Over the past three years, fishways have been constructed at four high-priority sites in NSW:
- Homestead Weir on the Warrego River
- Boera Weir on the Warrego River
- Walgett Weir on the Barwon River
- Seaham Weir on the Williams River in the Hunter catchment.
These significant works have reinstated fish passage to more than 360km of upstream habitat and have been complemented by smaller works at other structures, such as causeways, crossings and smaller weirs.
In NSW, modern fish-protection screens are being installed at pumping sites across more than 120km of waterway along the Macquarie, Mehi and Barwon rivers.
A total of 52 pumps have been upgraded complementing other efforts over recent years. Installation started in early 2024 and is expected to continue into 2026.
Screening these sites is projected to protect 252,000 native fish annually and deliver up to 800 million litres per day of cleaner water.
Habitat mapping
In the past three years, the NSW DPIRD has mapped 1,317km of stream length and 14,524ha of riparian area in the:
- Lachlan River
- Murrumbidgee River
- Capertee River
- Turon River
- Darling River
- Dungowan Creek
- Billabong Creek.
The mapping establishes baseline measurements for the physical features related to the needs of aquatic species and river management. Future remapping will show trends and guide rehabilitation priorities.
Mapping data were used to identify relationships between river flow height and habitat availability to inform water management decisions and flow hydrograph design.
This builds on previous mapping, bringing the total to 6,558km of stream length and 66,934ha within riparian zones (see Map W1.7).
As at 2023, 3.69% of the NSW total area has been mapped.
Map W1.7 Total area of mapped aquatic and riparian habitats since 2009
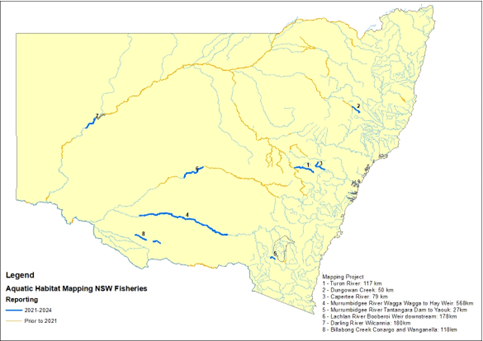
Local Land Services Natural Resource Management Framework
The Natural Resource Management Framework 2021–26 sets statewide priorities for Local Land Services (LLS) planning and programs. Objective 3 of the framework is to act on the top threats to the health and resilience of NSW landscapes and catchments.
One of the expected outcomes is that waterways and riparian zones will be rehabilitated in high-priority catchment areas. Projects include:
- the Hexham Swamp Rehabilitation Project (PDF 0.44MB)
- the Ramsar Wetlands Project
- the Restoring Clybucca Tidal Wetlands Project (PDF 0.85MB).
LLS support the rehabilitation and protection of wetlands and waterways by providing advice to landholders on:
- revegetating around waterways
- managing riverbank and gully erosion
- stock exclusion
- delivery of on-ground projects.
See the LLS website for more information.
NSW Recreational Fishing Trust Habitat Action Grant Program
During the current reporting timeframe, more than 90 projects have been undertaken by local governments and community supported by the Recreational Fishing Trust to protect and rehabilitate fish habitats.
Over 96,000 plantings covering an area of 115.8ha and 59.2km of riparian corridors and foreshores were completed. 139.3ha of weed control was undertaken extending along over 98km of riparian frontage and 2,300 metres of erosion control was undertaken. Instream, 100 large woody habitat (snags) and eight rock structures were reinstated, 42 fish hotels/engineered log jams were installed, and two barriers were removed opening up 29km of fish passage.
Aquatic habitat mapping
The Aquatic Habitat Mapping Program:
- develops riverine mapping projects to identify instream and riparian habitats
- provides information to assess environmental impacts
- introduces restoration and rehabilitation actions to improve aquatic environments and manage river flows.
Breeding threatened species
The Department of Primary Industries and Rural Development (DPIRD) is involved in many research, conservation management and habitat restoration projects to support threatened species. This includes captive breeding and release. See the list of current threatened species projects on the DPIRD website.
Between 2020 and 2023, 13 threatened fish species were bred in captivity. More than 375,000 fish were released into suitable habitats in rivers and streams.
Weed management
In NSW weed management is prioritised based on risk as evaluated through the NSW Weed Risk Management system.
The risk for each weed is assessed based on the potential impacts if it becomes more established or more widespread.
Weeds that are considered a State biosecurity risk are managed using instruments such as Control Orders and Biosecurity Zones under the Biosecurity Act 2015 and the Biosecurity Regulation 2017 – Weeds.
These include, rubber vine (Cryptostegia grandiflora) and mouse-ear hawkweed (Pilosella officinarum), both listed as Prohibited Matter under the Biosecurity Act 2015. Both are on track for eradication in NSW by the DPIRD.
The Regional Strategic Weed Management Plans also use risk to prioritise weed management in the 11 Local Land Services (LLS) regions.
The plans play a critical role in the early detection and eradication of priority weed species and the containment and management of those that are more widespread.
They list 64 weed species that have been assessed as regional priority weeds for conservation and environmental land use areas in NSW.
Of these,13 are managed with the goal of preventing their spread in at least one LLS region. These include weeds such as leaf cactus (Pereskia aculeata) and horsetails (Equisetum spp.).
A further 38 regional weed species are being managed with the goal of eradication in at least one region. These include a wide range of priority species, such as:
- bridal creeper (Asparagus asparagoides)
- Hudson pear (Cylindropuntia pallida)
- sea spurge (Euphorbia paralias).
Another 34 species are managed for containment and asset protection in at least one LLS region.
These include opuntioid cacti, such as the prickly pears (Opuntioid spp.), and Hudson pear (Cylindropuntia pallida), which are being managed successfully through biocontrol programs and targeted on ground management ().
Other widespread species, including blackberry (Rubus fruticosus species aggregate), Lantana camara and serrated tussock (Nassella trichotoma), are managed using an asset protection approach through programs such as Saving our Species, which manage weeds and other threats to native species holistically. These programs aim to reduce weed impact at specific affected locations ().
LLS supports rural landholders to fulfil their responsibilities to manage weeds in accordance with Australian and NSW biosecurity legislation and Regional Strategic Weed Management Plans.
For example, from 2021 to 2024, LLS helped manage weeds on 141,100ha of private rural land for improved biosecurity, agricultural productivity and biodiversity.
Invasive species
Carp
Released in 2022, the National Carp Control Plan uses a virus to kill introduced carp. Scientists are determining if the virus is safe, effective and feasible so it can be released in waterways where carp live.
Environmental incidents
Fish kill responses
The extent and severity of mass fish deaths across NSW have increased over the past five years.
In 2023, the NSW Government released the 30-year Native Fish Recovery Strategy. The strategy identifies four key outcomes:
- Recovery and persistence of native fish
- Identification and mitigation of threats to native fish
- Active involvement of communities in native fish recovery
- Informing of recovery actions by best available knowledge.
This work is undertaken by recovery coordinators in ‘recovery reaches’.
The Office of the Chief Scientist and Engineer undertook an independent review following the mass fish death event in the Lower Darling–Baaka during March 2023.
The review makes four major recommendations, each with multiple sub-components (24 recommendations in total):
- Recommendation 1: Regulatory environmental protections must be enforced.
- Recommendation 2: Obtain better data to support better decisions.
- Recommendation 3: Effective emergency management.
- Recommendation 4: Interventions to mitigate against future mass fish deaths.
The NSW Government released an initial response in November 2023. The final response was released in June 2024. See the NSW Government Response to Menindee 2023 Fish Deaths (PDF 13.9MB) for more information.
The initial response committed the NSW Government to 10 immediate, on-ground actions that were under way or were planned to be completed during the 2023–24 summer. These actions are intended to mitigate the risk of further fish deaths at Menindee and in the Lower Darling–Baaka during peak summer, and include:
- managing flows from the Menindee Lakes to maintain sufficient dissolved oxygen levels for fish
- appointing a Menindee-based Senior Water Implementation Officer to improve local communication
- upgrading water quality monitoring
- undertaking surveys to estimate fish numbers
- scoping options to allow fish passage and enhance river connectivity
- developing an interim Mass Fish Death Sub-Plan to respond to mass fish deaths at Menindee.
The NSW Government continues to work on reducing the risk of further mass fish deaths at Menindee. It is developing initiatives to improve water quality and fish health in the Barwon–Darling catchment and enhancing its emergency response and communication capabilities.
Flood recovery programs
The NSW EPA led flood recovery programs following intense flooding across the State in 2022 and 2023. A range of agencies and contractors carried out the programs.
The programs included:
- a land-based clean-up program that removed 150 tonnes of large and hazardous flood debris from 835 sites across 41 local government areas
- partnering with the Barkandji Native Title Group Aboriginal Corporation and NSW DCCEEW to monitor water quality and river health in the Darling–Baaka from mid-2023 following floods and the fish kill
- additional projects for agricultural chemical clean-up, contaminated land assessments and clearing illegal waste dumps and flood waste
- extensive water quality monitoring under the East Coast flood project.
Future opportunities
The NSW Fish Passage Strategy will significantly enhance the ability of native fish to reach key habitat. Additional infrastructure management actions are needed to mitigate cold water pollution downstream of impoundments, and to protect fish from pumps and diversion channels. A statewide strategy to mitigate cold water pollution is being revised and a strategy for diversion screening is being developed.
A more holistic approach is needed in water management, incorporating cultural values and the wellbeing of Aboriginal peoples in addition to ecological outcomes (). This requires a deep understanding of the complex relationship between Aboriginal cultures and water values ().
Research and collaboration with Aboriginal communities are essential to understanding the cultural values associated with water and to determining the specific water requirements needed to uphold these values (). Through a focus on Aboriginal knowledges and practices, it is possible to develop water management strategies that benefit both ecosystems and communities.
Cultural flows recognise the unique water rights and management systems of Aboriginal peoples. These flows are dedicated to supporting cultural, spiritual and economic benefits for Aboriginal communities (). Implementing cultural flows requires meaningful partnerships between Aboriginal groups, government agencies and water managers to place Aboriginal voices central to decision-making ().
References
Bowen S, O’Hea Miller S, Helfensdorfer A, Van Den Broek J, Roberts I, Cox B, et al. (in press), Water-dependent native vegetation, Environmental Outcomes Monitoring and Research Program Technical Report 2021–2024, NSW Water, Sydney
Chessman BC 2024a, Personal Communication – 4 May 2024, advice from DCCEEW-Water Group representatives
DCCEEW 2024c, NSW Basin Plan Matter 8 Report 2024, NSW Department of Climate Change, Energy, Environment and Water, Sydney, ISSN 978-1-76058-796-3
DCCEEW 2024d, Evaluation of flow-dependent frog objectives and targets: Technical report supporting the NSW Basin Plan Matter 8 Reporting 2019–24 (draft), NSW Department of Climate Change, Energy, the Environment and Water, Sydney
Waudby HP, Amos C, Healy S, Dyer J, McGrath N, Maguire J, Conallin A & Childs P 2020, Saving the Southern Bell Frog (Litoria raniformis): 2018–19 monitoring report, NSW Department of Planning, Industry and Environment, Albury, NSW (internal report)
Waudby HP, Healy S, Dyer J, Amos C, Maguire J, Conallin A & Childs P 2021, Saving the Southern Bell Frog (Litoria raniformis): 2019–20 monitoring report, NSW Department of Planning, Industry and Environment, Albury, NSW (internal report)
Waudby HP, McGrath N & Lenehan J 2022, Evaluating the distribution of the threatened southern bell frog (Litoria raniformis) in the Lower Lachlan, NSW Department of Planning and Environment, Albury, NSW (internal report)