Summary
NSW air quality is generally good or very good and consistently complies with national air quality standards for carbon monoxide, nitrogen dioxide, lead and sulfur dioxide. Levels of fine particle pollution and ozone continue to be of concern.
Fine particles are invisible to the naked eye and can be inhaled into the lungs. PM10 is particulate matter 10 micrometers or less in diameter and includes PM2.5. PM2.5 is particulate matter 2.5 micrometers or less in diameter. Particle pollution generally meets national air quality standards in Sydney, except when natural events such as bushfires or dust storms occur, or hazard reduction burning is conducted. Between 2015 and 2017, particle concentrations exceeded the national air quality standards on up to 20 days a year in Sydney, and up to 16 days a year in regional areas of NSW monitored under the Rural Air Quality Monitoring Network (Albury, Bathurst, Tamworth and Wagga Wagga North).
There is growing evidence about the adverse health impacts of airborne particles so in 2016 national air quality standards were strengthened to address this issue. Australia now has the most stringent PM2.5 standards, offering the best health protection in the world.
Between 2015 and 2017, concentrations of ground-level ozone, a key component of photochemical smog, exceeded national air quality standards in Sydney on up to nine days a year. Emissions of nitrogen oxides and volatile organic compounds are the main precursors of ozone and include emissions from industrial facilities, power stations and motor vehicle exhaust. To help reduce these emissions, the NSW Government has introduced strategies such as the Vapour Recovery Program to reduce petrol emissions from service stations.
Nitrogen dioxide and sulfur dioxide levels are usually 25–75% lower (better) than the national air quality standards.
The NSW Government has delivered a range of programs to further improve air quality in NSW, including the Dust Stop program, which reduces dust from coal mines, and the Wood Smoke Reduction Program, which helps to reduce smoke from domestic wood heaters.
Related topics: Climate Change | Energy Consumption | Greenhouse Gas Emissions | Transport
NSW indicators
| Indicator and status | Environmental trend |
Information reliability |
|
|---|---|---|---|
| Concentrations of ozone |
|
Stable | ✔✔✔ |
| Concentrations of particles (PM10) |
|
Stable | ✔✔✔ |
| Concentrations of particles (PM2.5) |
|
Stable | ✔✔✔ |
| Concentrations of carbon monoxide |
|
Stable | ✔✔✔ |
| Concentrations of nitrogen dioxide |
|
Stable | ✔✔✔ |
| Concentrations of sulfur dioxide |
|
Stable | ✔✔✔ |
| Concentrations of lead |
|
Stable | ✔✔✔ |
Notes:
Terms and symbols used above are defined in About the report
Context
Since the early 1990s, research has emerged about the adverse health effects of air pollution. Short-term exposure to elevated air pollutants exacerbates respiratory and cardiovascular problems and increases the risk of acute symptoms, hospitalisation and death (NEPC 2014). Repeated long-term exposure increases the risk of chronic respiratory and cardiovascular disease and mortality, can impact on birth weight, and can permanently affect lung development in children (WHO 2013b).
The International Agency for Research on Cancer has classified diesel exhaust (WHO 2012) and outdoor air pollution (WHO 2013a) as human carcinogens.
Monitoring indicates that most common air pollutants occur in NSW in concentrations generally well below dangerous levels. The main air pollutants of concern are:
- particles (PM2.5 and PM10)
- ground-level ozone (O3)
- gases forming ozone: oxides of nitrogen (NOx) and volatile organic compounds (VOCs).
The main human sources of these pollutants are:
- industry
- motor vehicles
- domestic wood smoke
- hazard reduction burns and human-caused bushfires.
Australians spend an average of 20 hours a day indoors, largely at home (enHealth 2012). As a result, there may be greater personal exposure to indoor airborne pollutants than to air pollution outdoors. Indoor emissions can come from building fixtures, fittings and furniture, indoor activities such as heating and cooking, chemical cleaning products, tobacco smoke and outdoor air pollutants that have come inside.
Health costs of air pollution
In 2005, the annual health costs of air pollution in the Sydney Greater Metropolitan Region (GMR) were estimated to be $893 per head of population or $4.7 billion (DEC 2005), equivalent to $6.4 billion a year in 2015 terms (EPA/OEH 2016).
The 2014 Impact Statement to the Draft Variation to the National Environment Protection (Ambient Air Quality) Measure (NEPC 2014) noted that the savings in associated health costs, of reducing ambient PM10 concentration to 10 micrograms per cubic metre (μg/m3) and ambient PM2.5 concentration to 5μg/m3 in the GMR, was estimated to be $5.7 billion per annum.
In 2005, the health costs of motor vehicle pollution across Australia’s capital cities were estimated to be up to $3.3 billion per year ($1.5 billion for Sydney) (BTRE 2005).
Status and Trends
National standards and goals
In 1998, to help protect the health of Australians, the National Environment Protection Council (NEPC) set national air quality standards and goals, in the National Environment Protection (Ambient Air Quality) Measure (AAQ NEPM).
The AAQ NEPM sets standards for seven common air pollutants to which Australians may be exposed:
- ground-level ozone (O3)
- particles (PM10 and PM2.5)
- carbon monoxide (CO)
- nitrogen dioxide (NO2)
- sulfur dioxide (SO2)
- lead.
In 2016, governments amended the AAQ NEPM, after wide consultation, in response to increasing awareness of the risks posed by fine particles.
Table 8.1 lists the new standards and goals. The section on particles provides details of the changes to standards and goals for PM10 and PM2.5.
The NEPC is currently reviewing the AAQ NEPM standards for SO2, NO2 and O3.
Table 8.1: National Environment Protection (Ambient Air Quality) Measure standards and goals (updated 2016)
| Pollutant | Averaging period | Standard (maximum concentration) | Goal (maximum number of allowable exceedances) |
|---|---|---|---|
| Carbon monoxide | 8-hour rolling average | 9.0 ppm | 1 day a year |
| Nitrogen dioxide | 1-hour average | 0.120 ppm | 1 day a year |
| 1-year average | 0.030 ppm | None | |
| Photochemical oxidants – as ozone | 1-hour average | 0.100 ppm | 1 day a year |
| 4-hour rolling average | 0.080 ppm | 1 day a year | |
| Sulfur dioxide | 1-hour average | 0.200 ppm | 1 day a year |
| 1-day average | 0.080 ppm | 1 day a year | |
| 1-year average | 0.020 ppm | None | |
| Particles as PM10 | 1-day average | 50.0 µg/m3 | None |
| 1-year average | 25.0 µg/m3 | None | |
| Particles as PM2.5 | 1-day average | 25.0 µg/m3 | None |
| 1-year average | 8.0 µg/m3 | None | |
| Lead | 1-year average | 0.50 µg/m3 | None |
Notes:
In 2016, the goal for PM10 was revised from allowing five exceedance days per year of the 24-hour standard of 50µg/m3, to no exceedances, unless determined as an exceptional event.
Information about averaging periods is available on the OEH website.
Monitoring air pollutants
To measure compliance with national standards and goals, the NSW Government operates an extensive air quality monitoring network across the state.
The Office of Environment and Heritage (OEH) monitors air quality in NSW. The NSW air quality monitoring network, which is accredited by the National Association of Testing Authorities (NATA), monitors air quality in the Sydney Greater Metropolitan Region (GMR) and regional population centres, and compares air quality in these regions with national air quality standards. OEH operates over 80 ambient air quality monitoring stations across NSW. All data is reported on the OEH air quality website in near-real time.
Air quality monitoring regions include:
- rural areas monitored by the Rural Air Quality Monitoring Network
- regional centres
- Sydney GMR (Sydney, Illawarra, Central Coast, Lower Hunter and the Upper Hunter).
The OEH Rural Air Quality Monitoring Network was established in December 2017, and consists of 35 community monitoring sites measuring particles across rural NSW. The network is separate from the NATA-accredited OEH monitoring network and measures particulate matter as total suspended particles, and where possible as PM10 and PM2.5. This network will gradually be extended to provide information on particle pollution across all NSW.
There are 22 air quality monitoring sites that report compliance with the AAQ NEPM (see Maps 8.1 and 8.2). All regions except for the Upper Hunter include AAQ NEPM-designated stations.
OEH operates a number of sites that are not designated for AAQ NEPM reporting. These include:
- 35 rural sites, located predominantly in western NSW (see Map 8.1); but also including four sites in Victoria and one in South Australia where source areas affect NSW (the interstate sites are not on the maps)
- five sites in the Sydney region
- 14 industry-funded sites in the Upper Hunter Valley
- three industry-funded sites in Newcastle.
Non-AAQ NEPM sites provide information on the impacts of local sources of airborne pollutants and assist the NSW Government to develop actions to reduce air pollution.
In December 2017, three new air quality monitoring stations were established at Parramatta North in the Sydney GMR, and at Gunnedah and Narrabri in the Namoi region. In May 2018, an additional regional air quality monitoring station was established at Armidale, bringing the total number of stations in NSW to 47 – the largest air quality monitoring network in Australia.
The Gunnedah, Narrabri and Armidale sites have not yet been classified as AAQ NEPM or non-AAQ NEPM sites.
Map 8.1: The NSW air quality monitoring network
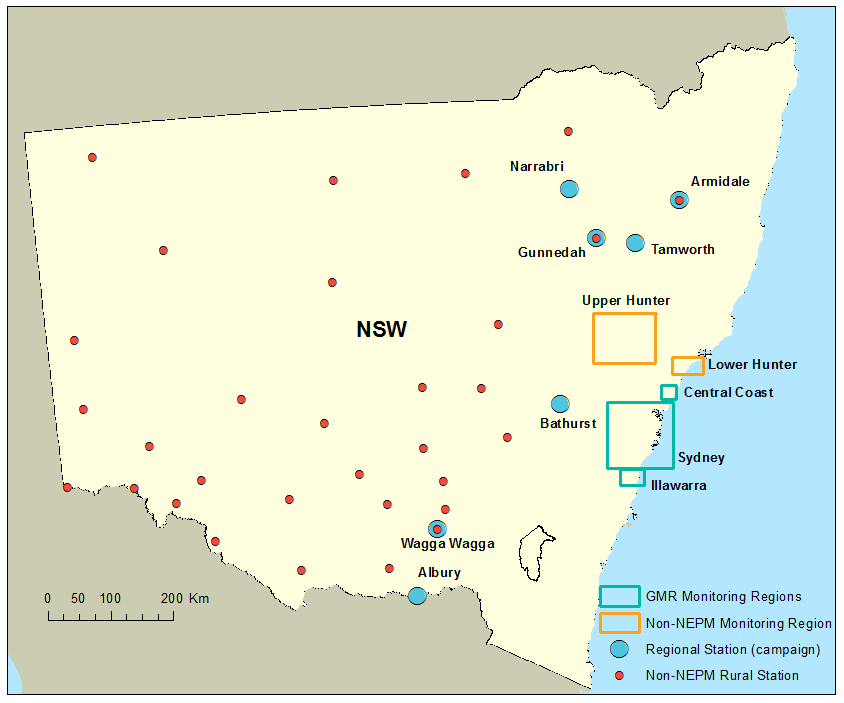
Notes:
Air quality monitoring regions (station groups), including rural monitoring network, regional centres and the Greater Metropolitan Region or GMR (Sydney, Illawarra, Central Coast, Lower Hunter and the Upper Hunter). All regions except for the Upper Hunter include NEPM-designated stations.
Map 8.2: The Sydney GMR and lower Hunter air monitoring network
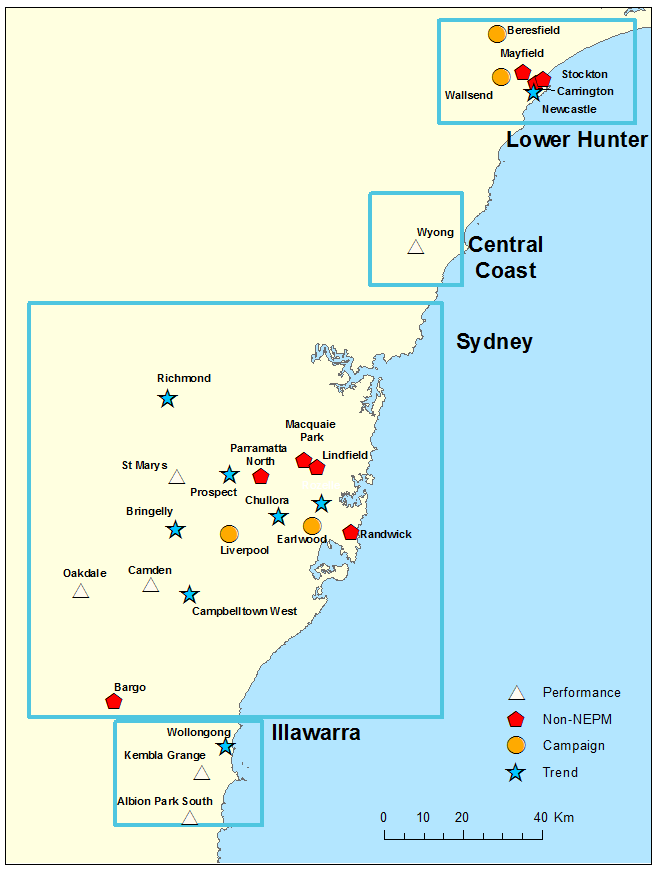
Notes:
Air quality monitoring stations in the NSW Greater Metropolitan Region, including designated AAQ NEPM stations. Gunnedah, Narrabri and Armidale sites were established from December 2017 and are yet to be classified.
NSW consistently complies with national standards and goals for:
- CO
- NO2
- SO2 (except for one exceedance of the hourly average standard at a station in the Upper Hunter region in December 2016).
As motor vehicles, fuels and industries have improved:
- CO levels are now generally only high when traffic is congested and there is little or no wind
- NO2 and SO2 levels are usually 25–75% lower than the standards.
Ambient lead monitoring was discontinued from January 2005, following a decrease in lead levels to well within the national standard, largely due to the introduction of unleaded petrol.
Particles and ozone levels continue to be of concern (see relevant sections below).
Particles
Airborne particles (particularly PM10 and PM2.5) are invisible to the naked eye, with PM2.5 pollution known as ‘fine particle pollution’. PM10 is particles that are 10 micrometres or less in diameter and includes PM2.5, which is 2.5 micrometres or less in diameter.
Visible dust deposited on household surfaces creates nuisance problems, although it is not considered a health hazard.
Ongoing research shows that the smaller the particles, the greater their potential health hazard (WHO 2013b). Smaller particles (PM2.5) can be inhaled more deeply into the lungs. As well as causing respiratory irritation, some are small enough to pass into the bloodstream where, even at relatively low levels, they can trigger heart attacks in people with health conditions and severely affect children and the elderly (WHO 2013a).
Emissions that can form particle pollution include:
- SO2
- NOx
- VOCs
- ammonia (NH3).
These emissions are caused by a combination of natural and human sources.
Human sources include:
- industrial and commercial activities
- road and non-road diesel vehicles (non-road diesel vehicles include bulldozers and trains)
- household activities
- hazard reduction burns.
Natural causes include:
- bushfires
- windborne dust
- sea salt spray
- emission of VOCs from vegetation
- pollen and spores from grasses, plants and trees.
Fine particles can be transported by wind and other air movement between regions.
Particle concentrations are monitored across the GMR, covering about 75% of the NSW population, and some regional centres, to measure compliance with national standards. Levels recorded in regional centres generally represent the air quality in surrounding regions. Concentrations can vary, depending on sources, regions and seasons.
Between 2015 and 2017, particle concentrations exceeded the national air quality standards on up to 20 days a year in Sydney, and up to 16 days a year in parts of regional NSW. Where an exceedance occurred on the same day in a region for both PM10 and PM2.5 that day was only counted once.
For consistency in presenting trends in this report, Figures 8.1, 8.2, 8.4 and 8.6 include all exceedances, including those due to exceptional events.
Changes to standards and goals
In 2016, NEPC amended the AAQ NEPM to introduce more protective standards and goals for fine particles. These were:
- adding an annual average PM10 standard of 25 μg/m3
- adopting formal PM22.5 standards:
- a 24-hour average standard of 25 µg/m3
- an annual average standard of 8 µg/m3
- adding a goal to reduce PM2.5standards to 20 µg/m3 for the 24-hour average and 7 µg/m3 for the annual average by 2025
- reporting annually from June 2018 on population exposure to PM2.5 particles.
Before 2016, there was an allowance of five days a year when fine particles could exceed these standards. The 2016 amendment removed this allowance, but allows instead for ‘exceptional events’, such as a fire or dust storm that:
- adversely affects air quality at a specific location
- causes an exceedance that is higher than normal historical fluctuations and background levels
- is directly related to bushfires, authorised hazard reduction burning or continental-scale windblown dust.
PM10
Elevated PM10 concentrations occur in both metropolitan and regional areas (Figures 8.1 and 8.2) and vary from year to year.
The greatest number of days with PM10 levels above the 24-hour standard occurred between 2002 and 2009 when NSW experienced prolonged dry conditions during the Millennium Drought. The drought ended with the arrival of wet La Niña conditions in 2010 and 2011.
Bushfires, hazard reduction burns and dust storms have also contributed to variations in PM10. Figures 8.1 and 8.2 show the impacts of:
- bushfires in 1994 and 2001–2003 in Sydney and the Hunter region respectively
- bushfires in 2006–2007 across western NSW
- major statewide dust storms in September 2009
- hazard reduction burns in 2011 in Sydney
- a NSW bushfire emergency in late 2013
- bushfires in November 2016
- hazard reduction burns in Sydney in May 2016 and August 2017.
Figure 8.1: Number of days the AAQ NEPM 24 hour standard for particles (PM10) was exceeded in the Sydney GMR
Notes:
To ensure consistency in presenting trends, this chart includes all exceedances, including those due to exceptional events.
PM10 monitoring commenced at the Central Coast in 2012.
Figure 8.2: Number of days the AAQ NEPM 24 hour standard for particles (PM10) was exceeded in NSW rural centres
Notes:
To ensure consistency in presenting trends, this chart includes all exceedances, including those due to exceptional events. PM10 monitoring in rural centres was limited before 2002.
PM2.5 (fine particles)
Monitoring results for PM2.5 include fine particle pollution caused by dust storms, bushfires and hazard reduction burns. Figure 8.3 shows spikes related to large-scale, drought-related dust storms in 2003 and 2009. The spikes in 2013 and 2016 were related to bushfires and hazard reduction burns.
Figure 8.3: Annual maximum 24 hour average concentrations for particles (PM2.5) in the Sydney GMR
Figure 8.4: Number of days the AAQ NEPM 24-hour standard for particles (PM2.5) was exceeded in the Sydney GMR
Notes:
To ensure consistency in presenting trends, this chart includes all exceedances, including those due to exceptional events.
Figure 8.5: Number of days the AAQ NEPM 24-hour standard for particles (PM2.5) was exceeded in NSW regional centres
Notes:
PM2.5 monitoring commenced in 2011 at Wagga Wagga North, in 2016 at Bathurst and Tamworth, and in 2017 at Albury. Agricultural stubble burning in the Wagga Wagga region contributed to particle exceedance days.
There were no exceedance days recorded in 2011, 2012 or 2015.
To ensure consistency in presenting trends, this chart includes all exceedances, including those due to exceptional events.
Ozone
Ozone (O3) is present in both the upper atmosphere (stratosphere) and the lower atmosphere (troposphere). The ‘ozone layer’ in the stratosphere protects all life forms by reducing the intensity of the sun’s damaging ultraviolet radiation.
Stratospheric ozone is not a pollutant. In contrast, tropospheric (‘ground-level’) O3 is an air pollutant that is harmful to human health and the environment (WHO 1998).
O3 is formed when the precursors NOx and VOCs react to produce smog during warm, sunny weather when wind speeds are low. Bushfires can contribute significantly to high O3 concentrations.
Ozone precursors can be emitted from human activities or natural sources such as vegetation. Human sources include:
- motor vehicle exhaust and evaporative emissions,
- household and commercial solvent emissions
- industrial emissions.
O3 is only measured at sites in Sydney, the Lower Hunter region, the Illawarra region, and on the Central Coast, as high ozone concentrations are not likely to be experienced at other centres due to fewer traffic, commercial and industrial emissions of NOx and VOCs.
Elevated ozone concentrations tend to occur during warmer months, so are likely to be exacerbated by future climate change (DECCW 2010).
While all parts of Sydney can experience O3 concentrations above the AAQ NEPM standards, the west and south-west are more exposed to high levels (DECCW 2010), due to summertime patterns of atmospheric circulation in the Sydney Basin, when sea breezes carry O3 and its sources NOx and VOCs to this area (Jiang et al. 2016, 2017).
The AAQ NEPM sets two standards for ozone:
- a one-hour standard of 0.10 parts per million (ppm)
- a rolling four-hour standard of 0.08 ppm.
The AAQ NEPM goal for ozone stipulates a maximum allowable exceedance of one day per year for each standard (see Table 8.1).
Sydney has exceeded one or both ozone standards on at least one day every year since 1994 (see Figures 8.7 and 8.8).
Figure 8.6: number of days the one-hour AAQ NEPM standard for ozone was exceeded in the Sydney GMR
Notes:
A day is counted only once per region, even if exceedances occur at multiple monitoring sites on that particular day.
Figure 8.7: number of days the four-hour AAQ NEPM standard for ozone was exceeded in the Sydney GMR
Notes:
A day is counted only once per region, even if exceedances occur at multiple monitoring sites on that particular day.
Since 1994, ozone concentrations in Sydney have exceeded the one-hour standard on up to 19 days per year and exceeded the rolling four-hour standard on up to 21 days per year.
- In Sydney, between 2015 and 2017, ozone concentrations exceeded the standards on up to nine days a year.
- In the Illawarra region, ozone concentrations exceeded both standards on up to seven days per year, in 60% of the years recorded.
- In the Lower Hunter region, neither standard has been exceeded on more than two days a year since 1994.
Figures 8.8 and 8.9 show the maximum recorded concentrations of ozone for each region from 1994 to 2017. These have been highest in Sydney and lowest in the Lower Hunter region.
Figure 8.8: Annual maximum one-hour-average concentrations for ozone in the Sydney GMR
Figure 8.9: Annual maximum four-hour-average concentrations for ozone in the Sydney GMR
Reasons for the standard being exceeded
The number of days when ozone standards are exceeded in a year depends on meteorological conditions and the presence of precursor emissions (NOx and VOCs). For example, high temperatures and intense sunlight can cause chemical reactions between NOx and VOCs, forming ozone from motor vehicle, household, commercial and industrial emissions. Bushfires and hazard reduction burns also contribute to ozone exceedances, with high concentrations of NOx and VOCs occurring in smoke plumes. (DECCW 2010, Jiang et al. 2017).
Air Toxics NEPM pollutants
In 2004 NEPC established the National Environment Protection (Air Toxics) Measure (Air Toxics NEPM) to help manage toxic air pollutants, namely:
- benzene
- toluene
- xylenes
- formaldehyde
- benzo(α)pyrene (BaP).
NSW previously achieved the NEPM requirement to estimate human exposure to the five NEPM air toxics using a consistent national framework. The most recent ambient air toxics monitoring (NEPC 2010, Tables 1–5) shows that concentrations of all these pollutants were well below investigation levels that would trigger the NEPM requirement for ongoing monitoring.
Indoor air quality
Significant indoor air pollutants include:
- emissions from building furniture and fittings and chemical cleaning products
- biological contaminants such as pet hair, skin and saliva, dust mites and mould spores
- dust and lead particles disturbed by renovations (in older buildings)
- ambient air pollution, particularly fine particles and gases, infiltrating from outdoors (Sheppeard et al 2006).
Poor indoor air quality in NSW homes is also caused by:
- secondary tobacco smoke and emissions from wood heaters
- emissions from gas stoves and unflued gas heaters.
The most recent data shows a decline in:
- the use of solid fuelwood heaters as the main source of heat in NSW homes from 13.7% in 2008 to 10.2% in 2014 (ABS 2014)
- secondary tobacco smoke as a contributor to poor indoor air quality in NSW – in 2016, 94.3% of NSW households were smoke-free, compared to 79.4% in 2002 (Centre for Epidemiology and Evidence 2018).
NSW Health’s Indoor Air Pollution web page provides additional information (NSW Health 2015).
Pressures
Pollutants
Pollution sources
The air pollutants of ongoing concern for NSW air quality are ozone and particles, especially fine particles (PM2.5), due to their more significant impacts on human health. Occasionally, national air quality standards continue to be exceeded for ozone and particle pollution, and health effects are known to occur even at concentrations that are within national standards.
Sources of primary particles which are released directly into the air, and sources of precursor pollutants for secondary particles (formed in the air) and ozone, are therefore a focus in NSW.
For information on ozone, and its main precursors oxides of nitrogen (NOx) and volatile organic compounds (VOCs), see the Ozone section in ‘Status and trends’.
For information on particle and fine particle pollution, see the Particles section in ‘Status and trends’.
Recent research findings
Airborne particles in Sydney
Studies into the sources of airborne particles conducted in Sydney have found (Cope et al.2014; Cohen et al. 2016):
- wood smoke, mainly from residential wood heating, contributes significantly to fine particle pollution in autumn and winter, particularly in western Sydney
- the contribution of motor vehicle emissions to PM2.5 concentrations reduced between 2000 and 2014, but remains a significant source of fine particles
- secondary sulfate particles from SO2 emissions from sources such as power generation, industry and motor vehicles contribute significantly to fine particle pollution, especially in summer
- organic matter in summer and autumn, and sea salt in summer, are large sources of PM2.5
- major sources of secondary organic particles in the air include VOCs from vegetation in summer and wood heaters in autumn and winter.
Airborne particles in the Hunter region
Studies of sources of airborne particles in the Lower and Upper Hunter regions have found:
- dominant sources of PM2.5 in Muswellbrook and Singleton included wood smoke, vehicle emissions and industrial emissions from power stations – fine particle pollution was higher in winter, due to wood fires used for residential heating (Hibberd et al. 2013)
- main sources of PM2.5air pollution in the Lower Hunter region included motor vehicle emissions; wood smoke; industrial and shipping emissions; soil and sea salt
- sources of precursor pollutants contributing to fine particle pollution included SO2 from fossil fuel burning, ammonia from industry, vehicles and agriculture, and NOx from vehicles, industry and off-road equipment (Hibberd et al. 2016)
- the larger particles of visible black dust found on inner city surfaces were made up of soil particles (approximately 69%), coal dust (around 10%), rubber particles (4%) and soot (3%), with the remaining 14% from other sources (AECOM 2016).
As well as being the largest source of particles in the Sydney region and contributing significantly to particle pollution in the Hunter, wood smoke contains other air pollutants such as carbon monoxide, oxides of nitrogen, and a range of organic compounds, some of which are toxic or carcinogenic (e.g. benzo(α)pyrene and benzene).
The NSW GMR Air Emissions Inventory for 2008 (EPA 2012a), found that emissions of key air pollutants were decreasing in Sydney despite increases in population and other drivers. However, emissions of NOx and PM10 were increasing – see State of the Environment 2012 (EPA 2012b).
Climate change
Temperatures in NSW are approximately one degree Celsius above pre-industrial times and are projected to further rise over the 21st century (BoM 2018). Future trends in rainfall are not known, given uncertainties in the modelling of clouds and convection.
The relationship between climate change and air quality is complex. While there may be decreases in some types of emissions, such as wood smoke, and NOx from vehicles, due to higher than average temperatures, chemical and temperature changes in the atmosphere may lead to increases in key air pollutants. This will influence the formation of ozone and secondary particles (PM2.5).
Events such as droughts and bushfires, which may become more frequent with climate change, may also increase air pollution (OEH undated, OEH 2014a). For example, the frequency and severity of dust storms increases with the frequency of droughts (Speer 2013).
Warmer temperatures and increased carbon dioxide levels are associated with higher pollen production and mould growth, leading to higher levels of airborne allergens (Katelaris and Beggs, 2018). Changing weather patterns may also result in an increase in unusual storms that trigger asthma in some people (ASCIA 2016, Asthma Australia).
Research into the interactions between climate change and air quality is ongoing. Sources include Adapt NSW, Cope et al 2008, DECCW 2010, Jacob & Winner 2008, Lacressonnière et al 2014, Pfister et al 2014, Walsh 2008.
See also the Climate Change and Greenhouse Gas Emissions topics
Population
The NSW population is projected to grow to 9.9 million people by 2036 (DPE 2018). Increased residential and commercial development and higher population density in cities mean that more people will be exposed to air pollution, due to:
- expanded transport infrastructure and increased development along transport corridors
- increased economic activity from industries such as mining, shipping and freight
- increased household emissions, for example, from wood heaters and household chemical products
- new developments exposed to smoke from hazard reduction burns and bushfires
- higher population densities leading to increased air pollution from traffic and increased emissions from households.
Older people are particularly vulnerable to the health impacts of air pollution. This is of concern given the increasing proportion of people over the age of 65 in NSW.
See also the Population topic
Transport
In the Sydney region, motor vehicles are a significant source of ozone precursor emissions (NOx and VOCs), and particle pollution. In 2016–17, Sydney residents made 18.6 million trips each weekday, 69% of which were by car (TfNSW 2018).
The 2008 NSW GMR Air Emissions Inventory showed that in the Sydney region, motor vehicles accounted for:
- 62% of anthropogenic NOx emissions
- 24% of VOCs
- 14% of as PM2.5 fine particle pollution.
In 2015–16, transport was responsible for an estimated 20.8% of greenhouse gas emissions in NSW (DEE 2018).
Ships and diesel locomotives are other sources of particles and NOx that contribute to air pollution affecting some NSW regions and communities.
See also the Transport topic
Responses
Legislation and policy
The Protection of the Environment Operations Act 1997 (POEO Act), the POEO (Clean Air) Regulation 2010 and POEO (General) Regulation 2009 set the framework for managing air pollution from major industry in NSW. These controls also help reduce localised emissions of air toxics and include provisions for managing emissions from commercial and domestic sources, such as wood smoke and open burning.
The National Clean Air Agreement enables governments to reduce air pollution and improve air quality through cooperative action with industry at national, state and local levels. Completed actions include implementation of:
- strengthened air quality reporting standards for particles
- new emission standards for non-road petrol engines
- tighter wood heater emissions and efficiency standards.
Legislative changes
Wood smoke: The EPA administers wood smoke regulations in NSW and works with industry, other Australian jurisdictions and the Commonwealth Government to improve standards for heating appliances. In 2016, the NSW Government adopted a regulatory amendment requiring all new wood heaters sold in NSW to comply with updated national emission and efficiency standards. EPA audit programs help ensure wood heaters offered for sale meet these standards.
Tobacco smoke: The Smoke-free Environment Regulation 2016 strengthens the Smoke-free Environment Act 2000, while the NSW Tobacco Strategy 2012–2017 (NSW Health 2012) provides an overarching framework for reducing smoking and tobacco-related harm in NSW.
Smoking is now banned in all enclosed public places and commercial outdoor dining areas, as well as in motor vehicles when children under 16 are present.
In NSW, 9 out of 10 adults now live in a smoke-free home.
Product emissions: The Commonwealth Product Emissions Standards Act 2017 sets national maximum emission limits for specified new products sold in Australia. Emissions-controlled products covered by the Act include new outdoor power equipment such as gardening equipment and outboard motors.
Standards
Fine particles: In February 2016 a variation to the National Environment Protection (Ambient Air Quality) Measure (AAQ NEPM) commenced which:
- formally adopts fine particle (PM2.5) standards, and
- adds an annual average PM10 standard of 25 μg/m3.
The revised national standards for PM2.5 are more health protective than World Health Organization guidelines and are the most health protective PM2.5 standards in the world. The national review was led by the NSW Government.
For more information on the variation to the particles standards see Changes to standards and goals in the Particles section.
Managing Particles and Improving Air Quality in NSW (EPA 2013) explains the management of particle pollution in NSW and provides a set of principles and actions to reduce particle emissions.
National review of vehicle and fuel emissions: The Commonwealth Government manages fuel quality and vehicle emission standards for new road vehicles. These standards are being reviewed. The NSW Government's 2017 submissions to the Australian review supported the early introduction of stricter national standards that would:
- meet international best practice (Euro 6/VI) emission standards for light and heavy-duty vehicles
- introduce low sulfur (10ppm) petrol to maximise environmental and human health benefits.
Cruise ships: The Commonwealth Government regulates fuel used for all ships, including cruise ships, in Sydney Harbour and regional NSW ports. In December 2016, following NSW Government and community representations, the Australian Government introduced requirements for cruise ships to use low sulfur fuel (0.1% or less) while at berth in Sydney Harbour.
From January 2020, the International Maritime Organization will reduce the global sulfur cap from 3.5% to 0.5% for fuel and this will be the minimum requirement for all shipping.
Policy
The NSW Government Resource Efficiency Policy (GREP) (OEH 2014b) sets minimum emissions standards for mobile non-road diesel plant and equipment, such as construction equipment, purchased by NSW Government agencies. Minimum standards applied from January 2015 and were tightened in January 2018. The GREP requires agencies to:
- collect information from construction project contractors on their equipment
- include a weighting for lower-emission machines in their tender processes
- use low volatility paints and surface coatings that comply with the Australian Paint Approval Scheme, where fit for purpose.
OEH is currently conducting a review of the GREP to:
- analyse whole-of-government progress in implementing the GREP
- identify challenges agencies faced in adopting the GREP
- determine if reforms are required.
Diesel emissions: The Diesel and Marine Emissions Management Strategy (EPA 2015) aims to improve air quality and public health in NSW by reducing harmful emissions from non-road diesel and marine sources, such as shipping, equipment used in coal mines, locomotives, and industry activities licensed by the EPA.
Climate change: Policies to reduce greenhouse gas emissions in sectors such as transport and energy can also reduce air pollution. For example, NOx is both a greenhouse gas and a contributor to photochemical smog, so strategies to reduce NOx pollution will both improve air quality and reduce greenhouse gas emissions.
See responses section in
, Climate Change, Greenhouse Gas Emissions and Transport topics.
Programs
Monitoring NSW air quality
Monitoring air quality, conducting research, and regional airshed modelling provide a sound evidence base for developing and implementing air quality policies and programs. OEH monitors air quality in NSW and data is publicly reported. Full details are available on the OEH website. See also ‘Status and trends’.
Informing the public: OEH provides up-to-date air quality information, forecasts and alerts online, via SMS and email. This information allows communities to know about local air quality, engage in informed discussions on air quality issues, and manage their exposure when pollutant levels are high.
The EPA’s Air Emissions in my Community web tool, released in 2013 and upgraded in 2018, provides community access to information on air pollution sources in local areas within the GMR. The tool presents aggregated data and charts for different geographic areas including by local government area and by postcode.
Controlling transport emissions
Key initiatives to reduce emissions and improve health and liveability include requiring vapour recovery technology to capture VOC emissions from service stations across the Sydney, Wollongong, Central Coast and Newcastle metropolitan areas. Data from 2016–17 showed that:
- 92% of service stations required to install vapour recovery technology at the bowser for refuelling vehicles had done so
- 98% of service stations required to install technology to recover vapours when refilling underground storage tanks were compliant.
It is estimated that vapour recovery controls will eliminate more than 5,000 tonnes of VOC emissions per year when fully implemented.
Another key achievement has been limiting the volatility of petrol supplied in Sydney from 15 November to 15 March each year to 62 kilopascals, with petrol importers and blenders required to test batch volatility and report to the EPA.
Controlling industrial emissions
The EPA reduces industrial emissions through licensing, regulation and working in partnership with industry stakeholders on strategies to improve air quality.
Air quality impact assessment: in 2017, the EPA updated the Approved Methods for the Modelling and Assessment of Air Pollutants in New South Wales (EPA 2016) to include particle assessment criteria consistent with the 2016 revisions to the AAQ NEPM standards.
Mining and transport of coal: between 2012 and 2017, coal mine particulate emissions were reduced by about 22,000 tonnes per year. In 2016, the EPA’s Dust Stop program required key coal mines to stabilise excessive areas of land exposed to wind erosion, reducing annual particulate emissions by a further 2,000 tonnes. The practices implemented through the Dust Stop program are now part of standard mining operations throughout NSW.
Figure 8.10: Dust Stop program – Reduction in PM10 emissions (tonnes)
The Upper Hunter Valley dust risk forecasting system: From September to November 2017, the NSW Government trialled an Upper Hunter Valley Dust Risk Forecasting System. The system predicted weather that would increase dust generation, so mines could take extra precautions at those times. During the trial, the EPA required mines to record the mass of material moved each day. The EPA and OEH are now completing analysis of the results and considering the next steps in consultation with stakeholders.
Monitoring lead levels at Broken Hill: In 2016, the NSW Government commissioned monitoring of airborne lead levels at Broken Hill as part of the Broken Hill Environmental Lead Study. The monitoring aimed to identify sources of lead pollution related to mining and smelting and determine the effectiveness of remediation works.
The study was a partnership between the NSW Government and Macquarie University to:
- monitor airborne and deposited lead
- assess current mining emissions
- assess legacy emissions, where lead has been resuspended from areas affected by past activities.
Controlling commercial and domestic emissions
Wood smoke program: The EPA supports councils across NSW in managing wood smoke through periodic Wood Smoke Reduction Programs and providing community educational materials for use by councils. Social research undertaken for the EPA (Databuild 2016) identified lack of awareness of wood smoke impacts on health as the key barrier to changing people’s wood heater use.
In 2017, the EPA developed a new suite of wood smoke awareness materials, which was trialled by the Upper Hunter councils of Muswellbrook and Singleton before being rolled out to councils across NSW for the winter of 2018. The local community education campaign materials are available on the EPA website.
Managing indoor air quality
Heating in schools: NSW schools and school buildings built since 2012 are no longer fitted with unflued gas heaters. Existing unflued heaters are replaced with flued gas heaters when they reach the end of their serviceable life or a school requires a heating upgrade. Schools in colder areas are prioritised for heater replacement as it is less practical for those schools to leave windows open in winter for ventilation (DoE 2016).
Building rating schemes: The National Australian Built Environment Rating System (NABERS) is a national rating system administered by OEH on behalf of all states, territories and the Australian Government. NABERS provides tools to rate the environmental impact of commercial building operations (office buildings, shopping centres, hotels, data centres and hospitals).
The NABERS Indoor Environment (IE) certification scheme assesses the quality of the indoor environment and includes an assessment of the building’s capability to provide fresh air indoors and control the concentration of indoor pollutants, including particulate matter.
As of March 2018, 126 NSW buildings had been certified with NABERS indoor environment ratings, out of 297 buildings certified nationally.
Green Star certification, administered by the Green Building Council of Australia, also includes air quality measures for rating indoor environments. Where a building has completed a NABERS Indoor Environment rating, the rating contributes to the Green Star – Performance certification.
For more information about NABERS see the Energy Consumption topic.
Future opportunities
Emissions control
Current emission control measures being progressed under the National Clean Air Agreement include:
- reviewing the reporting standards for sulfur dioxide, nitrogen dioxide and ozone under the AAQ NEPM
- evaluating the potential for a national approach to manage non-road diesel engine emissions (Commonwealth and NSW governments are co-leading this project).
Cross-agency and community collaboration
In 2016 and 2017, the EPA consulted widely on air quality issues and potential new control measures, through the Clean Air for NSW Consultation Paper (EPA/OEH 2016) and Clean Air Summit. There is ongoing engagement of stakeholders, councils and communities regionally through Community Consultative Committees, for example those in Newcastle and the Upper Hunter, as well as targeted stakeholder engagement on specific air issues and projects.
The EPA-led Interagency Taskforce on Air Quality in NSW considers whole-of-government approaches to existing and emerging air quality issues and collaborates with the EPA and OEH on air quality management and communication.
References
References for Air Quality
ABS 2014, Environmental Issues: Energy Use and Conservation, March 2014, cat. no. 4602.0.55.001, Australian Bureau of Statistics, Canberra [www.abs.gov.au/ausstats/[email protected]/mf/4602.0.55.001; www.abs.gov.au/ausstats/[email protected]/Lookup/4602.0.55.001main+features1Mar%202014]
AECOM 2016, Lower Hunter Dust Deposition Study Final Report, Prepared for the NSW Environment Protection Authority (EPA) by AECOM Australia, EPA, Sydney [www.epa.nsw.gov.au/your-environment/air/regional-air-quality/lower-hunter-air-quality-studies]
ASCIA 2016, Thunderstorm Asthma, Australasian Society of Clinical Immunology and Allergy, Sydney [www.allergy.org.au/patients/asthma-and-allergy/thunderstorm-asthma]
Asthma Australia undated, Epidemic Thunderstorm Asthma, Sydney [www.asthmaaustralia.org.au/sa/about-asthma/manage-your-asthma/triggers/epidemic-thunderstorm-asthma]
BoM 2018, Climate change and variability, Bureau of Meteorology [www.bom.gov.au/climate/change/index.shtml#tabs=Tracker&tracker=timeseries]
BTRE 2005, Health Impacts of Transport Emissions in Australia: Economic Costs, Working Paper No. 63, Bureau of Transport and Regional Economics, Department of Transport and Regional Services, Canberra [www.bitre.gov.au/publications/2005/wp_063.aspx]
Centre for Epidemiology and Evidence 2018, HealthStats NSW, NSW Ministry of Health [www.healthstats.nsw.gov.au]
Cohen D, Atanacio A, Stelcer E & Garton D 2016, Sydney Particle Characterisation Study, PM2.5 Source Apportionment in the Sydney Region between 2000 and 2014, Australian Nuclear Science and Technology Organisation, Sydney [www.environment.nsw.gov.au/topics/air/research/previous-research/15-year-sydney-particle-characterisation-study]
Cope M, Keywood M, Emmerson K, Galbally I, Boast K, Chambers S & others 2014, Sydney Particle Study Stage II 2010–14 The Centre for Australian Weather and Climate Research CSIRO and NSW Office of Environment & Heritage, Sydney [www.environment.nsw.gov.au/topics/air/research/previous-research/sydney-particle-study]
Cope ME, Lee S, Physick B, Abbs D, Nguyen K & McGregor J 2008, A Methodology for Determining the Impact of Climate Change on Ozone Levels in an Urban Area, report by the CSIRO, Division of Marine and Atmospheric Research, Melbourne, for the Department of the Environment, Water, Heritage and the Arts (Clean Air Research Program), Canberra [pandora.nla.gov.au/pan/97281/20090327-1109/www.environment.gov.au/atmosphere/airquality/publications/climate-change.html]
Databuild 2016, Upper Hunter Wood Smoke Community Research Project: Final report prepared for the NSW Environment Protection Authority, Sydney [www.epa.nsw.gov.au/your-environment/air/reducing-wood-smoke-emissions/upper-hunter-wood-smoke-community-research-project]
DEC 2005, Air Pollution Economics: Health Costs of Air Pollution in the Greater Sydney Metropolitan Region, Department of Environment and Conservation, Sydney [www.epa.nsw.gov.au/your-environment/air/air-nsw-overview/costs-benefits-air-pollution-controls]
DECCW 2010, Current Air Quality in New South Wales: A technical paper supporting the Clean Air Forum 2010, Department of Environment, Climate Change and Water, Sydney [www.environment.nsw.gov.au/air/cpairqual.htm]
DEE 2018, State and Territory Greenhouse Gas Inventories 2016, Department of Environment and Energy, Canberra [www.environment.gov.au/climate-change/climate-science-data/greenhouse-gas-measurement/publications/state-and-territory-greenhouse-gas-inventories-2016]
DPE 2018 (updated 16 May 2018), Population projections: 2016 NSW population and household projections, NSW Department of Planning and Environment, Sydney [www.planning.nsw.gov.au/Research-and-Demography/Demography/Population-projections]
DoE 2016, Gas heater update, NSW Department of Education, Sydney
enHealth 2012, Australian Exposure Factor Guide, Australian Environmental Health Committee, Canberra [www.health.gov.au/internet/main/publishing.nsf/content/health-pubhlth-publicat-environ.htm]
EPA 2012a, 2008 Calendar Year Air Emissions Inventory for the Greater Metropolitan Region in NSW, Environment Protection Authority, Sydney [www.epa.nsw.gov.au/air/airinventory2008.htm]
EPA 2012b, New South Wales State of the Environment 2012, Environment Protection Authority, Sydney [www.epa.nsw.gov.au/soe/soe2012]
EPA 2013, Managing particles and improving air quality in NSW, Environment Protection Authority, Sydney [www.epa.nsw.gov.au/air/20130784ManPartStr.htm]
EPA 2015, Diesel and marine emissions management strategy, Environment Protection Authority, Sydney [www.epa.nsw.gov.au/air/150038DieselStrategy.htm]
EPA 2016, Approved Methods for the Modelling and Assessment of Air Pollutants in New South Wales, Environment Protection Authority, Sydney [www.epa.nsw.gov.au/your-environment/air/industrial-emissions/modelling-assessing-air-emissions/approved-methods-modelling-assessing-air-pollutants]
EPA/OEH 2016, Consultation Paper Clean Air for NSW, Environment Protection Authority and Office of Environment & Heritage, Sydney [www.epa.nsw.gov.au/your-environment/air/clean-air-nsw]
Hibberd MF, Keywood MD, Selleck PW, Cohen DD, Stelcer E, Scorgie Y & Chang L 2016, Lower Hunter Particle Characterisation Study, NSW Office of Environment & Heritage, Commonwealth Scientific and Industrial Research Organisation & Australia's Nuclear Science and Technology Organisation [www.environment.nsw.gov.au/research-and-publications/publications-search/lower-hunter-particle-characterisation-study]
Hibberd MF, Selleck PW, Keywood MD, Cohen DD, Stelcer E & Atanacio AJ 2013, Upper Hunter Particle Characterisation Study, CSIRO, Melbourne [www.environment.nsw.gov.au/aqms/uhaqmnfpcs.htm]
Jacob D & Winner D 2008, ‘Effect of climate change on air quality’, Atmospheric Environment, 43(1), pp. 51–63 [dx.doi.org/10.1016/j.atmosenv.2008.09.051]
Jiang N, Betts A & Riley M 2016, ‘Summarising climate and air quality (ozone) data on self-organising maps: A Sydney case study’, Environmental Monitoring and Assessment, 188: 103 [doi.org/10.1007/s10661-016-5113-x]
Jiang N, Scorgie Y, Hart M, Riley ML, Crawford J, Beggs PJ, Edwards GC, Chang L, Salter D & Virgilio GD, 2017, ‘Visualising the relationships between synoptic circulation type and air quality in Sydney, a subtropical coastal-basin environment’, International Journal of Climatology, 37, pp. 1,211–28 [doi.org/10.1002/joc.4770]
Katelaris CH & Beggs PJ 2018, ‘Climate change: Allergens and allergic diseases’, Internal Medicine Journal, 48(2), pp. 129–34 [onlinelibrary.wiley.com/doi/full/10.1111/imj.13699]
Lacressonnière G, Peuch V-H, Vautard R, Arteta J, Déqué M, Joly M, Josse B, Marécal V & Saint-Martin D 2014, ‘European air quality in the 2030s and 2050s: Impacts of global and regional emission trends and of climate change’, Atmospheric Environment, 92, pp. 348–58 [dx.doi.org/10.1016/j.atmosenv.2014.04.033]
NEPC 2010, National Environment Protection Council Annual Report 2009–2010, National Environment Protection Council, Adelaide [www.nepc.gov.au/resource/ephc-archive-nepc-annual-report-2009-10]
NEPC 2014, Draft Variation to the National Environment Protection (Ambient Air Quality) Measure: Impact Statement, National Environment Protection Council, Canberra [www.environment.gov.au/protection/nepc/nepms/ambient-air-quality/variation-2014/impact-statement]
NSW Health 2012, NSW Tobacco Strategy 2012–2017, NSW Ministry of Health, Sydney [www.health.nsw.gov.au/tobacco/Pages/nsw-tobacco-strategy.aspx]
NSW Health 2015 (updated 2 December 2015), Indoor Air Pollution, NSW Ministry of Health, Sydney [www.health.nsw.gov.au/environment/air/Pages/indoor-air-pollution.aspx]
OEH updated, Bushfires, AdaptNSW: Office of Environment & Heritage, Sydney [climatechange.environment.nsw.gov.au/Impacts-of-climate-change/Bushfires]
OEH 2014a, NSW Climate Change Snapshot, Office of Environment & Heritage, Sydney [climatechange.environment.nsw.gov.au/~/media/8C0EFD5C6C584BA488DE0AF7DF67635C.ashx]
OEH 2014b, NSW Government Resource Efficiency Policy, Office of Environment & Heritage, Sydney [www.environment.nsw.gov.au/resources/government/140567NSWGREP.pdf (PDF 0.3MB)]
Pfister GG, Walters S, Lamarque J-F, Fast J, Barth MC, Wong J, Done J, Holland G & Bruyère CL 2014, ‘Projections of future summertime ozone over the US’, Journal of Geophysical Research: Atmospheres, 119(9), pp. 5,559–82 [dx.doi.org/10.1002/2013JD020932]
Sheppeard V, Morgan G & Corbett S 2006, ‘New South Wales Indoor Air Survey: Part I Sources and Concentrations of Pollutants in Homes in New South Wales’, Environmental Health, 6, pp. 15–24 [www.researchgate.net/publication/288895377_New_South_Wales_indoor_air_survey_Part_1_sources_and_concentrations_of_pollutants_in_homes_in_new_South_Wales]
Speer MS 2013, ‘Dust storm frequency and impact over Eastern Australia determined by state of Pacific climate system’, Weather and Climate Extremes, Vol. 2, December 2013, pp. 16-21 [doi.org/10.1016/j.wace.2013.10.004]
TfNSW 2018, Household Travel Survey Sydney GMA Regions Viz, Transport for NSW, Sydney [www.transport.nsw.gov.au/performance-and-analytics/passenger-travel/surveys/household-travel-survey-hts/sydney-gma-regions]
Walsh S, 2008, Climate Change and Ozone Project: Stage 1 Project Report, May 2008, Internal Environment Protection Authority Victoria report, Melbourne
WHO 1998, Urban Traffic Pollution, Schwela D and Zali O (eds), World Health Organization, Spon Press, Routledge, London
WHO 2012, Media Release No. 213, IARC: Diesel Engine Exhaust Carcinogenic, International Agency for Research on Cancer, World Health Organization, Lyon, France [www.iarc.fr/wp-content/uploads/2018/07/pr213_E.pdf]
WHO 2013a, Media Release No. 221, IARC: Outdoor air pollution a leading environmental cause of cancer deaths, International Agency for Research on Cancer, World Health Organization, Lyon, France [www.iarc.fr/wp-content/uploads/2018/07/pr221_E.pdf ]
WHO 2013b, Review of evidence on health aspects of air pollution – REVIHAAP project: Final technical report, World Health Organization, WHO Regional Office for Europe, Copenhagen [www.euro.who.int/en/health-topics/environment-and-health/air-quality/publications/2013/review-of-evidence-on-health-aspects-of-air-pollution-revihaap-project-final-technical-report]