
Summary
Following the Black Summer bushfires it is estimated 31% of the ecological carrying capacity of native vegetation in NSW remains, compared to pre-European settlement. The rate of loss of vegetation in NSW due to clearing has steadily increased since 2015.
Why native vegetation matters
Native vegetation provides essential habitat for plant and animal species, and is an integral component of healthy, functioning ecosystems. For tens of thousands of years, First Nations peoples have been stewards of the natural landscape which helped to shape the biodiversity and character of our Country.
Clearing of native vegetation, and the destruction of habitat that is associated with it, has been identified as the single greatest threat to biodiversity in NSW ().
NSW indicators
| Indicator and status | Environmental trend |
Information reliability |
|
|---|---|---|---|
| Permanent clearing rate for woody native vegetation |
|
Getting worse | ✔✔✔ |
| Extent of native vegetation |
|
Getting worse | ✔✔✔ |
| Condition of native vegetation |
|
Getting worse | ✔✔ |
| Ecological carrying capacity |
|
Getting worse | ✔✔ |
| Levels of pressure on the condition of native vegetation |
|
Stable | ✔ |
Notes:
Terms and symbols used above are defined in .
Status and Trends
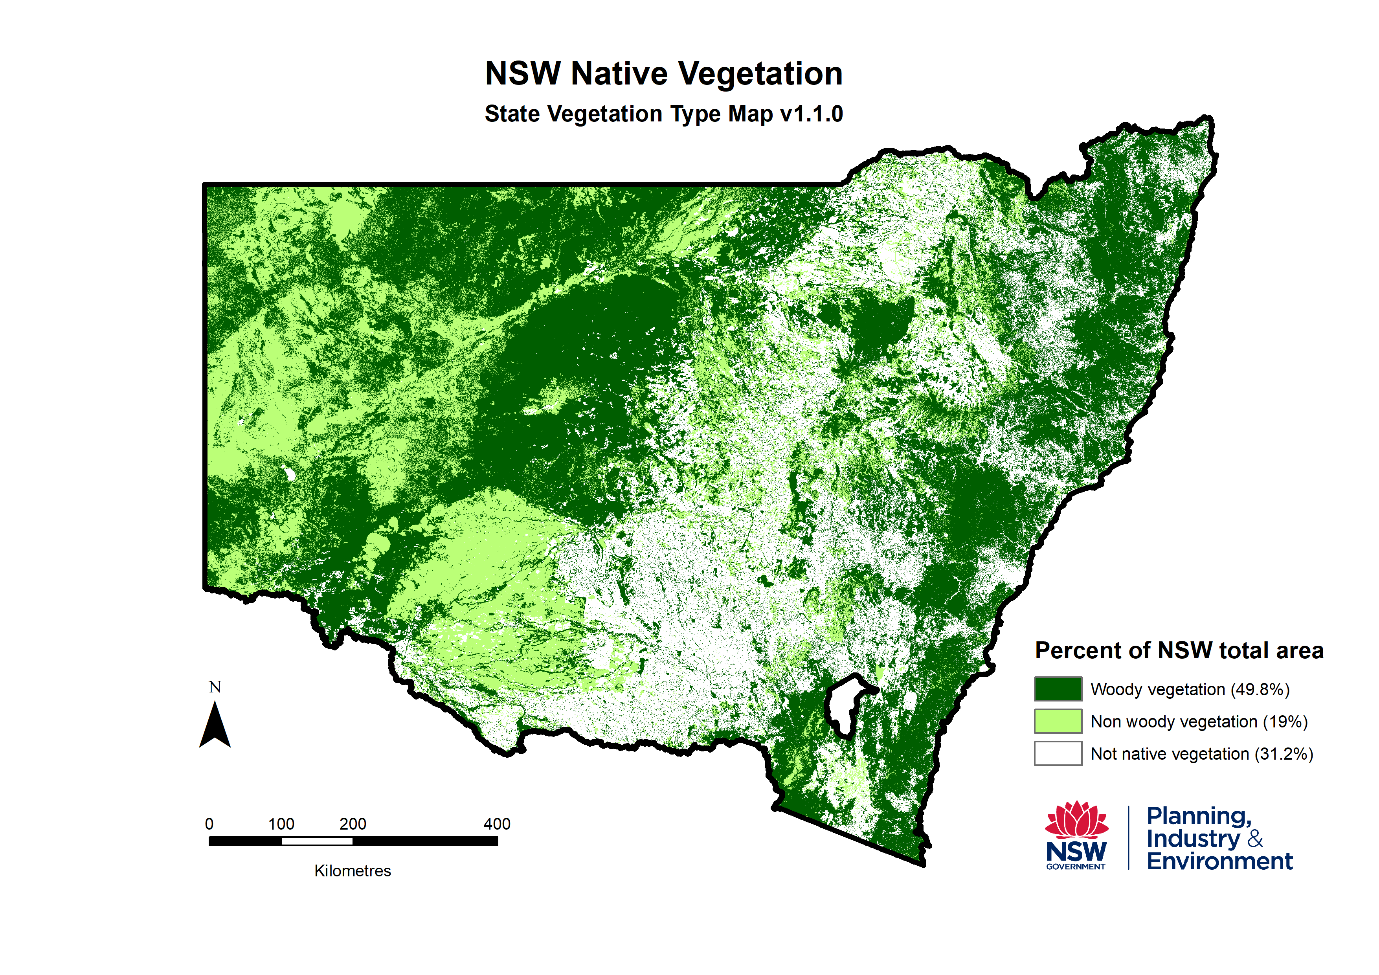
The state has 49.8% woody native vegetation cover and 19% non-woody vegetation cover in which the structure has not been substantially altered. Woody vegetation includes heathlands, forests, woodlands and shrublands higher than two metres. Non-woody vegetation includes grasses, small shrubs, herbs and groundcover. While structurally intact, vegetation condition across both woody and non-woody extents is declining largely due to the effects of different land uses and land management practices.
Habitats in National Parks and Wildlife (NPWS) reserves across the State remain relatively intact, with 63% of their original ecological carrying capacity remaining. Habitats in all other land tenures retain only 30% of their original ecological carrying capacity, but areas of native vegetation are also being protected through private land conservation.
The pattern of habitat loss and degradation varies between bioregions and across tenures. Habitat in the Australian Alps, South East Corner and NSW North Coast bioregions has remained the most intact relative to other bioregions with 53% to 62% of their original ecological carrying capacity remaining. Land has been used more intensively in the NSW South Western Slopes, Brigalow Belt South and Riverina bioregions, resulting in less remaining and more fragmented habitat relative to other bioregions, and therefore, less remaining ecological carrying capacity overall (15% to 25%).
The Black Summer bushfires of the spring and summer 2019–20 altered large areas of habitat for species and ecosystems in NSW. Following the fires in 2020, overall ecological condition and ecological carrying capacity for NSW both decreased by 2%, to 42% and 31% respectively. Within the immediate fire ground, ecological condition decreased from 72% in 2013 to 44%, a 39% reduction, while ecological carrying capacity decreased from 62% to 38%, a 24% reduction. The longer term impacts are still being assessed and the recovery process will continue for many years.
Spotlight figure 13a: Permanent clearing of woody vegetation each year in NSW 2009–2019
Notes:
Rate of permanently removal of woody vegetation from DPIE analysis of satellite imagery to classify landcover types. Satellite imagery used for this analysis was captured by SPOT and Sentinel 2 remote sensing.
Spotlight figure 13b: Non-woody vegetation clearing on regulated land
Notes:
Regulated land is where authorisation may be required from Local Land Services for native vegetation clearing. This category makes up around 54% of land in NSW. The non-woody vegetation removal figures above depict only clearing that occurs on Category 2 regulated land. Additional clearing of non-woody vegetation, on excluded or category 1 exempt land, has not been included. Landholders also have a range of allowable clearing activities available to them for use without approval from Local Land Services.
Pressures
Land clearing is listed as a key threatening process under the Biodiversity Conservation Act 2016. The rate of permanent clearing of woody vegetation in NSW has been steadily increasing since 2015, with a slight decrease in 2019, the most recent reporting year. Precautions built into NSW legislation include limits on allowable land clearing, offset requirements, and government investment in private land conservation (see next section).
The average rate of permanent clearing over seven years from 2009 to 2015 was 13,028 hectares per year (Spotlight figure 13a). In area, 26,200 hectares of woody vegetation was permanently cleared in 2016, the year before the new regulatory framework (Biodiversity Conservation Act 2016) came into effect in August 2017. The subsequent rate of permanent clearing from 2017 to 2019 was 34,933 hectares per year on average. Some of this included agricultural clearing approved under the previous native vegetation framework.
In 2019, 46,300 hectares of non-woody vegetation was cleared on Regulated Land, and 54,760 hectares in 2018 (Spotlight figure 13b).
Land use changes and intensifying land use place significant pressure on the condition of remnant native vegetation. Other pressures on condition, which are likely to remain for the foreseeable future, include long-term effects of fragmentation, increasing threats from invasive species and worsening elements of climate change including impacts of fires. Native forest harvesting results in temporary vegetation change, but is not classified as land clearing because there is an acknowledgment that all harvested areas must be regrown.
Responses
Programs of restoration and revegetation are occurring at local and regional levels to enhance the extent and condition of native vegetation. However, there is a net loss of vegetation because these programs are not restoring native vegetation at the rate of permanent clearing.
In 2017, the NSW Government introduced the land management and biodiversity conservation framework, which included the new Biodiversity Conservation Act 2016 and amendments to the Local Land Services Act 2013. A new biodiversity offsets framework was also introduced. The Biodiversity Offsets Scheme establishes a framework to avoid, minimise and offset the impacts on biodiversity from development or clearing. The NSW Biodiversity Values Map identifies land with high biodiversity value that is particularly sensitive to impacts from development and clearing.
The Biodiversity Offsets Scheme and the Biodiversity Conservation Trust’s private land conservation program have been introduced to encourage landholders to protect and conserve biodiversity and vegetation habitat on private land. The Biodiversity Conservation Act 2016 also enables the Minister for the Environment to declare Areas of Outstanding Biodiversity Value. These are special areas that contain irreplaceable biodiversity values that are important to the whole of NSW, Australia or globally.
The pressures that affect vegetation condition are likely to continue in the foreseeable future and the Government will conduct a statutory five-year review of the land management and biodiversity conservation framework commencing in 2022. The Government’s ongoing monitoring of land clearing rates, the Biodiversity Indicator Program and the five-year review are opportunities to monitor the impacts and risks of land clearing on biodiversity.
Related topics: | |
Context
NSW contains a great variety of native vegetation, including some outstanding areas of rainforests, eucalypt forests and woodlands, alpine grasslands, wetlands, coastal heaths, alpine habitats and arid shrublands. Native vegetation provides essential habitat for plant and animal species, and is an integral component of healthy, functioning ecosystems.
Since the State of the Environment 2018, the Department of Planning, Industry and Environment, in partnership with CSIRO, the Australian Museum and Macquarie University, has developed new indicators for measuring the ecological integrity of vegetation habitat as part of the Biodiversity Indicator Program ().
The description of vegetation in NSW in this topic draws on the State Vegetation Type Map Version 1.1 Pre-Release which provides detailed regional scale plant community type mapping. This report acknowledges that it is the best information available, with some inherent limitations. In early 2022, the Department of Planning, Industry and Environment will be publishing a statewide map of Plant Community Types.
This topic is only concerned with the state of land-based vegetation. Freshwater aquatic vegetation is considered in the and topics, and coastal and marine vegetation is considered in the topic.
Status and Trends
Extent of Vegetation
Information on the extent of native vegetation in NSW was compiled from the NSW State Vegetation Type Map V1.1 Pre-release, which uses best available aerial and satellite imagery and a collection of environmental variables to map plant community types for NSW (). A summary of the outcomes of this analysis is displayed below in Table 13.1 and distribution across the State is shown in Map 13.1.
Table 13.1: Extent of vegetation in NSW
| Vegetation extent category | Description | Area (% of State) |
|---|---|---|
| Woody Native | Woody native vegetation (woody trees and shrubs over 2 metres tall and 20% canopy cover) in which the structure has not been substantially altered | 49.8% |
| Non woody native | Non woody native vegetation in which the structure has not been substantially altered. | 19% |
| Non-native/other | Non-native vegetation (crops, plantations, pasture) or other non-vegetative land cover including derived native cover, built, urbanise and non-vegetated land | 31.2% |
Map 13.1: Map of vegetation extent in NSW
Extent of intact native vegetation
The extent to which different vegetation types remain structurally intact is due to the differing rates of clearing, largely historical, that have occurred across various parts of the State. While structurally intact, vegetation condition across both woody and non woody extents is diminishing.
Generally, flat productive lands have been favoured for development, with particularly high rates of historical clearing in coastal lowland rainforest, natural native grasslands, grassy woodlands, coastal wetland and coastal floodplain forests. Some other native vegetation formations, such as arid shrublands and alpine areas, occur on land that is less attractive for development, so have experienced little change in extent.
Some representative areas of native vegetation have been protected in national parks and nature reserves. Since 2018 the area of reserves has increased by over 300,000 hectares. The representativeness and comprehensiveness of formal protected areas in NSW is improving with significant additions to underrepresented areas, but some bioregions and vegetation classes are still underrepresented, particularly in the central and western regions. Areas of native vegetation have also been protected through private land conservation.
The status of intact native vegetation formations in NSW is summarised in Table 13.2 below.
Table 13.2: Extent of clearing of native vegetation formations in NSW since 1750
| Vegetation formation | Status |
|---|---|
| Native grasslands | Extensively cleared or modified with only eco-fragments remaining across the known range on North-West slopes, Hunter, Northern Tableland, Southern Tablelands and Riverina. Darling River grasslands are largely intact. Impacts from overgrazing including reduced condition are widespread. |
| Grassy woodlands | Grassy woodlands have been historically cleared with less than 10% of some classes remaining. A recent resurgence in clearing and grazing pressure is significantly accelerating loss of remaining extent and condition. Fragmentation and loss of understorey is widespread and substantial. |
| Inland Floodplain Forests | Largely intact due to heavy soils although grazing pressure continues to diminish ground cover communities. |
| Rainforests | Littoral rainforests and other low land coastal rainforests have historically been extensively cleared. Other classes of rainforests occurring in more rugged terrain are largely intact, although changes in structure and species composition have occurred in areas with a history of timber harvesting. The 2019-2020 Black Summer fires significantly impacted the eastern seaboard rainforests where no fire had ever been previously recorded. |
| Dry sclerophyll forests | Less cleared overall, although some substantial coastal areas have been lost due to historical clearing. However a recent resurgence in land clearing is accelerating loss and condition. Levels of depletion are significant in some forestry-related classes. |
| Wet sclerophyll forests | Less cleared although levels of depletion are substantial in some forestry-related classes and coastal locations. |
| Coastal floodplain forest | Substantially cleared and modified in the coastal zone but more intact in the coastal hinterland. Under pressure from coastal development. |
| Wetlands | The historical extent of wetlands is largely intact except in the coastal zone where modification for agriculture has been extensive and substantial. Large inland wetlands continue to be impacted by altered drainage, irrigation demands and water regulation. |
| Inter-tidal vegetation | Substantially intact although there have been significant loss historically to mangrove communities from coastal development. |
| Semi-arid tall shrublands | Have undergone low to moderate levels of clearing (10-60%), although this has increased in recent decades with conversion to dryland cropping. Overall condition is diminishing due to grazing pressures from agriculture and feral animals. |
| Chenopod shrublands | Still largely intact as they are generally less suitable for agriculture although there has been significant historical reduction in range due to irrigation schemes in the Riverina. |
| Heathlands | Still largely intact as they are generally less suitable for development |
| Alpine complex | Still largely intact as they have been progressively conserved since the 1940s within the national park estate. |
The remaining non-native/other category listed in Table 13.1 (31.2% of NSW) describes native vegetation that has been extensively modified so that it is no longer structurally intact or forms a natural community, non-native vegetation, or there is no vegetation cover at all.
Habitat condition and carrying capacity
Where native vegetation remains, its condition varies from close to natural if undisturbed, to degraded where it has been heavily disturbed. The condition of native vegetation has been modified to varying degrees by the effects of land management practices and unplanned threats such as weed invasion, drought and fire. The impacts of these threats include:
- changes to the structure, ecological function and species composition of native vegetation
- lower rates of regeneration and reduced vigour
- prevalence of parasites, pathogens and diseases
- presence of weeds and pests.
The combined effect of these impacts is diminished habitat values and impaired ecosystem processes. Declines in vegetation condition are generally less immediately visible than vegetation removal and tend to occur over longer timeframes, making them more difficult to monitor and assess.
The NSW Biodiversity Indicator Program includes the 'Habitat condition' indicator family, which measures the capacity of habitat to support native plants, animals, and ecological communities by providing the resources they need as individuals and in groups (). Habitat that is in better condition and less fragmented is more capable of supporting healthy ecosystems and a wider range of native species.
Well-functioning connectivity allows species to forage easily for food and shelter, find mates, disperse (both fauna and flora) and migrate. Habitat that is better connected to neighbouring habitats is more effective in supporting its native plants, animals and ecosystems. However, habitat with high ecological condition may not have high ecological connectivity or ecological carrying capacity if its surrounding habitat is highly fragmented. Conversely, habitat with low to moderate ecological condition may have high ecological connectivity if it contributes to important connections (corridors or stepping-stones) between other habitats.
The three habitat condition indicators measure different aspects of habitat function:
- Ecological condition of terrestrial habitat. The quality of habitat at each location.
- Ecological connectivity of terrestrial habitat. How well a particular location's connectivity contributes to ecological carrying capacity (e.g. as part of a habitat corridor or as a stepping-stone).
- Ecological carrying capacity of terrestrial habitat. The ability of habitat to support native species and ecosystems, estimated using the amount and quality of habitat (i.e. ecological condition) as well as its connection to, and condition of, surrounding habitat.
Their status is reported as a percentage relative to pre-European settlement. These indicators are calculated from remote-sensing imagery of land cover, land-use mapping and other relevant spatial data and mapping to estimate the extent of habitat loss. Spatial modelling is used to assess the ecological process implications of habitat loss and fragmentation.
A fourth indicator in this family - ecosystem function of terrestrial vegetation - is under development, initially as a regional case study. This indicator will measure the functional integrity of eco-physiological processes of terrestrial plants that cycle carbon, water, energy and nutrients.
2013 Baseline
The NSW Biodiversity Outlook Report, Results from the Biodiversity Indicator Program: First assessment () provided a baseline assessment of the available habitat condition indicators at 2013, prior to the introduction of the new Land Management and Biodiversity Conservation Framework which commenced in August 2017 (see Responses).
The loss and alteration of habitat that has occurred from European settlement up to 2013 has directly reduced the ecological condition of habitat in New South Wales from its original level (100%) to 44% of that level.
Since 2013 to present the ongoing, indirect effects of loss, alteration and fragmentation of habitat, have further reduced the average ecological carrying capacity of remaining habitats in New South Wales to 33%.
Maps showing the spatial patterns of ecological condition, connectivity and ecological carrying capacity across NSW are presented in Map 13.2a, Map 13.2b and Map 13.2c below.
Map 13.2a: Ecological condition of terrestrial habitat in NSW*, 2013
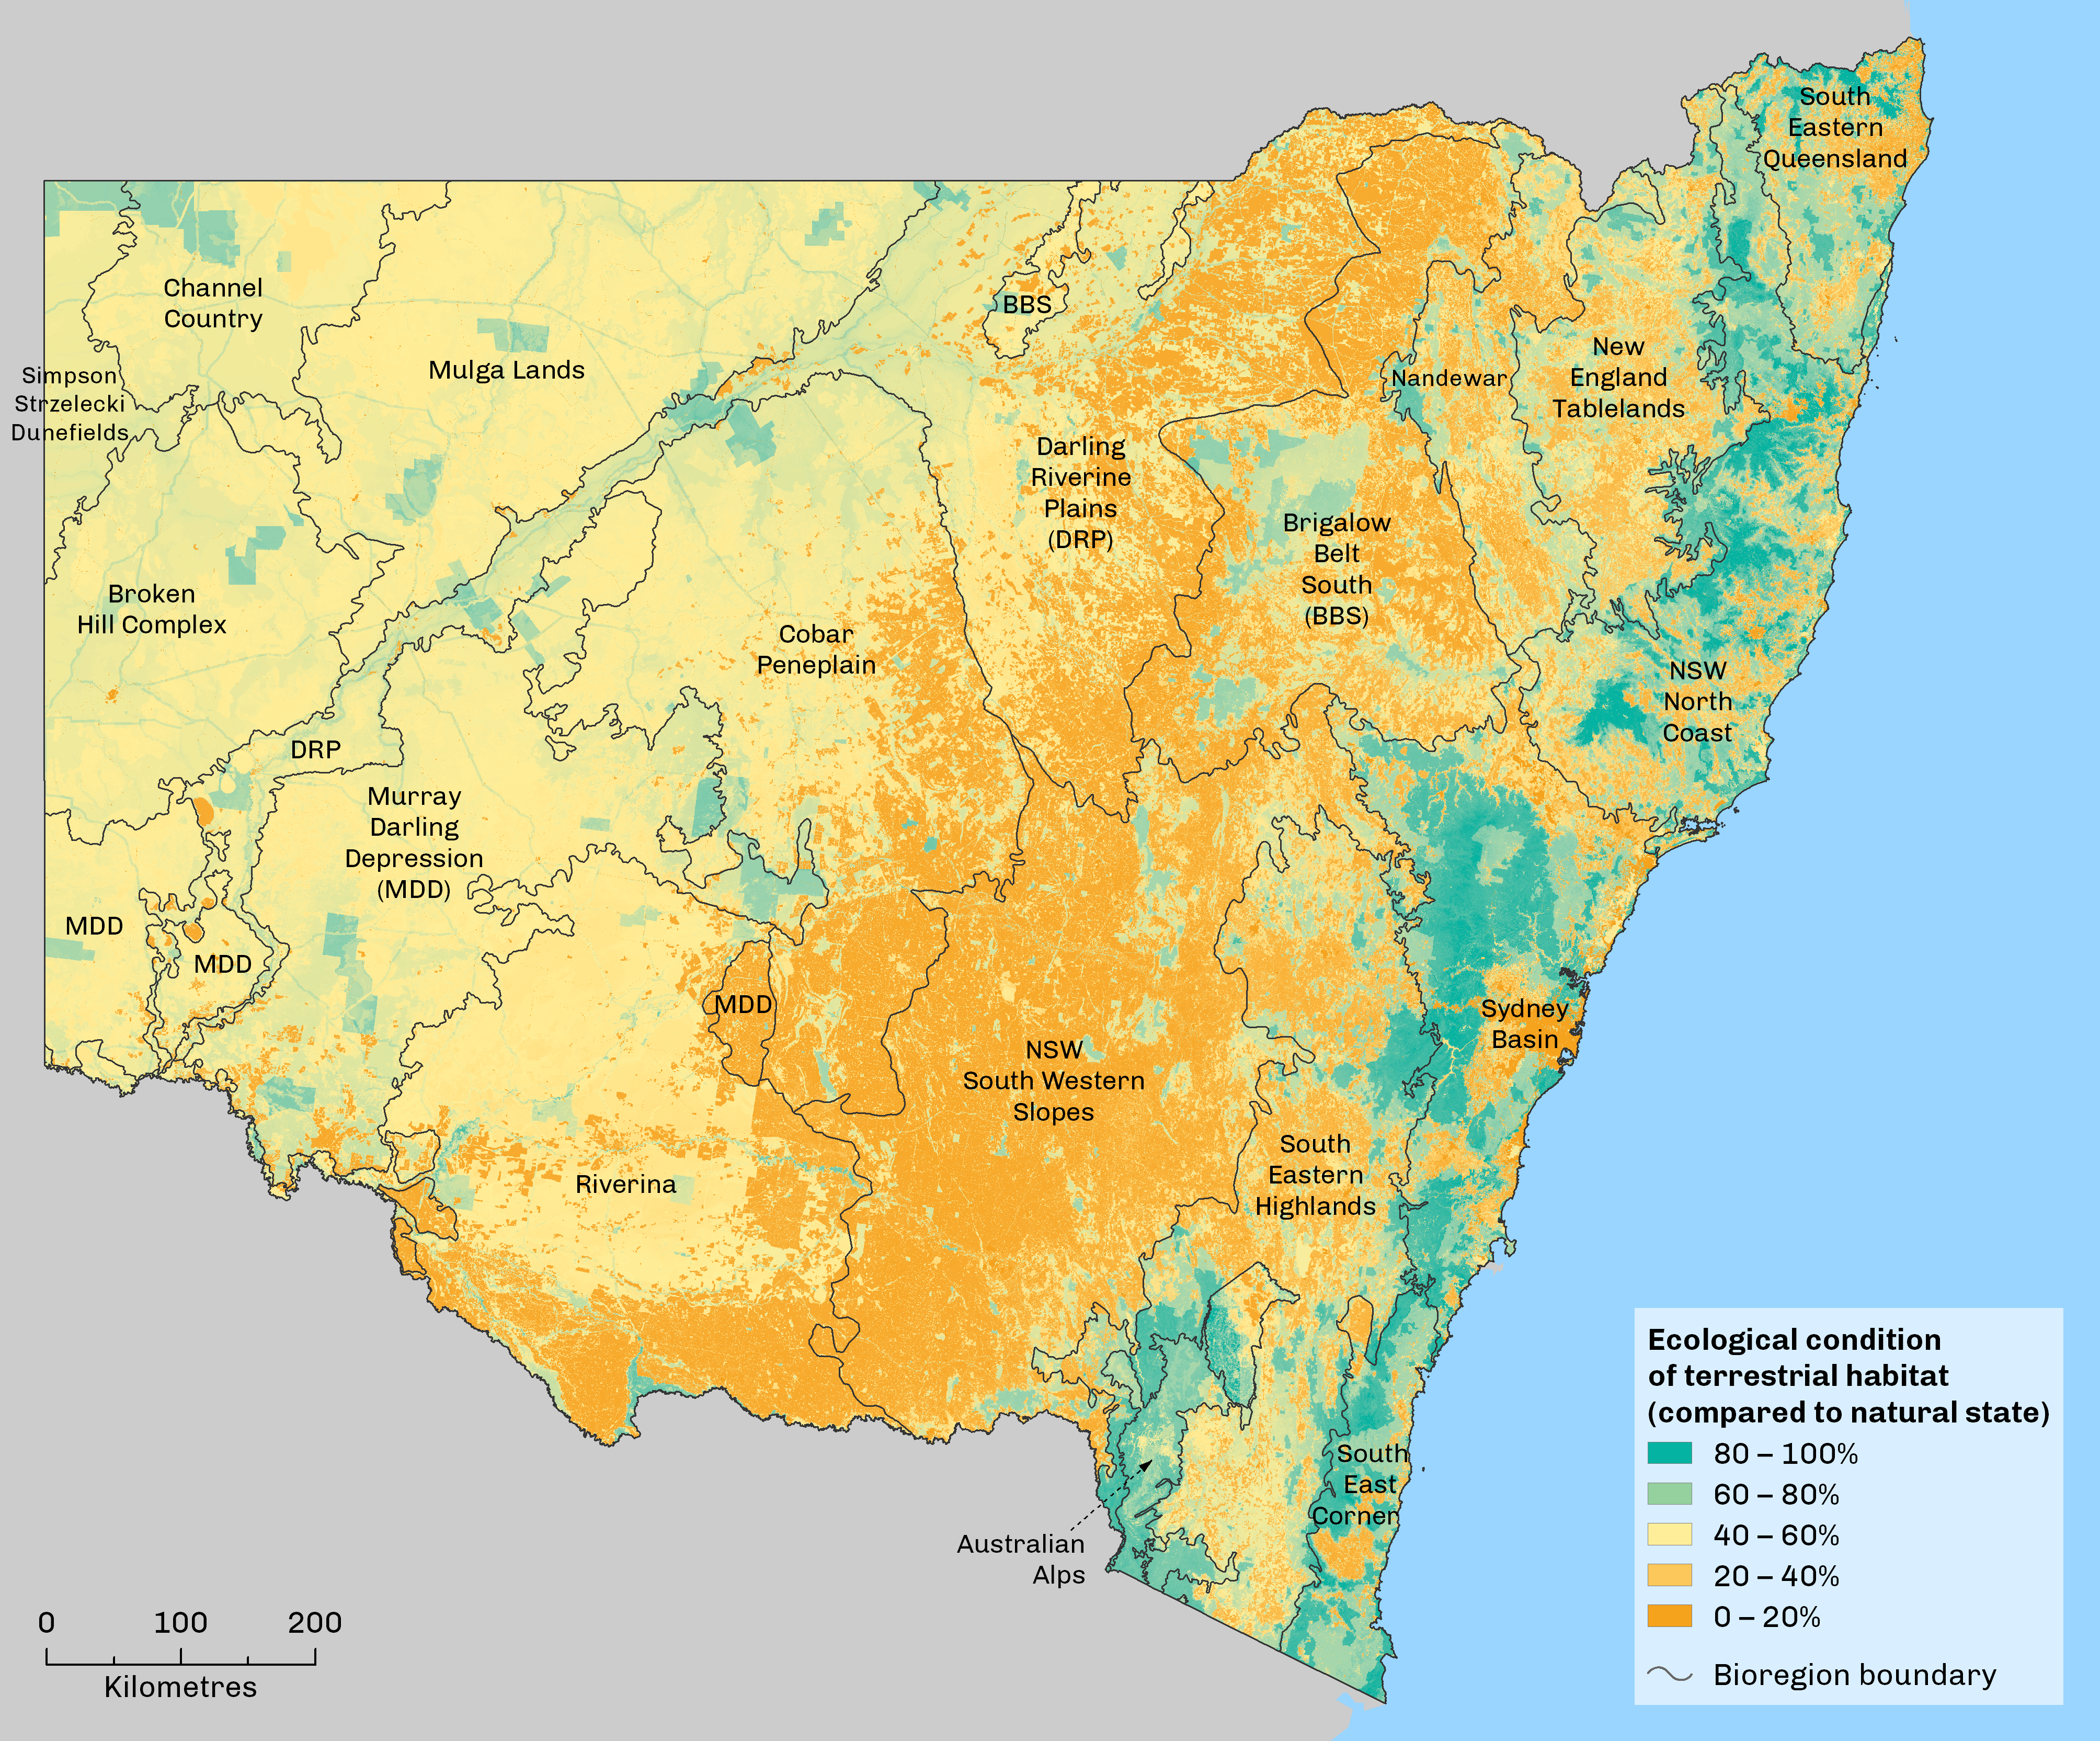
Notes:
*Results are a percentage relative to pre-European settlement
Map 13.2b: Ecological connectivity of terrestrial habitat in NSW*, 2013
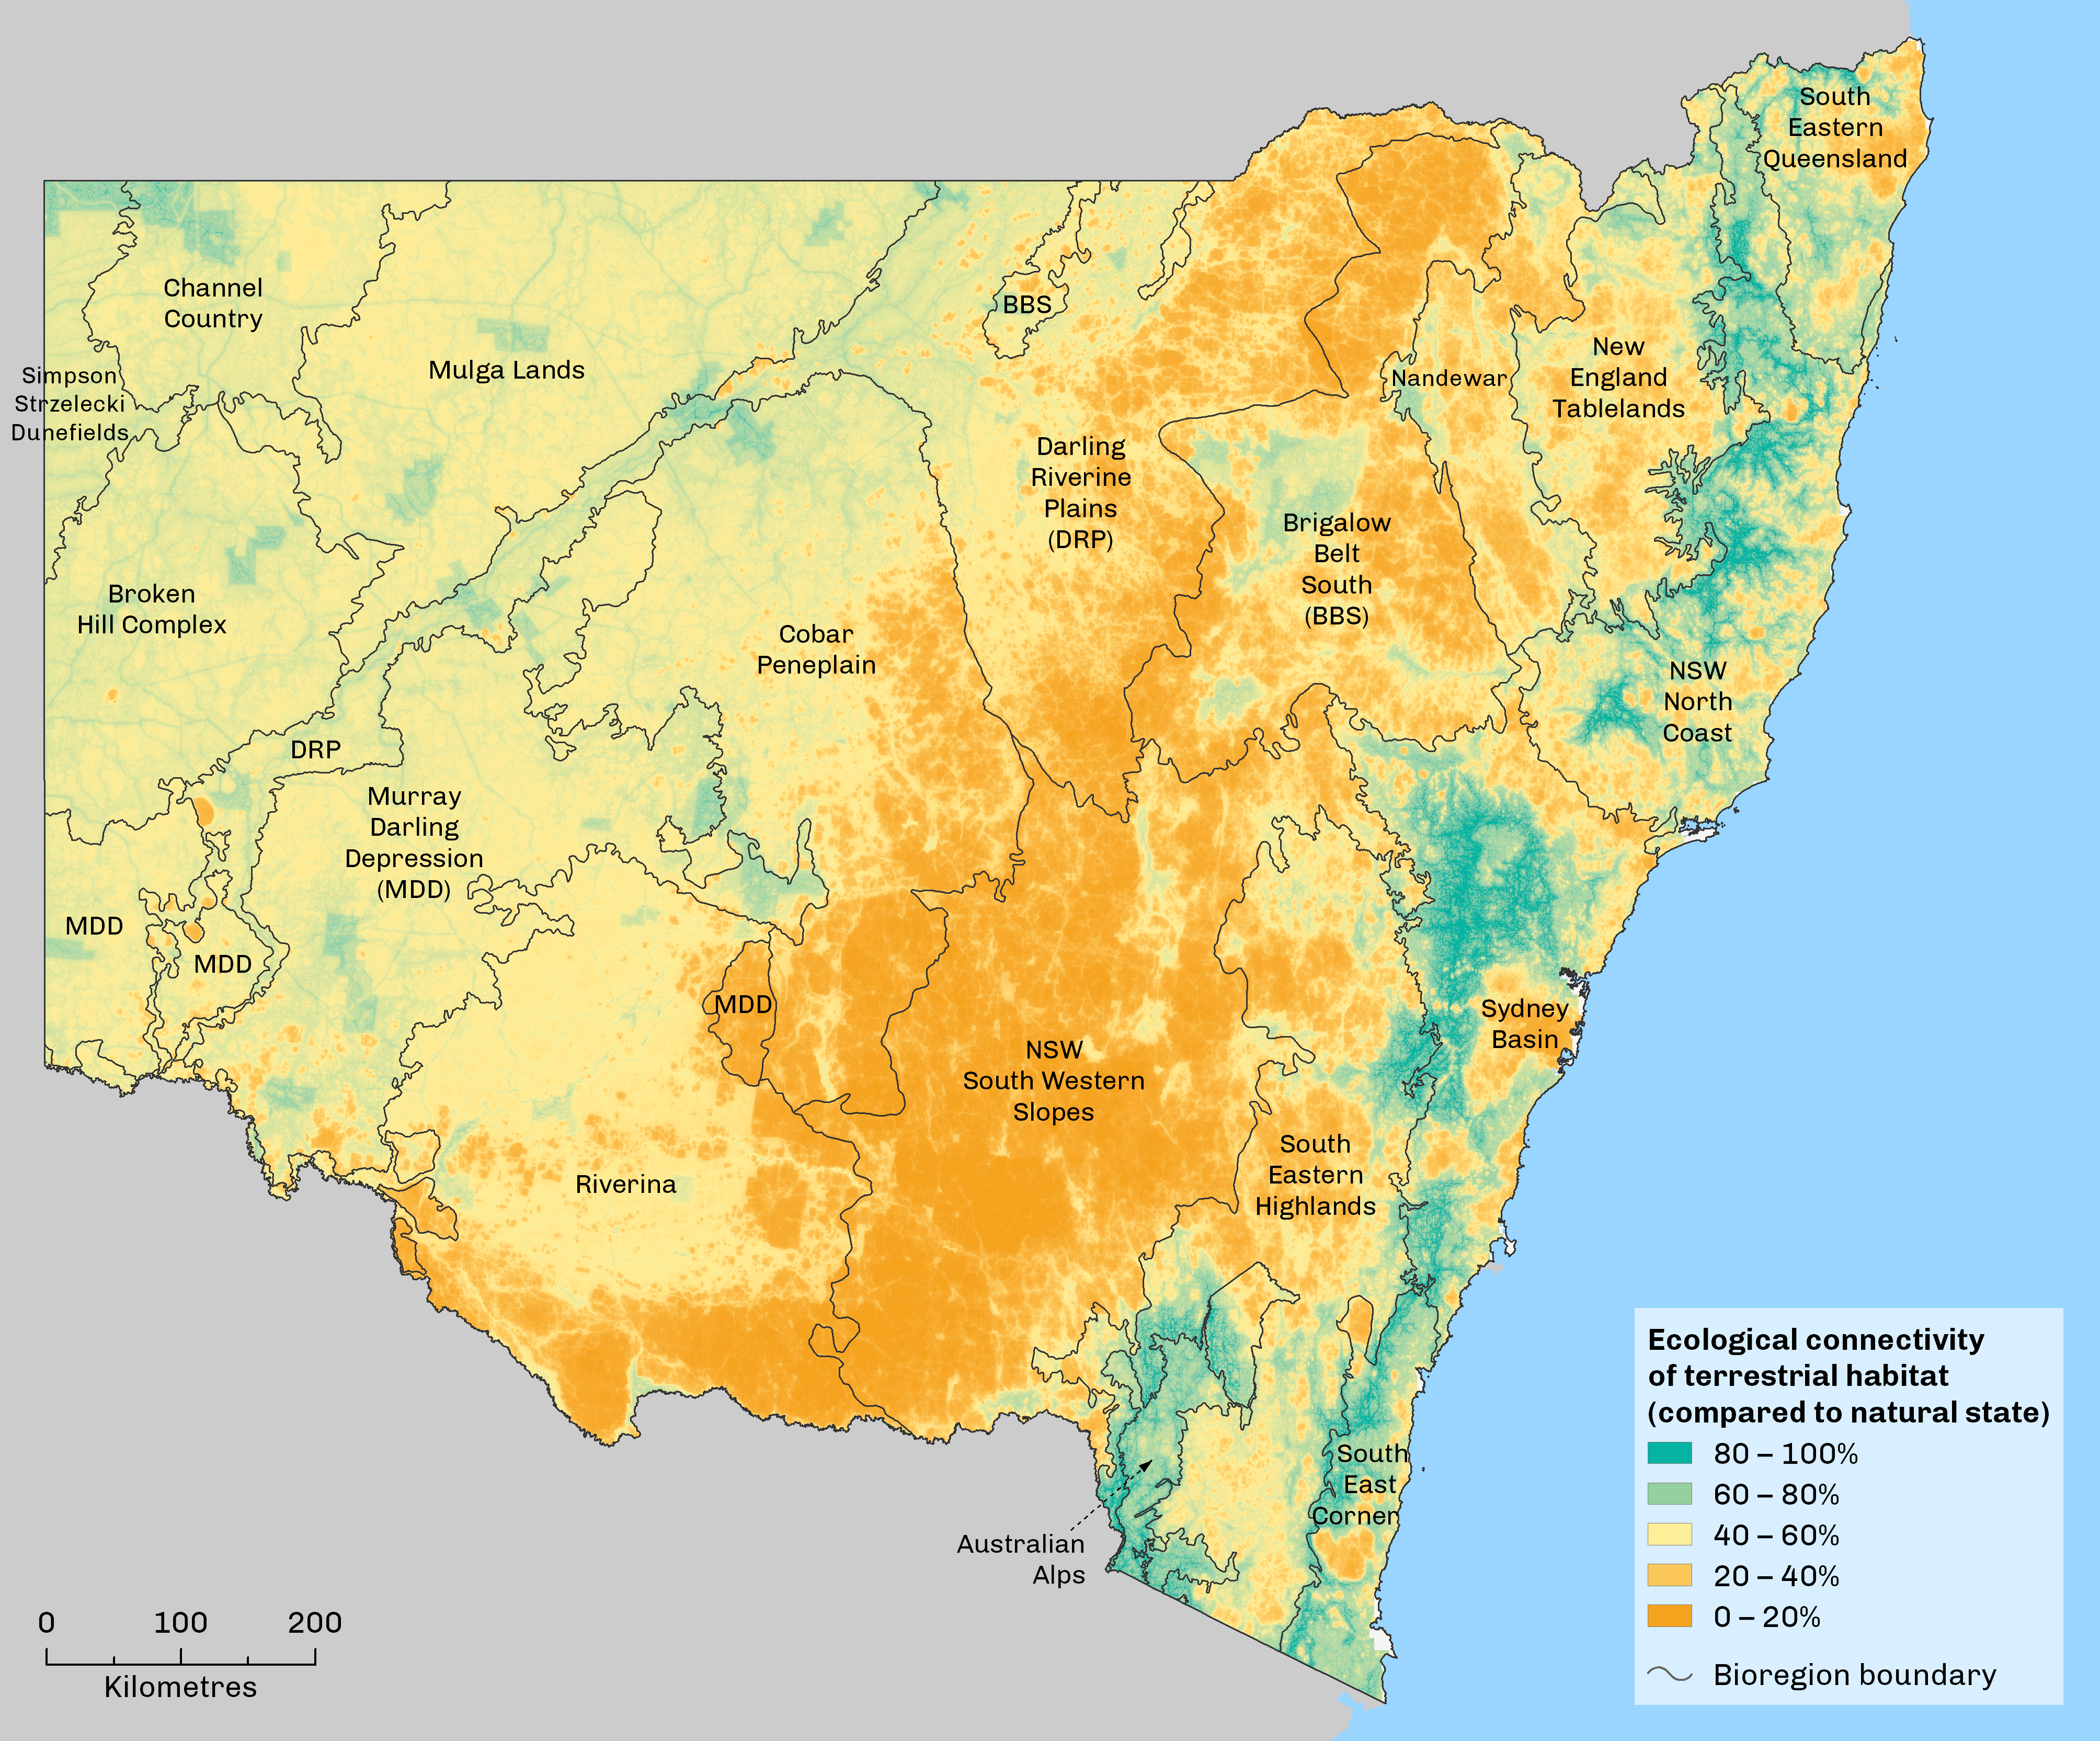
Notes:
*Results are a percentage relative to pre-European settlement
Map 13.2c: Ecological carrying capacity of terrestrial habitat in NSW*, 2013
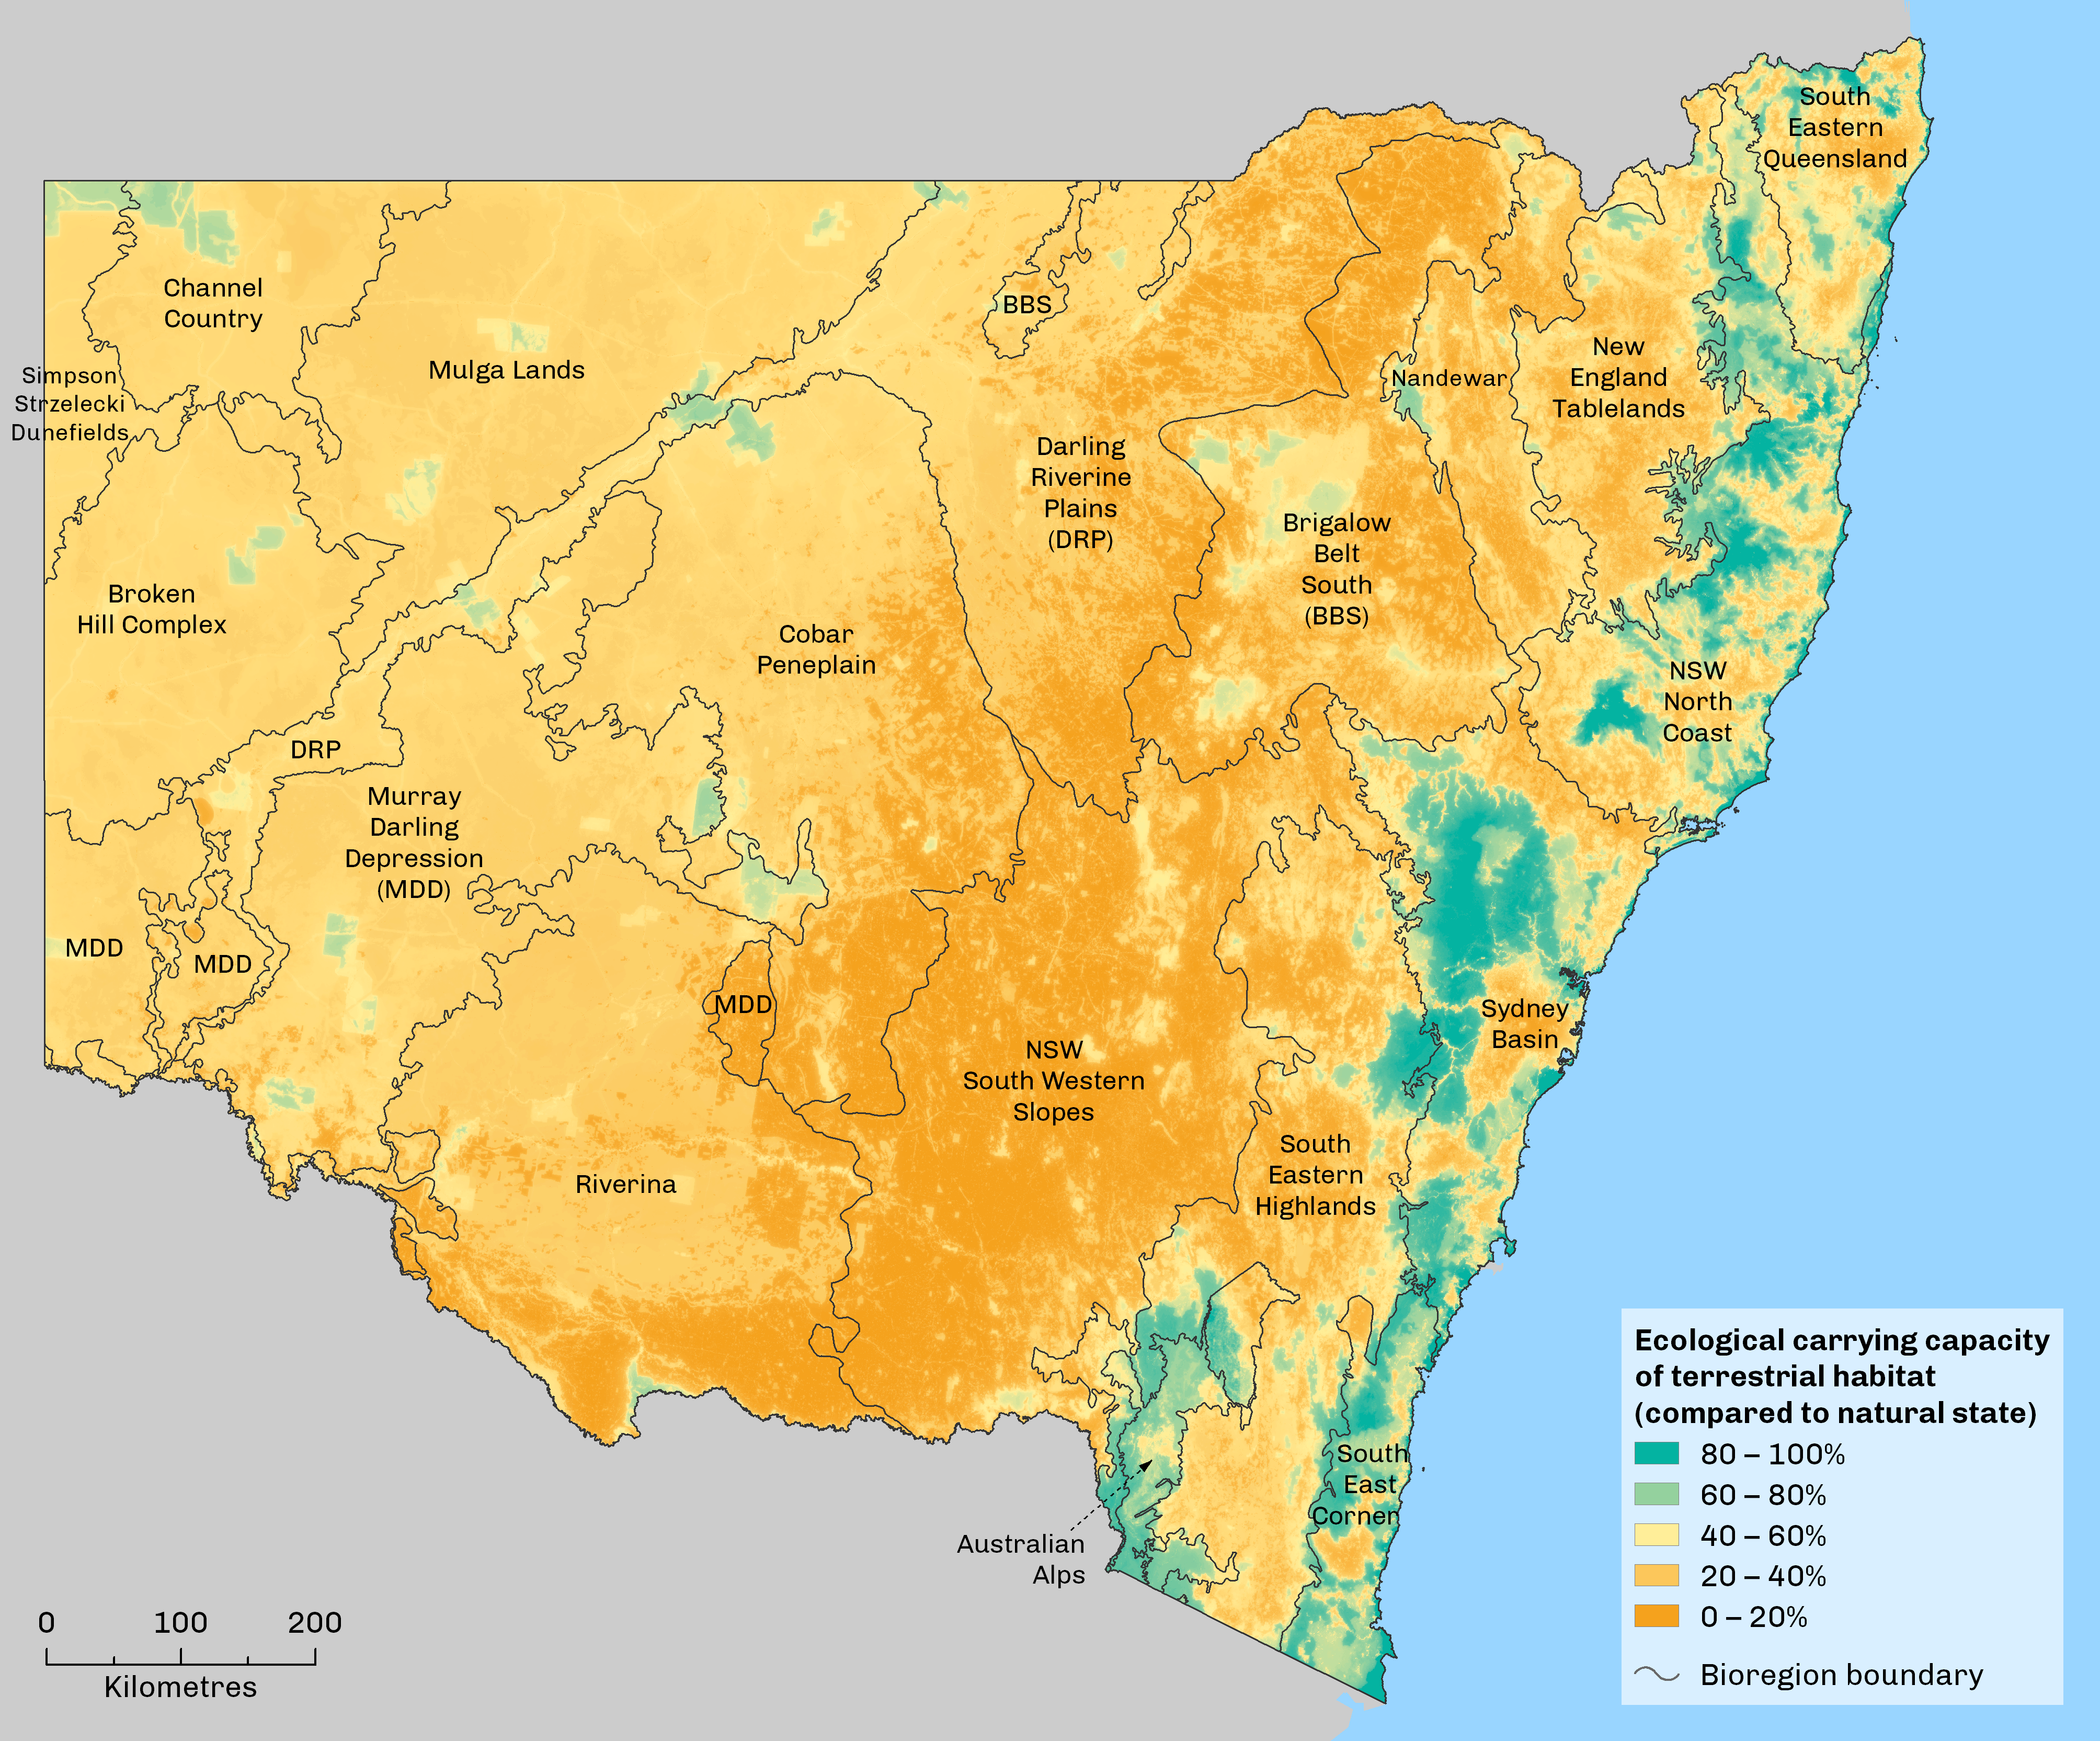
Notes:
*Results are a percentage relative to pre-European settlement
Bioregions (an abbreviation of 'biogeographic regions') are large regions of relatively similar climate, geology and landforms. Each bioregion supports a suite of native vegetation, plants and animal communities that are distinctive from those in adjoining regions. The Interim Biogeographic Regionalisation (IBRA) framework divides the Australian landmass into 89 bioregions, 18 of which are in mainland New South Wales.
The pattern of habitat loss and degradation varies between bioregions (see Figure 13.1). Habitat in the Australian Alps, South East Corner and NSW North Coast bioregions has remained the most intact relative to other bioregions with 53% to 62% of their original ecological carrying capacity remaining. Land has been used more intensively in the NSW South Western Slopes, Brigalow Belt South and Riverina bioregions, resulting in less remaining and more fragmented habitat relative to other bioregions, and therefore, less remaining ecological carrying capacity overall (15% to 25%).
Patterns of fragmentation and loss of ecological condition also vary across tenures. Habitats in National Parks and Wildlife (NPW) reserves across the State remains relatively intact, with 63% of their original ecological carrying capacity remaining. Habitats in all other land tenures retain only 30% of their original ecological carrying capacity.
Figure 13.1: Pattern of habitat loss and degradation varies between bioregions
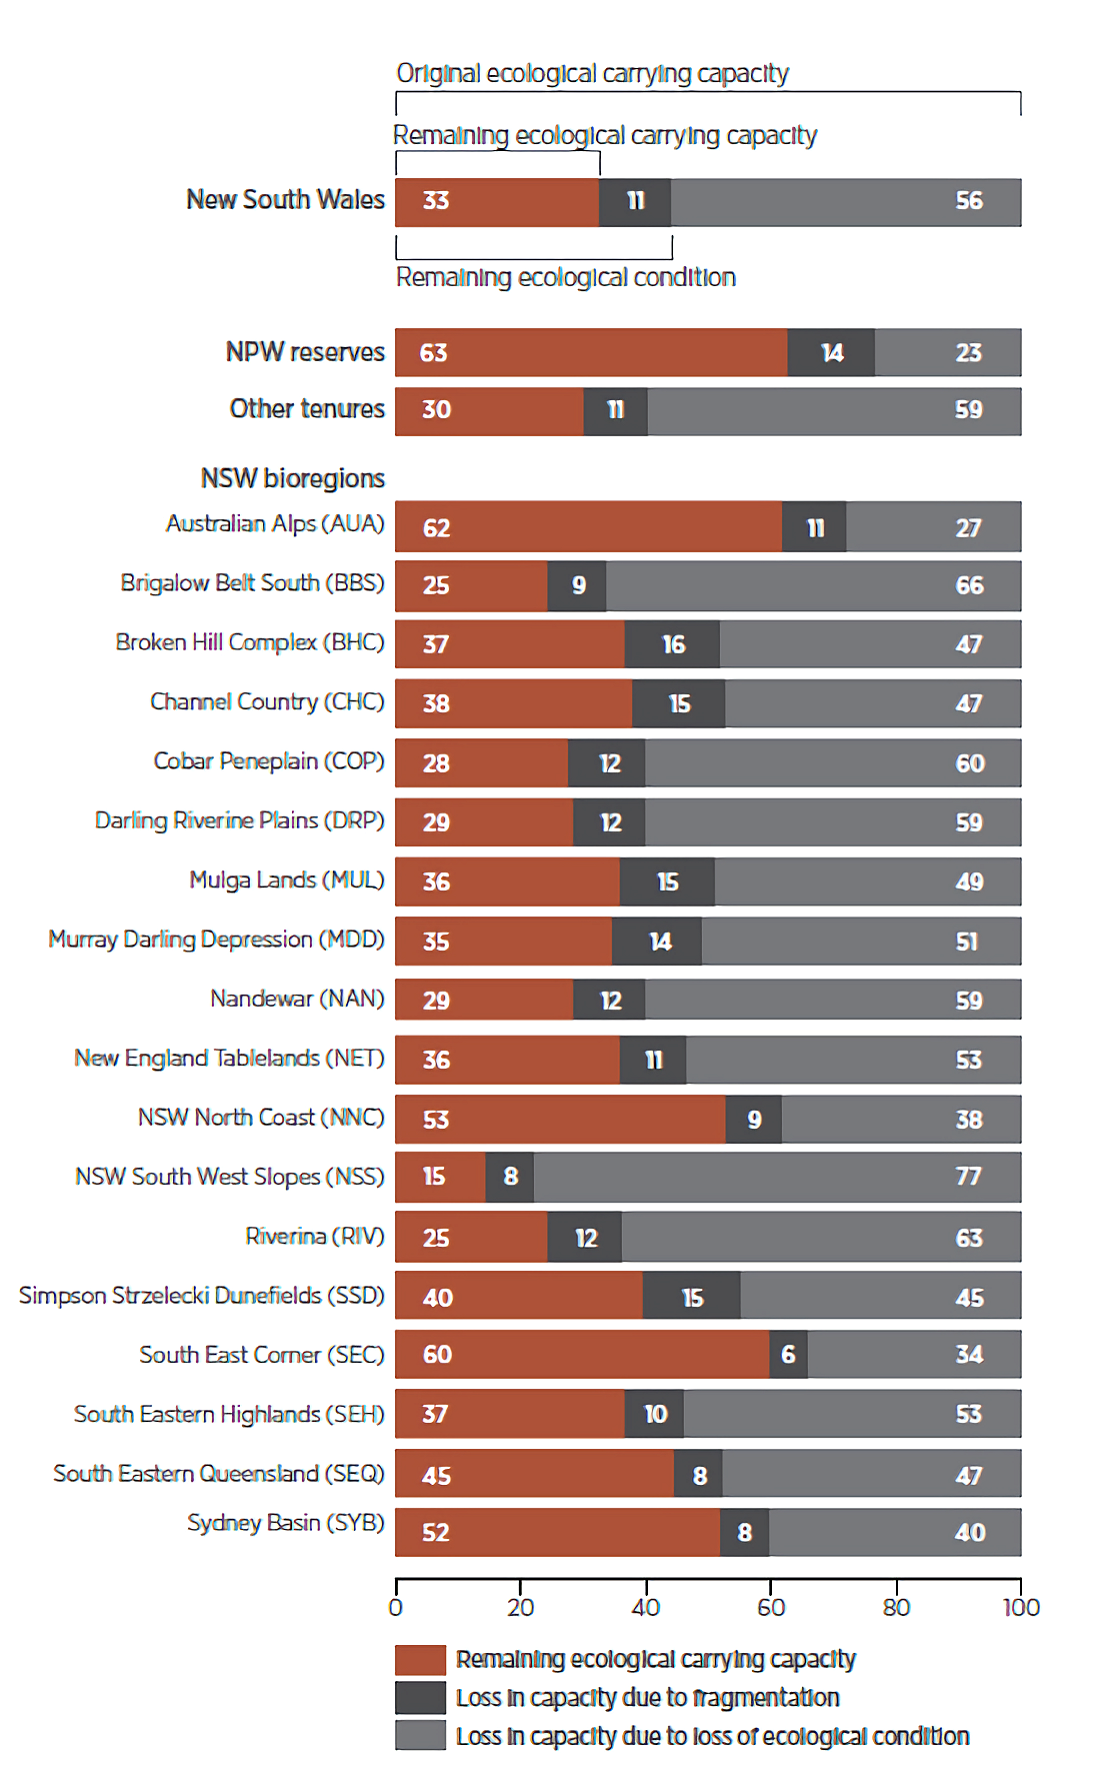
Notes:
Remaining ecological carrying capacity (brown) due to loss of ecological condition (light grey), and additional loss of capacity due to fragmentation (dark grey), for all of New South Wales.
Impacts of Black Summer Bushfires
The Black Summer bushfires of the spring and summer 2019–20 altered large areas of habitat for species and ecosystems in NSW (see topic). Information on fire extent and severity, coupled with modelling of the consequences of burning for different vegetation formations, was used to recalculate the 2013 outcomes for habitat condition and ecological carrying capacity ().
Following the fires in 2020, ecological condition within the mapped fire ground decreased from 72% in 2013 to 44%, a 39% reduction, while ecological carrying capacity decreased from 62% to 38%, a 24% reduction. These impacts that occurred within the fire ground reduced overall ecological condition and ecological carrying capacity across NSW by 2%, to 42% and 31% respectively (see Table 13.3).
Table 13.3: Ecological condition and carrying capacity: 2013 baseline levels and post-Black Summer Bushfires
| Year | Ecological Condition | Ecological Carrying Capacity | Confidence |
|---|---|---|---|
| 2013 | 44% | 33% | Somewhat adequate1 |
| 2020 | 42% | 31% | Limited |
Notes:
1Confidence is based on 5 qualitative categories:
- Adequate = high-quality evidence and high level of consensus,
- Somewhat Adequate = high-quality evidence or high level of consensus,
- Limited = limited evidence or limited consensus,
- Very Limited = limited evidence and limited consensus,
- Low = Evidence and consensus too low
This assessment reflects the immediate effects post-fire on vegetation condition. With sufficient rainfall, post-fire regeneration and regrowth can be rapid in the first six months, then continue slowly over subsequent years. These indicators can be recalculated in the future to incorporate natural regeneration and regrowth. The next Biodiversity Outlook Report is planned for publication in 2022.
Pressures
Pressures on vegetation extent
Land clearing
Clearing of native vegetation, and the destruction of habitat that is associated with it has been identified as the single greatest threat to biodiversity in NSW (). Clearing of native vegetation is also listed as a key threatening process under the Biodiversity Conservation Act 2016.
Clearing native vegetation has numerous environmental impacts, including:
- irreversible destruction of habitat causing a loss of biological diversity, and may result in total extinction of species or loss of local species
- fragmentation of populations resulting in limited gene flow between small isolated populations, reduced potential to adapt to environmental change and loss or severe modification of the interactions between species
- riparian zone degradation, such as bank erosion leading to sedimentation that affects aquatic communities
- loss or disruption of ecological function
- increased greenhouse gas emissions from clearing, both from burning of cleared vegetation and from the loss of soil organic matter
- disturbed habitat which may permit the establishment and spread of exotic species which may displace native species
- loss of leaf litter, removing habitat for a wide variety of vertebrates and invertebrates.
Native vegetation has been extensively and irreversibly cleared in some parts of NSW for settlement, industry and agriculture. Clearing occurs to enable changes in land use and it is generally irreversible, due to the ongoing nature of subsequent land uses. Clearing can directly impact kill and displace native animals and plants and has a negative impact on biodiversity. Over time, the effects of fragmentation and disturbance can lead to invasion by weeds and further deteriorate the condition and habitat values of the remnant vegetation.
Permanent clearing of woody vegetation
Clearing of woody vegetation in NSW is captured in satellite imagery and has been analysed from 1990 using the Statewide Landcover and Trees Study. This data is published annually online by DPIE.
Woody vegetation clearing is detected through a combination of automated and expert interpreter image analysis. Tree canopies that are recognised by the interpreter as removed are assigned a replacement landcover class which provides an indication of the purpose for which the vegetation was cleared. The assignment of these classes is primarily based on visual interpretation of the context of the identified tree canopy removal with reference to ancillary data sources. In areas where there are many different forms of land use, it can be difficult to interpret the final replacement class and therefore this classification is indicative only.
The landcover classes are:
- agriculture e.g. grassland, cropping, horticulture
- forestry e.g. native and plantation harvesting, establishment, thinning, forestry infrastructure
- infrastructure e.g. residential, commercial, mining, public infrastructure, farm infrastructure.
The trend in clearing rates (hectares per annum) since 2009 is displayed in Figure 13.2. This figure presents SPOT5/Sentinel-2 data on the changes in woody vegetation due to permanent clearing for agriculture and infrastructure development.
Figure 13.2: Permanent loss of woody vegetation each year in NSW, 2009 to 2019
Notes:
Rate of permanently removal of woody vegetation from DPIE analysis of satellite imagery to classify landcover types. Satellite imagery used for this analysis was captured by SPOT and Sentinel 2 remote sensing.
A new regulatory framework for biodiversity conservation and rural land management was established in 2016/2017 (see Legislation and Policies). The rate of permanent woody vegetation clearing from agriculture and land use change has significantly increased since that time.
The average rate of permanent clearing over seven years from 2009 to 2015 was 13,028 hectares per year (Figure 13.2). The rate of permanent clearing increased to 26,200 hectares per year in 2016, the year before the new regulatory framework (Biodiversity Conservation Act 2016) came into effect in August 2017. The subsequent rate of clearing from 2017 to 2019 was 34,933 hectares per year on average. Some of this included agricultural clearing approved under the previous native vegetation framework.
Agricultural clearing shows almost a threefold increase from 2009–2015 (9,085 hectares/year average) to 2017–2019 (26,633 hectares/year average). Permanent infrastructure clearing approximately doubled in the same periods from 3,942 hectares/year average to 8300 hectares/year average.
The monitoring of increases in woody vegetation, mainly due to revegetation, is more complex than the monitoring of clearing. A methodology is being developed to measure such change and estimates of revegetation should be available for future reporting.
Native Forest Harvesting
Native forestry harvesting modelled from SPOT 5/Sentinel-2 data is depicted in Figure 13.3. Native forestry remained relatively stable apart from an increase in 2016 to 12,200 hectares/year.
Native forest harvesting results in temporary vegetation change, but is not classified as land clearing because there is an acknowledgment that all harvested areas must be regrown. Almost all harvestable timber areas on State forests have been previously harvested at least once, and usually multiple times since the establishment of the Forestry Commission in 1916. Some plantations have been established on historically cleared land, reversing historical clearing of woody vegetation for agricultural purposes.
Forestry on State forests is a broad scale activity which commits to a returning areas harvested to woody vegetation in perpetuity. State forests are managed for a range of values including environmental conservation, tourism and recreation and renewable timber production while also supporting rich biodiversity and wildlife populations.
Figure 13.3: Annual Native forestry harvesting by tenure, 2009 to 2019
Notes:
Landcover class: (a) SPOT and Sentinel 2 and (b) Landsat analysis (hectares/year)
Clearing of non-woody vegetation under the Land Services Act
Since the amendment to the Local Land Services Act 2013 on 25 August 2017, detected clearing of non-woody vegetation has been monitored on Regulated land (see Native Vegetation Regulatory Map). This data is published annually online by DPIE.
Non-woody vegetation loss, or removal of grasses, small shrubs and groundcover, is identified using satellite-derived products that are referenced against high-resolution imagery and assigned a landcover class by interpretative experts (as per woody vegetation change).
Regulated land is classified as 'Category 2 - regulated land' under Part 5A of the Local Land Services Act. Land categories set out the pathways available for landholders of regulated land to obtain authorisation to clear and manage native vegetation. About 54% of NSW is categorised as Regulated land. In 2019 46,340 hectares of non-woody vegetation was cleared on Regulated Land, and 54,760 hectares in 2018. Ninety Eight per cent of clearing on Regulated Land was attributed to agricultural clearing.
Note that the non-woody vegetation clearing figures charted below are limited to clearing that occurs on Category 2 regulated land. Additional clearing of non-woody vegetation on excluded or category 2 exempt land has not been included.
Pressures on vegetation condition
Land-use
The level of disturbance of natural systems and impact on the condition of native vegetation increases with intensifying land use. A framework for land use mapping is described in Guidelines for Land Use Mapping in Australia: Principles, procedures and definitions (). These land uses have been reclassified into five categories representing pressure on native vegetation according to the intensity of the operations associated with different land uses.
ABAREs produced National Land use datasets for 2010–11 and 2015–16 as part of the development of the National Experimental Land Accounts. Map 13.3 shows the distribution of land use pressure categories across the State derived from the national 2015–16 data.
Map 13.3: Distribution of vegetation pressure, 2015–16
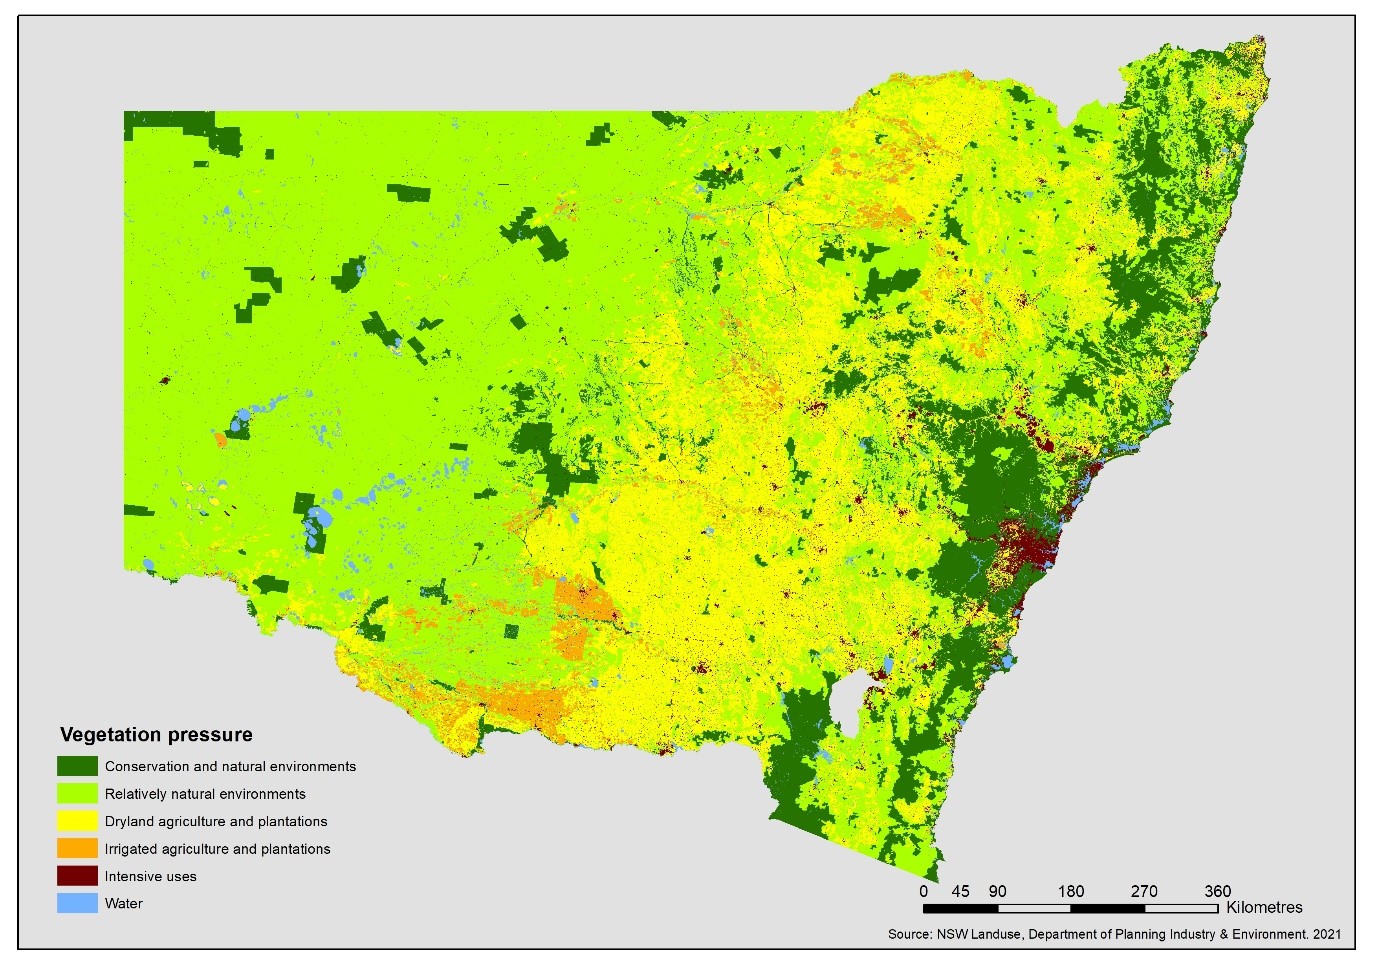
The proportion of land in NSW within each of the grouped land use categories for 2010–11 and 2015–16 is summarised in Table 13.4. Over the five years there was a general intensification in the pressure of land use in NSW, mainly from land use for agriculture in relatively natural environments to dryland agricultural uses. This is consistent with changes in the land disturbance index described in the topic.
Conservation and natural environments remain relatively stable with increases in the NPWS estate offsetting losses from other natural environments such as residual native forest.
Relatively natural environments (native grazing and production native forests) decreased by 3% while dryland agriculture and plantations increased by the same proportion indicative of the expansion of intensive agriculture into these marginal environments. Market variables are key drivers of clearing for agricultural uses in NSW (). Irrigated agriculture, plantations and intensive uses remained relatively stable.
Table 13.4: Land-use pressure on native vegetation
| Category | Description | Area (% of State in 2010/11) |
Area (% of State in 2015/16) |
|---|---|---|---|
| Conservation and natural environments | Land set aside primarily for conservation, where natural ecosystems are maintained | 17.3% | 16.9% |
| Relatively natural environments | Land used primarily for agriculture, with limited changes to native vegetation | 53% | 49.7% |
| Dryland agriculture and plantations | Land used mainly for agriculture, based on dryland farming | 23.9% | 27.3% |
| Irrigated agriculture and plantations | Land used mostly for agriculture, based on irrigated farming | 0.9% | 1.3% |
| Intensive uses | Land subject to extensive modification, generally in association with residential settlement, or commercial or industrial uses | 1.6% | 1.7% |
There is a large pipeline of major infrastructure and development projects planned in NSW. For example, through the Renewable Energy Infrastructure Roadmap, major transport projects and Strategic Activation Precincts, the Western Sydney Aerotropolis and broader growth and housing targets.
Other pressures
Pressures other than land use also have an impact on the condition of native vegetation. These include:
- the emerging effects of climate change
- altered fire regimes
- the longer-term effects of fragmentation, including after clearing
- lack of groundcover retention
- invasive species (especially weeds and plant pathogens)
- soil degradation
- changes to water regimes.
Climate change
Climate change is a pervasive threat that is expected to have increasing effects on all types of native vegetation in NSW. This is due to changing regional trends in rainfall, sea level rise, snow cover and duration, and conditions that contribute to major events such as heatwaves, drought, bushfires, storms and flooding.
Predicted future impacts on particular ecosystems include increased forest growth, alterations in competitive regimes between perennial native grasses, increasing encroachment of woody shrubs into arid and semiarid rangelands, continued incursion of mangrove communities into freshwater wetlands, and establishment of woody species at increasingly higher elevations in the alpine zone ().
Alpine vegetation, wetlands and rainforests are likely to be especially sensitive (). The continuing reduction of snow cover in alpine areas () is decreasing the area and suitability of habitat for a range of specialised alpine species (). Modelling of climate change scenarios also suggest contractions in the range of certain Eucalyptus species as climate change progresses (), as well as effects of elevated CO2 in the atmosphere on the nutritional quality of Eucalyptus foliage for dependent species ().
Altered fire regimes
Altered fire regimes - too much or too little burning or burning at too high an intensity - affects regeneration and alters the composition of vegetation communities. Some native species require a level of fire to stimulate regeneration, but too much fire supresses this regeneration (see topic).
The interval between fires is a critical factor in maintaining the full complement of biodiversity with vegetation communities. Recommended minimum and maximum fire intervals to maintain healthy vegetation communities are described in Table 22.2 of the topic. Fire interval status is assessed based on the fire intervals for vegetation formations specified in Table 22.2.
Prior to the 2019–20 Black Summer fires, NSW consisted of vegetation in a diverse mosaic of conditions including long-unburnt, too frequently burnt, vulnerable and within the recommended ecological threshold (see Map 22.2a in the topic).
The 2019–20 fires burnt a historically unprecedented area of NSW, including extensive areas of several vegetation formations where fire sensitivity is so great that to maintain ecological condition it is recommended that all fire should be excluded. These include rainforests where over 300,000 hectares (37%) were burnt and the alpine complex where 27,000 hectares or 21% burnt.
An analysis of the change in fire interval status was conducted and this is described in Table 22.3 of the topic. As a consequence of the Black Summer fires there was a significant shift in the status of recommended fire intervals for vegetation. The majority of vegetation - 61.9% is now under pressure from too much burning. A further 25% is under pressure from insufficient burning, while only 13% remains within the optimal fire interval for burning. If any major fire events were to occur in the near future these might be expected to further distort the balance between too frequent burning and an appropriate level of burning that promotes the maintenance of healthy vegetation communities.
Fragmentation from Land Clearing
Habitat fragmentation caused by land clearing continues to have long-term impacts on native vegetation well after the initial clearing occurs, including:
- the dieback of vegetation and lack of regeneration
- invasion by weeds and feral animals
- loss of native species and variability.
Lack of groundcover retention after land use
Changes in land use and management can result in changes of condition or loss of groundcover vegetation. A lack of native groundcover retention can have flow on effects for species diversity and soil erosion.
For example, while most arid shrublands and grasslands are not subject to extensive clearing, they can be affected by overgrazing. This is due to the cumulative impact of native species, farm stock and feral animals. The effects of overgrazing are often compounded by cycles of drought. Overgrazing reduces the cover of ephemeral plants, simplifies fauna habitat and promotes an overabundance of species which are less palatable to grazing animals.
Some of the pressures on the condition of native vegetation are described in more detail in other topics of this report, including:
- changes to water regimes (see the and topics)
- soil degradation (see the topic)
- invasive species (see the topic)
- climate change (see the topic).
Responses
Legislation and policies
Land Management and Biodiversity Conservation Act
In 2017, the NSW Government introduced the land management and biodiversity conservation framework, which included the new Biodiversity Conservation Act 2016 and amendments to the Local Land Services Act 2013. The framework was introduced following the recommendations of an independent review in 2014 'A review of biodiversity legislation in NSW'. The Government committed to implementing all 43 recommendations from that review, including introducing new land management and biodiversity conservation laws.
The Biodiversity Conservation Act 2016, Local Land Services Act 2013 and State Environmental Planning Policy (Vegetation in Non-Rural Areas) 2017 establish the regulatory framework for managing impacts to native vegetation.
While the introduction of this framework has led to an increases in native vegetation removal and approvals for native vegetation clearing, it includes principles and programs to protect key biodiversity values. Key features of the framework include:
- a simplified, risk-based land management framework to strike a balance between agricultural productivity and conservation
- an expanded NSW Biodiversity Offset scheme to facilitate ecologically sustainable development
- significant investment in private land conservation delivered by the Biodiversity Conservation Trust to provide financial incentives for landholders to conserve biodiversity on their land
- protecting native plants and animals through investment in the Saving Our Species program and a risk-based system for regulating human and business interactions with native plants and animals.
Regional Forest Agreements
The Regional Forest Agreements (RFAs) between the State and Commonwealth Governments conserve forest values across the landscape by contributing to a Comprehensive Adequate and Representative (CAR) reserve system framework, providing ecologically sustainable forest management outside of reserves and identifying the small proportion of public forest that are available for forestry.
Integrated Forestry Operations Approvals set rules to protect environmental values during native forestry operations on public land and ensure harvested areas are regrown in perpetuity.
Programs
Biodiversity Offsets Scheme
A new biodiversity offsets framework was introduced with the Biodiversity Conservation Act 2016. The Biodiversity Offsets Scheme (BOS) establishes a framework to avoid, minimise and offset the impacts on biodiversity from development or clearing. It improves biodiversity outcomes by creating consistent requirements for biodiversity assessment at impact and offset sites and provides transparency in decision making.
There are five 'referral pathways' into the BOS, which include:
- local development (assessed under Part 4 of the Environmental Planning and Assessment Act 1979) that triggers the BOS threshold (see below), or is likely to have a significant impact on threatened species, ecological communities or their habitat according to the test of significance
- all state significant development and state significant infrastructure projects, other than where the Secretary of DPIE and the environment agency head determine that there is unlikely to be a significant impact
- biodiversity certification proposals
- clearing in urban and environmentally zoned areas that do not require development consent and exceed the BOS threshold (see below)
- clearing that requires approval by the Native Vegetation Panel under the Local Land Services Act 2013.
The BOS threshold has two elements:
- whether the amount of native vegetation being cleared exceeds a threshold area, or
- whether the impacts occur on an area mapped on the Biodiversity Values map published by the Environment Agency Head (or delegate).
Where the BOS applies, a proponent must apply the Biodiversity Assessment Method which provides the method to avoid and minimise impacts, identify the residual impact and calculate the residual impact in terms of a biodiversity credit obligation.
There are three main options1 to satisfy biodiversity credit obligations:
- establish a new offset site through a Biodiversity Stewardship Agreement
- purchase biodiversity credits on the open market (from landholders who have established a Biodiversity Stewardship Agreement)
- pay into the Biodiversity Conservation Fund (BCF), which transfers the obligation to the Biodiversity Conservation Trust
Biodiversity credits are created under Biodiversity Stewardship Agreements, which are voluntary in-perpetuity agreements between a willing landholder and the Minister for the Environment. The Biodiversity Assessment Method is used to calculate the gain in biodiversity values, in terms of biodiversity credits, that will be achieved by protecting and managing the land.
The Biodiversity Conservation Act also establishes a scheme for the biodiversity certification of land which provides for landscape-scale or strategic assessment of biodiversity. Biodiversity certification offers planning authorities a streamlined process for assessing biodiversity in areas marked for development at the strategic planning stage. These areas can be avoided and protected while identifying areas more suitable for development.
1 A fourth option is available under ancillary rules for biodiversity conservation actions when biodiversity credits are not available and with approval.
Biodiversity Values Map
The Biodiversity Values Map identifies land with high biodiversity value that is particularly sensitive to impacts from development and clearing. The map forms part of the BOS threshold, and is one of the triggers for determining whether the BOS applies to a clearing or development proposal. The clearing of native vegetation and certain other activities that will impact biodiversity in an area on the Biodiversity Values Map will require application of the Biodiversity Assessment Method and the offsetting of unavoidable impacts on biodiversity. This map can be viewed from a public interface.
Eleven types of land may be considered in the Biodiversity Values Map, including:
- coastal wetlands and littoral rainforest as per the Coastal Management Act 2016
- core koala habitat identified in a plan of management under State Environmental Planning Policy No. 44-Koala Habitat Protection (SEPP 44)
- Ramsar wetlands as defined by the Environmental Protection and Biodiversity Conservation Act 1999 (Commonwealth)
- land that contains threatened species or threatened ecological communities identified as species vulnerable to serious and irreversible impacts under Section 6.5 of the BC Act
- biodiverse riparian land
- high conservation value grasslands or groundcover
- old growth forest
- rainforest
- declared areas of outstanding biodiversity value
- council nominated areas with connectivity or threatened species habitat that the Environment Minister considers will conserve biodiversity at bioregional or state scale
- any other land that is of sufficient biodiversity value to be included.
Landholders can request a report which explains the basis for including their land on the Biodiversity Values Map or seek a review of their property if they consider the biodiversity values have been mapped incorrectly on their land.
Biodiversity Assessment Method
The Biodiversity Assessment Method (BAM) underpins the Biodiversity Offsets Scheme. It provides:
- a consistent, transparent and robust method for assessing biodiversity values from a proposed development, activity, clearing or biodiversity certification, as well as improvements in biodiversity values from management actions undertaken at a stewardship site
- guidance on how a proponent can avoid and minimise potential impacts
- the number and class of biodiversity credits that need to be offset to achieve a standard of 'no net loss' of biodiversity.
The BAM must be applied by an accredited assessor. The assessor documents the results of the biodiversity assessment in a Biodiversity Assessment Report. The relevant decision maker will use the report to determine whether to approve the development, clearing or biodiversity certification proposal or establish a Biodiversity Stewardship Agreement.
The NSW Government is committed to ensuring the BAM is scientifically robust and practical to apply. The BAM was amended in 2020 based on outcomes from its application and with a view to increasing useability.
Biodiversity Conservation Trust
The NSW Biodiversity Conservation Trust (BCT) is a not-for-profit statutory body that was constituted with the commencement of the BC Act. The work of the BCT is guided by its Business Plan for 2021–22 to 2024–25, approved by the Minister for the Environment and the Biodiversity Conservation Investment Strategy 2018.
The BCT was established to support and encourage landholders to protect and conserve biodiversity on private land. The NSW Government committed more than $350 million for the BCT to deliver private land conservation programs over five years and $70 million each subsequent year, subject to reviews of its performance.
The BCT works in partnership with landholders to establish private land conservation agreements to conserve and manage high-value biodiversity on private land. Three types of voluntary private land conservation agreements are available to landholders:
- biodiversity stewardship agreements
- conservation agreements
- wildlife refuge agreements.
Landholders who enter voluntary agreements to conserve and manage biodiversity can access a range of funding programs, subject to eligibility criteria, that may help to diversify their income streams, with potential for long-term annual payments. Further details on the operation and uptake of private land agreements are provided in the topic.
The BCT plays a key role in the delivery of the Biodiversity Offsets Scheme. Proponents can choose to satisfy offset obligations in the consent conditions to their development approval by paying money into the Biodiversity Conservation Fund managed by the BCT. Once a payment is made into the fund, the BCT is responsible for finding the offsets needed. This is achieved by purchasing biodiversity credits (generated under biodiversity stewardship agreements) or funding biodiversity conservation actions that benefit species impacted by the development.
The BCT assists landholders who wish to enter biodiversity stewardship agreements to generate and sell biodiversity credits and administers those agreements.
Areas of outstanding biodiversity value
The Biodiversity Conservation Act 2016 enables the Minister for the Environment to declare Areas of Outstanding Biodiversity Value (AOBVs). These are special areas that contain irreplaceable biodiversity values that are important to the whole of NSW, Australia or globally. The purpose of declaring an AOBV is to identify, highlight and effectively conserve areas that make significant contributions to the persistence of biodiversity.
The value of these areas for conservation, compared with other mechanisms, is their flexibility. They can be identified across a range of geographic and geological features and have no size requirements. This means they can be targeted across a range of scales, locations or themes and applied to sites as small as cave systems, hot springs or boulder outcrops, and larger landscapes, such as wetlands, grasslands or forests. AOBVs also capture sites that may not otherwise be protected - for example, they are not restricted to threatened species or ecological communities - and can be declared on public or private land, or a combination thereof.
Anyone can nominate an area for declaration as an AOBV by completing a proposal form. The proposal is then subject to a rigorous scientific assessment process, and the proposed area must be found to meet one or more of the scientific criteria set out in the Biodiversity Conservation Act 2016. Private landowner support is mandatory for all public nominations. The Department of Planning, Industry and Environment will also seek landowner consent at key points in the process.
The Biodiversity Conservation Act 2016 provides legal protection for AOBVs. It is an offence to damage an AOBV unless the activity is carried out under a relevant approval such as a development consent, biodiversity conservation licence, agreement or other authority. Once an area is declared an AOBV, it is included on the Biodiversity Values Map and any development proposal on the site will trigger the NSW Biodiversity Offsets Scheme. In addition, AOBVs are excluded from the land management framework set out in the Local Land Services Act 2013, meaning clearing under the Land Management (Native Vegetation) Code 2018 is not permitted.
In addition to protections being provided, the declaration of an AOBV highlights the conservation value of a site and makes it a priority for private land conservation funding through the NSW Biodiversity Conservation Trust. Land declared an AOBV is automatically a priority for investment under the Biodiversity Conservation Investment Strategy, and the Minister is obliged to take reasonable steps to enter into a private land conservation agreement with affected landholders and/or landowners.
Existing areas of declared critical habitat under the repealed Threatened Species Conservation Act 1995, including Little Penguin and Wollemi Pine declared areas, became AOBVs when the Biodiversity Conservation Act 2016 came into effect.
Local Land Services
The Land Management and Biodiversity Conservation reform framework recognises the need to grow food and fibre in a productive agricultural sector, while preserving and protecting important environmental assets and investing in private land conservation and threatened species protection.
For 2018 and 2019 calendar years, 43,399 hectares of land was set aside under land management to support the conservation and enhancement of native vegetation in-perpetuity.
Local Land Services also supports landholders and communities towards sustainable land use and the protection of natural resources. Between 2018 and 2020, Local Land Services:
- Helped protect 402,721 hectares of native vegetation through rehabilitation and enhancement.
- Enhanced, rehabilitated, and protected 231,909 hectares of significant species and endangered ecological communities.
- Protected 4,814,117 hectares of land against priority weeds.
- Protected agricultural production and threatened species from pest animals by coordinating control programs on 73,047,448 hectares of land.
- Actively managed 1,392,191 hectares of travelling stock reserves for biodiversity conservation, Indigenous culture, and recreation.
- Protected 212,068 hectares of wetlands through rehabilitation and enhancement.
Rural Land management
The framework for regulating impacts on native vegetation from rural land management activities applies a risk-based approach to authorising clearing.
The clearing of native vegetation for everyday land management activities posing lower risk to biodiversity, such as constructing and maintaining rural infrastructure (including fence lines, dams, sheds and tracks), is permitted without formal approval under the Local Land Services Act 2013 as "allowable activities". However, there are requirements to minimise impacts on native vegetation and, where possible, to co-locate infrastructure. Land with threatened species or ecological communities present is more highly regulated than other land.
The Land Management (Native Vegetation) Code 2018 helps landholders manage their land sustainably and ensure more productive farming methods and systems while responding to environmental risks. The Code sets out clearing parameters and some parts of the Code require landholders to establish set aside areas to offset the impacts of clearing and promote vegetation integrity.
For higher risk native vegetation clearing not permitted as an allowable activity or under the Code, the proposed clearing must be independently assessed by the Native Vegetation Panel. The Biodiversity Offsets Scheme must be applied to assess the impact of the proposed clearing and determine any biodiversity credits required to offset that impact. The Native Vegetation Panel considers the environmental, economic and social impacts of the proposal in making their determination.
Native Vegetation Regulatory Map
The transitional Native Vegetation Regulatory (NVR) Map shows some of the rural land where clearing of native vegetation, through the use of Allowable Activities or the Land Management Code, is limited or prohibited. The transitional map does not delineate between Category 1 exempt and Category 2 regulated land (defined below). This map can be viewed in a public map interface.
Rural land in NSW is categorised for the purposes of Part 5A of the Local Land Services Act 2014 based on the clearing or disturbance history at or between 1 January and 25 August 2017 and particular environmental values at risk to loss of vegetation. There are four categories that define pathways or level of authorisation required to clear native vegetation:
- Category 1 - exempt land - native vegetation clearing is allowed without approval from Local Land Services.
- Category 2 - regulated land - authorisation may be required from Local Land Services for native vegetation clearing. This may include clearing under the Land Management (Native Vegetation Code) 2018. Landholders also have a range of allowable activities available to them for use without approval from Local Land Services
- Category 2 - vulnerable regulated land is designated as steep or highly erodible lands, protected riparian land or special category land. Use of the Land Management (Native Vegetation) Code 2018 and allowable clearing activities are restricted in these areas
- Category 2 - sensitive regulated land is designated as environmentally sensitive. Clearing under the Land Management (Native Vegetation) Code 2018 is not permitted in these areas, although there is a limited list of allowable clearing activities available.
- Excluded land is managed outside the land management framework through the State Environmental Planning Policy (Native Vegetation in Non-Rural Areas).
The NSW Government is still considering when and how the full Native Vegetation Regulatory map that includes all the land categories will be released to the public.
Landholders can request a report which explains the basis for including their land in any category on the transitional NVR Map or seek a review of their property if they consider their land has been incorrectly categorised. This will be expanded to the remaining land categories when the full NVR map is published.
State Environmental Planning Policy (Native Vegetation in Non-Rural Areas) 2017
A State Environmental Planning Policy (Vegetation in Non-Rural Areas) 2017 (SEPP) regulates clearing not covered by the Local Land Services Act 2013 (LLS Act). The SEPP applies to the Sydney and Newcastle metropolitan areas, and to all other land in NSW that is zoned for urban purposes or for environmental conservation/management under the Standard Instrument - Principal Environmental Plan. It regulates clearing of:
- native vegetation above the Biodiversity Offsets Scheme threshold, where a proponent will require an approval from the Native Vegetation Panel established under the LLS Act
- vegetation below the Biodiversity Offsets Scheme threshold, where a proponent requires a permit from council as the vegetation is identified in the council's Development Control Plan (DCP).
Management of native vegetation
The NSW Government publishes data on native vegetation programs through various agencies.
The Biodiversity Conservation Trust reports on private land conservation agreements and permanent offset agreements that the Trust manages. The NSW Government also reports on national park reservations and acquisitions by the National Parks and Wildlife Service. Public and private protected areas in NSW contribute to the National Reserve System, Australia's network of public, Indigenous and private protected areas.
The Local Land Services maintains public registers under Part 5A of the Local Land Services Act 2013. These include notifications and certificates issued for clearing approval under the Land Management (Native Vegetation) Code, set aside areas protected in exchange for certain clearing approvals, and Native Vegetation Panel determinations on clearing applications not otherwise permitted by the Land Management (Native Vegetation) Code.
Between 2006 and 2018, the NSW Government compiled data on native vegetation programs from various agencies to produce the NSW Report on Native Vegetation (), including the native vegetation report card. This format has been replaced by other reporting methods as described above. Data for 2017 to 2020 from key programs are summarised in Table 13.5.
Table 13.5: Summary of native vegetation management activities undertaken in NSW from 2005–06 to 2015–16
| Category | Description | 2017 | 2018 | 2019 | 2020 |
|---|---|---|---|---|---|
| New private land conservation areas | New areas of privately-owned land managed for conservation (see topic) | 4,954 (2017–18) | 14,164 (2018–19) | 18,629 (2019–20) | 31,150 (2020–21) |
| New public land formal conservation areas | New formal public reserves or additions to the network (see topic) | 2,900 (2017–18) | 10,700 (2018–19) | 65,200 (2019–20) | 226,000 (2020–21) |
| New set aside areas | New set aside areas protected and managed to promote vegetation integrity, in exchange for certain clearing approvals under the Local Land Services Act 2013 | 217* | 12,259 | 31,140 | 17,288 |
| New approvals to clear native vegetation | Approved clearing under NSW legislation including the Local Land Services Act 2013; former Native Vegetation Act 2003 | 300,476 | 202,784 | 160,403 | 148,307 |
Notes:
*2017 figures on set aside areas are for the period after 25 August 2017, when the Land Management and Biodiversity Conservation framework commenced.
**Fewer than 4% of approvals had been implemented 2018–20 (NSW Land Management Report 2018–2020).
The table does not include other important categories that contribute vegetation removal such as development approvals under environmental planning legislation and clearing under the Plantations and Reafforestation Act 1999.
The first three categories describe activities that result in positive changes in the extent or condition (or both), of native vegetation. The last category describes approved losses in the extent of vegetation. However, this category also includes approvals to clear invasive native species. Invasive native species are those that have reached very high densities and dominate an area, making land less productive. Clearing invasive native species may promote the re-establishment of a more desirable mosaic of native vegetation across the agricultural landscape.
It is important to note that the new approvals category describes consent for clearing applications issued in a given year. These do not necessarily reflect the actual levels of detected clearing described in Figure 13.1 above, as the clearing detected may be approved, exempt from approval, or illegal. Clearing approvals also apply for 15 years, so the clearing may not occur in the year of approval, or an applicant may choose not to undertake all approved clearing.
Reviews of the Legislative Framework
In June 2019, a NSW Audit Office report concluded that clearing of native vegetation was not being effectively regulated and managed. The NSW Government accepted the Audit Office's recommendations and has:
- implemented improved administrative processes, staff guidelines and landholder guidance materials
- implemented improved systems for monitoring native vegetation, enhanced compliance systems, and regular public release of native vegetation data
- published additional information on private land conservation investment prioritisation and selection.
The Natural Resources Commission (NRC) released a report on the land management and biodiversity conservation framework in March 2020. The Government is working to address its recommendations. This includes establishing a governance group to oversee implementation of the framework and strengthening monitoring and compliance for unexplained land clearing. The Government's response to the NRC report recommendations is available for download on the NRC's website.
2019–20 Bushfire Responses
Immediately following the 2019–20 bushfires, the NSW Government released the Wildlife and Conservation Bushfire Recovery, Immediate Response January 2020 (the immediate response) to support wildlife and conservation recovery ().
The Government's efforts focused on mapping the extent of the fire damage, identifying at-risk species and communities, supplying emergency food, water and shelter to wildlife, controlling feral animals to reduce pressure on native wildlife, collecting and banking seeds, and supporting wildlife carers.
The NSW Government's immediate response was the first step in an ongoing recovery process. Many species and communities will take years to recover, particularly those not adapted to fire or impacted by prolonged drought or other threatening processes.
The medium-term response plan outlines steps the NSW Government will take over the subsequent 1–5 years to support the recovery of biodiversity in New South Wales (). The Department of Planning, Industry and Environment (DPIE) is responsible for implementation of the plan, which will be integrated into the long-term management of key risks to biodiversity. The plan will also help New South Wales build its adaptive capacity and resilience in a changing climate - where increased risk from bushfire will be just one of many threats.
Following the 2019–20 bushfire season, the NSW Government introduced new mechanisms to allow certain site-scale clearing to support property rebuilds and management of bushfire risk on individual landholdings.
In November 2020, the Government approved an amendment to the Biodiversity Conservation Act 2016 and Biodiversity Conservation Regulation 2017 to provide a limited exemption from the Biodiversity Offsets Scheme to support rebuilds of property damaged or destroyed in the 2019–20 bushfires. The exemption applies to buildings or structures that were damaged or destroyed by bush fires between 5 August 2019 and 2 March 2020. The exemption means that people rebuilding property lost in the 2019–20 bushfires will not need to assess the impact of the rebuild on biodiversity, and any biodiversity impacts will not need to be offset.
The Government also gazetted a Rural Boundary Clearing Code in September 2021. This Code allows rural landowners the option to clear certain vegetation within 25 metres of the landholding's boundary, without assessment or approval, to reduce the potential for the spread of bush fires. The Code allows for clearing only in identified areas that are zoned as rural and considered bush fire prone within the Boundary Clearing Code Vegetation Map.
A list of environmental assets has been excluded from the Code, including certain threatened species, areas of outstanding biodiversity value, mapped critically endangered ecological communities and core koala habitat identified in a koala plan of management. The distinct linear nature of the clearing associated with the Rural Boundary Clearing Code will likely be identifiable in satellite data and described in future annual land clearing reports.
Future opportunities
The pressures that affect vegetation condition are likely to continue in the foreseeable future, due to further weed invasion and new weed incursions, the effects of plant diseases and pathogens, changes to fire regimes, future infrastructure and development pressures and the effects of climate change.
Our understanding of the nature and extent of native vegetation has been significantly improved with mapping of native vegetation communities across NSW. State Vegetation Type Mapping includes pre-clearing extent of plant communities that enables analysis of how much native vegetation remains. Native vegetation information can be accessed on the NSW SEED database and TREES NEAR ME NSW app.
The science underpinning vegetation condition and ecological carrying capacity modelling is also evolving. There are opportunities to improve the pre-European benchmark against which all condition scores are reported. The down-scaling to spatial resolutions less than 90m is also planned which will identify finer-scale connections in the landscape. In the future, applying machine learning techniques with site data is fundamental to model vegetation integrity attributes such as structure, composition and richness.
The Government will conduct a statutory five-year review of the land management and biodiversity conservation framework commencing in 2022. In the interim, the Department of Planning, Industry and Environment is implementing an integrated and assurance program to bring together a range of improvements to support the integrity of the Biodiversity Offset Scheme. The Government's ongoing monitoring of land clearing rates, and the five-year review, are opportunities to monitor the impacts and risks of land clearing on biodiversity.
The Biodiversity Conservation Act (Section 1.3c) recommends the inclusion of local and Aboriginal knowledge about flora and vegetation communities of significance to Aboriginal people, and to include this in monitoring how the species are faring and ways to care for them and their habitats. Qualitative data collection includes oral stories and knowledge about Aboriginal culture and practises. The EPA Aboriginal Peoples Knowledge Group supports this remerging research and understanding as being essential for understanding and managing all aspects of environmental health. One area where Aboriginal knowledge is being explored is the Natural Resources Commission Forest Monitoring and Improvement Program. The EPA Aboriginal Knowledge Group has also identified a need for management authorities to learn more and apply how Aboriginal cultures and practices improve the care, protection and management of species, their habitats and the overall environment. DPIE is similarly undertaking research into biodiversity response to Aboriginal cultural management.