Summary
Water quality and ecosystem health in marine and beach environments are generally good. The condition of NSW estuaries, coastal lakes and lagoons is more variable with more disturbance and negative impacts.
Why coastal, marine and estuarine ecosystems are important
The coastal, marine and estuarine waters of NSW contain high levels of biodiversity due to their diverse range of oceanic, shoreline and estuarine habitats and the influence of subtropical and temperate currents. These varied environments and the habitats they support provide many important ecosystem services, such as:
- mitigating coastal and seabed erosion
- maintaining coastal water quality and healthy aquatic ecosystems
- acting as critical habitats for fish and other marine life
- providing recreation, visual amenity and food production.
NSW indicators
| Indicator and status | Environmental trend |
Information reliability |
|
|---|---|---|---|
| Percentage of ocean and estuarine beaches with beach suitability grades for swimming of good or better |
|
Stable | ✔✔✔ |
| Estuarine water quality (chlorophyll a and turbidity)* |
|
Stable | ✔✔✔ |
| Extent of estuarine macrophytes |
|
Stable** | ✔✔ |
| Levels of estuarine catchment disturbance |
|
Getting worse | ✔✔ |
Notes:
Terms and symbols used above are defined in .
* Water quality by algae (chlorophyll a) and water clarity (turbidity)
** Stable reflects a variable result with extent decreasing in some areas and increasing in others.
Status and Trends
Recreational water quality is rated as ‘very good’ or ‘good’ at 89% of NSW beaches. The Beachwatch program ratings are based on levels of pollution from stormwater runoff and sewage contamination (enterococci data). The results show that 98% of ocean beaches and 85% of estuaries are rated ‘very good’ or ‘good’ but that only 42% of coastal lakes and lagoons are rated at this level. This indicates that the majority of coastal lakes and lagoons were susceptible to faecal pollution, with water quality not always suitable for swimming.
The condition of individual estuaries and coastal lakes is highly variable and depends on their level of resilience to change and the level of disturbance of their catchment. The health of estuarine ecosystems is heavily influenced by water quality. The NSW Government’s Estuary Health Monitoring Program monitors estuarine water quality by algae (chlorophyll a) and water clarity (turbidity) showing 71% of estuaries are in good condition and 10% of estuaries are in poorer condition. Other parameters that impact water quality fall outside this program, such as acidity (pH), pesticides, herbicides, heavy metals and other contaminants.
Aquatic plants have a role in maintaining water quality and sediment stability and supporting aquatic biota. The impacts of climate change and sea temperature rise are contributing to loss of kelp. Kelp is also being lost from offshore reefs on the mid-north coast, correlating with increases in populations of herbivorous fish.
Long-term trends show mangroves have been spreading in many NSW estuaries, often into areas of saltmarshes, and may be related to various human activities and sea-level rise. Matching upslope migration of saltmarsh is often constrained by public infrastructure and land uses and also less evident than mangrove spread. The 2019–20 bushfire season saw some of the most extensive and intense blazes recorded in NSW with fire occurring in areas that would not have usually burnt due to the ferocity of the fires. In coastal areas, this can be seen in the burnt or heat effects on mangroves and varied impacts on saltmarsh. The largest areas affected by fire include 71% of saltmarsh and 32% of mangroves in Wonboyn Lake and 48% of saltmarsh at Berrara Creek, 40% at Lake Tabourie and 38% at Khappinghat Creek.
Forty-seven marine species or populations are currently listed as threatened under NSW legislation including 22 marine seabird species, eight fish species, seven marine mammal species, three reptile species and seven other species. See topic.
Spotlight figure 20: Percentage of Sydney, Hunter and Illawarra beach and estuary monitoring sites rated with low levels of faecal contamination 1995–96 to 2019–20
Notes:
Includes Beachwatch Program data. Data from the Beachwatch Partnership Program is not included.
Spotlight figure 20 shows the percentage of sites with low levels of faecal contamination over the past 25 years at ocean and estuarine beaches in Sydney, the Hunter and the Illawarra. Microbial Assessment Categories are used to determine levels of enterococci found in faecal matter in water and, to determine levels over time, the categories have been applied to historical enterococci data. Microbial Assessment Categories A and B indicate generally low levels of faecal contamination, and are part of the assessment for a swimming site to achieve a beach suitability grade or rating of ‘very good’ or ‘good’.
The trend shows a significant reduction in bacterial levels at swimming locations in the Sydney region since 1998–99, with most fluctuations due to rainfall patterns and the associated variation in the frequency and extent of stormwater and wastewater inputs. Significant changes in recreational water quality occurred around 2000 and was mostly attributed to large-scale sewage infrastructure works.
Pressures
The greatest threats to the coastal and marine environment come from land-use intensification, resource use activities and climate change. Most coastal and estuarine areas have been modified to some extent, increasing pressure on the species that depend on them. Coastal development and land use continue to affect the viability of faunal populations, including threatened species. Only about one in five estuaries and coastal lakes retains more than 90% of natural, uncleared vegetation in their catchments, mostly along the south coast.
The desirability of coastal lifestyles and increasing settlement along the coast are placing estuaries and coastal lakes under higher levels of stress. The waters and ecosystems near urban, industrial and agricultural areas are particularly exposed to the effects of pollution from urban and agricultural runoff, stormwater and sewage discharge. The main threats to coastal, estuarine and marine waters are:
- land-use intensification, point discharges, poor diffuse water quality discharges and hydrologic modification mostly via floodplain drainage
- resource use activities including shipping, boating, fishing, aquaculture, recreation and tourism, dredging, mining, flow modification, entrance modification and infrastructure
- climate change resulting in altered ocean currents and nutrients, air and sea temperature rise, ocean acidification, altered storm and cyclone activity, sea-level rise, coastal erosion, flooding and storm inundation ().
Responses
NSW has frameworks and legislation to manage the marine estate, with objectives for coastal management, environment protection and fisheries management. Strategies in place include coastal management programs, the Marine Estate Management Strategy, Marine Water Quality Objectives, waterway health outcomes and risk-based frameworks to consider waterway health. Sustainability in the marine environment is also considered across commercial fisheries, harvest strategies and sustainable aquaculture strategies.
Marine-protected areas comprise a large network of marine parks and aquatic reserves to conserve biodiversity and maintain ecosystem function and the integrity of bioregions in NSW waters. See topic.
Related topics: | | | |
Context
The NSW coastline is approximately 2,100 kilometres long and the state's marine estate extends from the coastline to 5.6 kilometres (three nautical miles) out to sea. The broad characteristics of the NSW coast, estuarine and marine environment are:
- the north coast has broad coastal floodplains that have been extensively cleared, drained and settled
- the Sydney Basin is highly urbanised with drowned river valleys cutting through sandstone plateaus
- the south coast is mostly less developed and has many coastal lakes and lagoons with relatively small catchments
- Common estuary types in NSW are:
- mouths and tidal reaches of drowned river valleys
- rivers with sand bars at their entrances (barrier rivers)
- intermittently closed and open lakes, lagoons and creeks (ICOLLS)
- large coastal lakes.
Over the last decade, systematic data have been collected on the condition and long-term health of the coastal, estuarine and marine areas of NSW, and the important ecosystems they support. Regarding the health of estuarine ecosystems, this includes information on:
- micro algal abundance
- water clarity
- distribution of estuarine macrophytes
- maximum depth that seagrass will grow to
- oxygen levels.
There are significant knowledge gaps about the specific impacts of human disturbance, resource use and extractive activities on habitats, trophic levels and species assemblages. There are also gaps associated with the impacts of diffuse and point source pollution, and climate change stressors on marine assets and their resilience to these stressors. Some of these gaps are now being filled as part of the Marine Integrated Monitoring Program, particularly in relation to key habitats and ecosystems not comprehensively addressed in this report. The baseline data and experimental results will be available for the next NSW State of the Environment report.
Status and Trends
Water quality
The health of coastal, estuarine and marine ecosystems is heavily influenced by water quality. Water quality is naturally different between different estuary types and between estuaries and marine waters. However, pressures on water quality over time can lead to reduced ecosystem health including:
- changes in the distribution and abundance of aquatic species
- algal blooms
- loss of habitat and biodiversity
- food safety concerns
- reduced recreational value and amenity.
Marine waters are generally considered to be in good condition as currents, wave action and tides can usually dilute and disperse small-scale pollution. Marine waters are less vulnerable to degradation than estuaries and coastal lakes, especially those that are only intermittently open to the sea, where lower levels of tidal flushing result in a reduced resilience to pollution ().
Even in well-flushed systems, water quality can be affected by sedimentation, local pollution from stormwater runoff, bushfires, urban, agricultural and industrial development, floodplain drainage and sewage system overflows. Pollutants can accumulate in sediments, and bioaccumulation can then lead to adverse effects on ecosystems and human health.
Recreational water quality
Water at NSW beaches is mainly polluted by stormwater discharges and sewage overflows after heavy rain and agricultural runoff. Faecal material can pollute coastal waters and can threaten recreational users due to the pathogens (organisms that can cause a range of illnesses in humans) it may contain such as enteric bacteria, viruses, protozoa and worms.
The NSW Government administers the Beachwatch program, which monitors recreational water quality at popular coastal swimming sites in NSW. Beachwatch provides information about the level of sewage and stormwater pollution at beaches to indicate their suitability for swimming and recreational use and to inform the community of the effectiveness of stormwater and wastewater management.
Beachwatch and the Beachwatch Partnership Program monitor 228 swimming sites.
- Beachwatch monitors 132 swimming sites in the Sydney, Hunter and Illawarra regions: 72 ocean beaches, 56 estuarine beaches, three lagoon/lake sites and one ocean rockpool.
- Regional coastal councils monitor beaches under the Beachwatch Partnership Program. In the 2019–20 swimming season, nine local councils participated in this program, which monitored 96 swimming sites, including beaches, coastal lagoons, ocean baths, estuaries and rivers.
Find out more about BeachWatch
Swimming sites are assigned a beach suitability grade, ranging from 'very good' to 'very poor'. Grades relate to the Microbial Assessment Category (MAC), which detects levels of enterococci bacteria in the water to assess the risk of illness as determined in accordance with the Guidelines for Managing Risks in Recreational Water ().
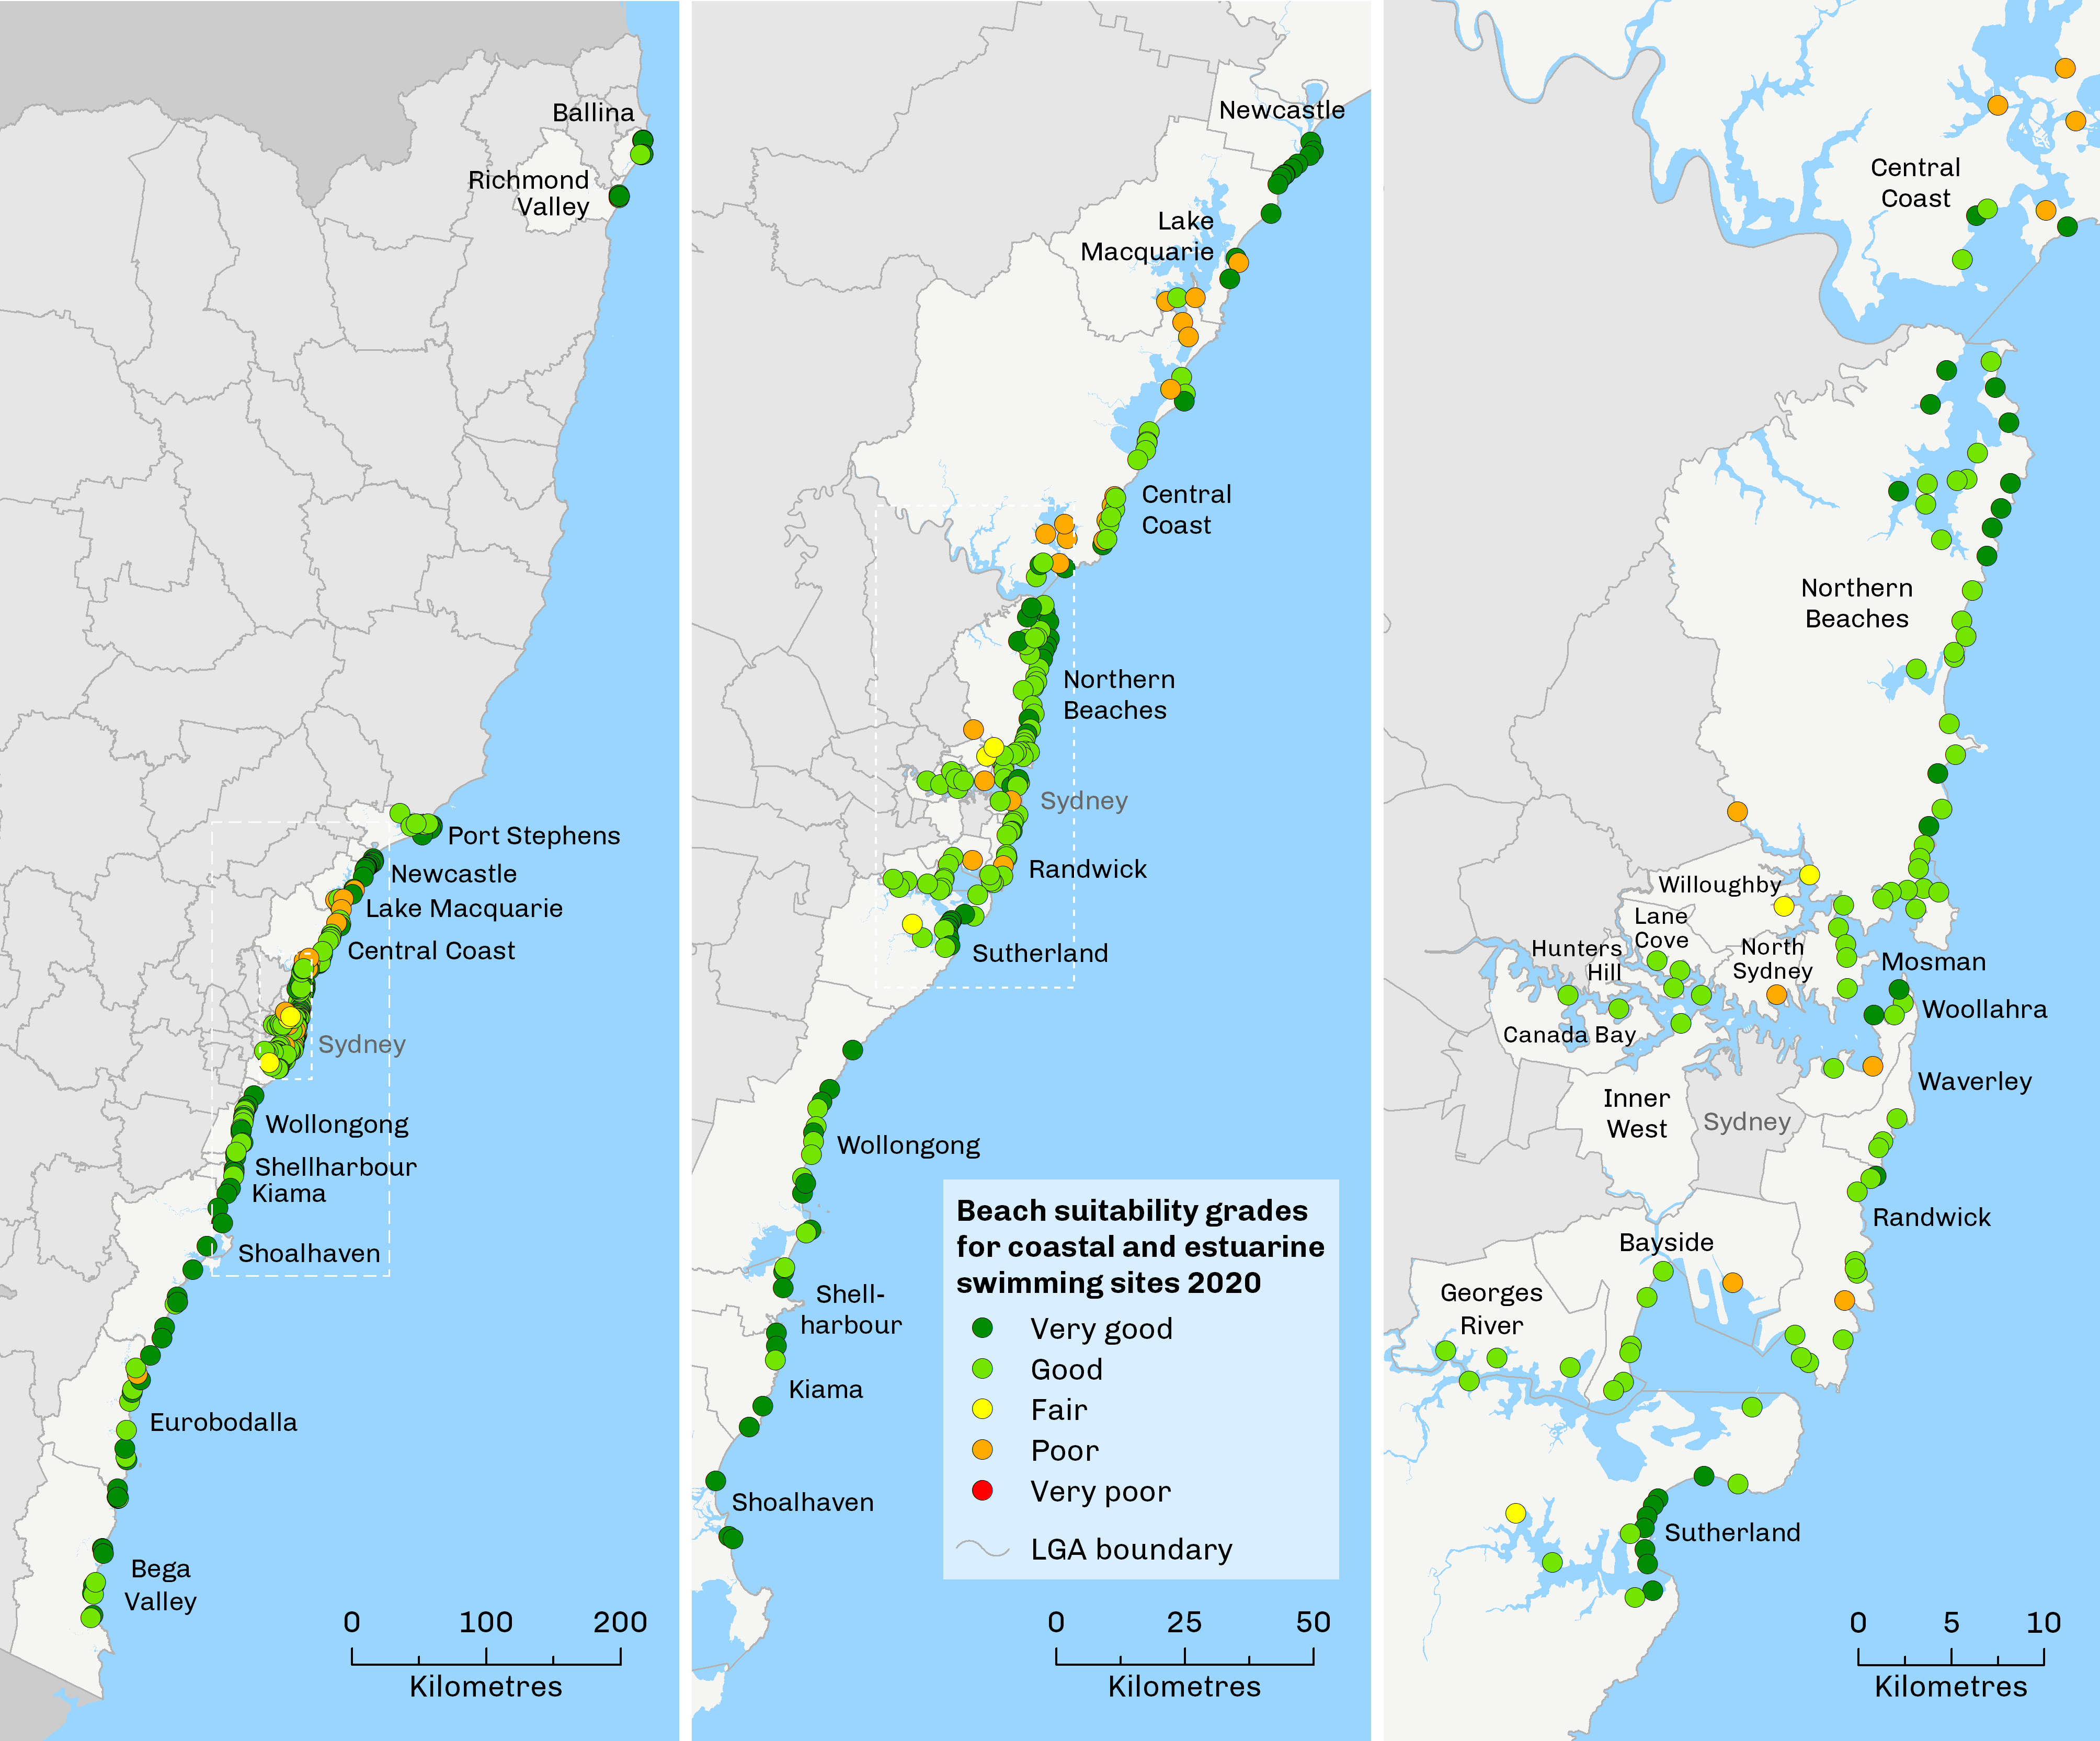
In 2019–20, 89% of the 228 swimming locations monitored were graded as 'very good' or 'good'. Nearly all ocean beaches (98%), 85% of estuarine beaches and all of five ocean baths achieved these ratings. However, only 42% of lake and lagoon swimming sites were graded as 'very good' or 'good,' reflecting their lower capability to dilute and flush pollution (Map 20.1).
Map 20.1: Beach suitability grades at coastal and estuarine swimming sites in NSW 2019–20
In 2019–20, 93% of Sydney estuarine beaches had low levels of faecal contamination, compared with the 80% of beaches with low levels in 2016–17 and despite variable rainfall conditions for both periods.
The historic trend shows that before 2002, wet weather had a much greater impact on the levels of faecal contamination in swimming locations in Sydney. While 1998–99, 2007–08, 2010–11 were all years with heavier rainfall, the percentage of Sydney estuarine beaches with low levels of enterococci greatly improved over these years:
- 2% in 1998–99
- 67% in 2007–08
- 85% in 2010–11.
These significant reductions in bacterial levels at swimming locations in the Sydney region may be attributed to improvements in stormwater and wastewater management over the past 21 years, with a suit of strategies including programs to manage stormwater, wet weather overflow prevention (such as the Northside tunnel storage) and most significantly, the commissioning of the Deepwater Ocean Outfalls at North Head, Bondi and Malabar. The latest results from 2019–20 indicate the need to further improve the management of stormwater flowing into estuaries in urban catchments by continuing to adopt a risk-based approach to reduce the impacts of wet weather overflows from the wastewater network.
Estuarine water quality
Eutrophication occurs when nutrients and organic matter lead to an excessive growth of plants, including algae, in estuaries. Consequences include:
- reduced water clarity leading to submerged aquatic plants and animals struggling to get the light they need to grow
- loss of oxygen in waters leading to the death of animals
- toxins produced by some algae that threaten fish, shellfish and humans coming into contact with the water
- food safety concerns.
Abnormally high turbidity (poor water clarity) or high levels of chlorophyll a (indicative of high phytoplankton levels or algal blooms) can mean that a water body is experiencing eutrophication. Sometimes this can be attributed to natural causes, for example, ocean upwellings which have a close association with El Niño cycles can lead to natural algal blooms, but often it is human-induced. High and moderate levels of disturbance result in significantly increased turbidity and chlorophyll a ().
The Australian and New Zealand Guidelines for Fresh and Marine Water Quality () provides default values and criteria for physical, chemical and biological factors related to water quality and recommends that local values be determined. Reporting on Estuarine water quality is conducted using data collected through the NSW Government’s Estuary Health monitoring program and is based on local values for NSW estuaries.
Find out more about your local estuary
The NSW Estuary Health Monitoring Program (; ) monitors waterway health by measuring chlorophyll a concentration, turbidity, nutrient concentrations and physical chemistry. The program has been collecting data from NSW estuaries since 2007, using the sampling design set out in Roper et al. (). The data has been used to calculate an Estuary Health Index, with levels for estuaries ranging from A (very good) to E (very poor) (). Both low dissolved oxygen and acidic conditions occur routinely but from event-based conditions in many estuaries, particularly from larger coastal systems from the Hunter River north to the Tweed River. Data on low oxygen content have not been included in the index as no chronic problems have been found, with the exception of infrequent low oxygen levels from flood events in the Hunter, Richmond and other rivers that the program is not designed to detect.
Similarly, chronic and event based acid and heavy metal impacts from coastal floodplain drainage are not reported at a State scale. Some data is available from local sources, such as the Rous County Council dashboard for the Richmond River. Statewide or long-term monitoring of pesticides, herbicides or many other industrial contaminates, and their impact on coastal, estuarine and marine environments remains a knowledge gap.
Data is available on estuarine turbidity and chlorophyll a from July 2007 to March 2021 (DPIE data). The result of the turbidity and chlorophyll analyses have been combined into an overall score for each estuary for every year sampled. The scores show that 71% of estuaries in NSW rated A or B (in good condition) and 10% of estuaries are rated D or E (in poorer condition). Divided into three regions, estuaries in the state showed:
- Northern estuaries - 74% had a good (A or B) ranking, and 8% a poorer (D or E) ranking
- Central estuaries - 53% had a good (A or B) ranking, and 17.5% a poorer (D or E) ranking
- Southern estuaries - 81% had a good (A or B) ranking, and 4% a poorer (D or E) ranking.
Estuaries with more catchment disturbance have had poorer results for both chlorophyll a and turbidity, as can be seen by the many grades for estuaries in the 2016–2021 period from Newcastle to Wollongong in Map 20.2.
Map 20.2: Estuarine catchment gradings 2016–2021
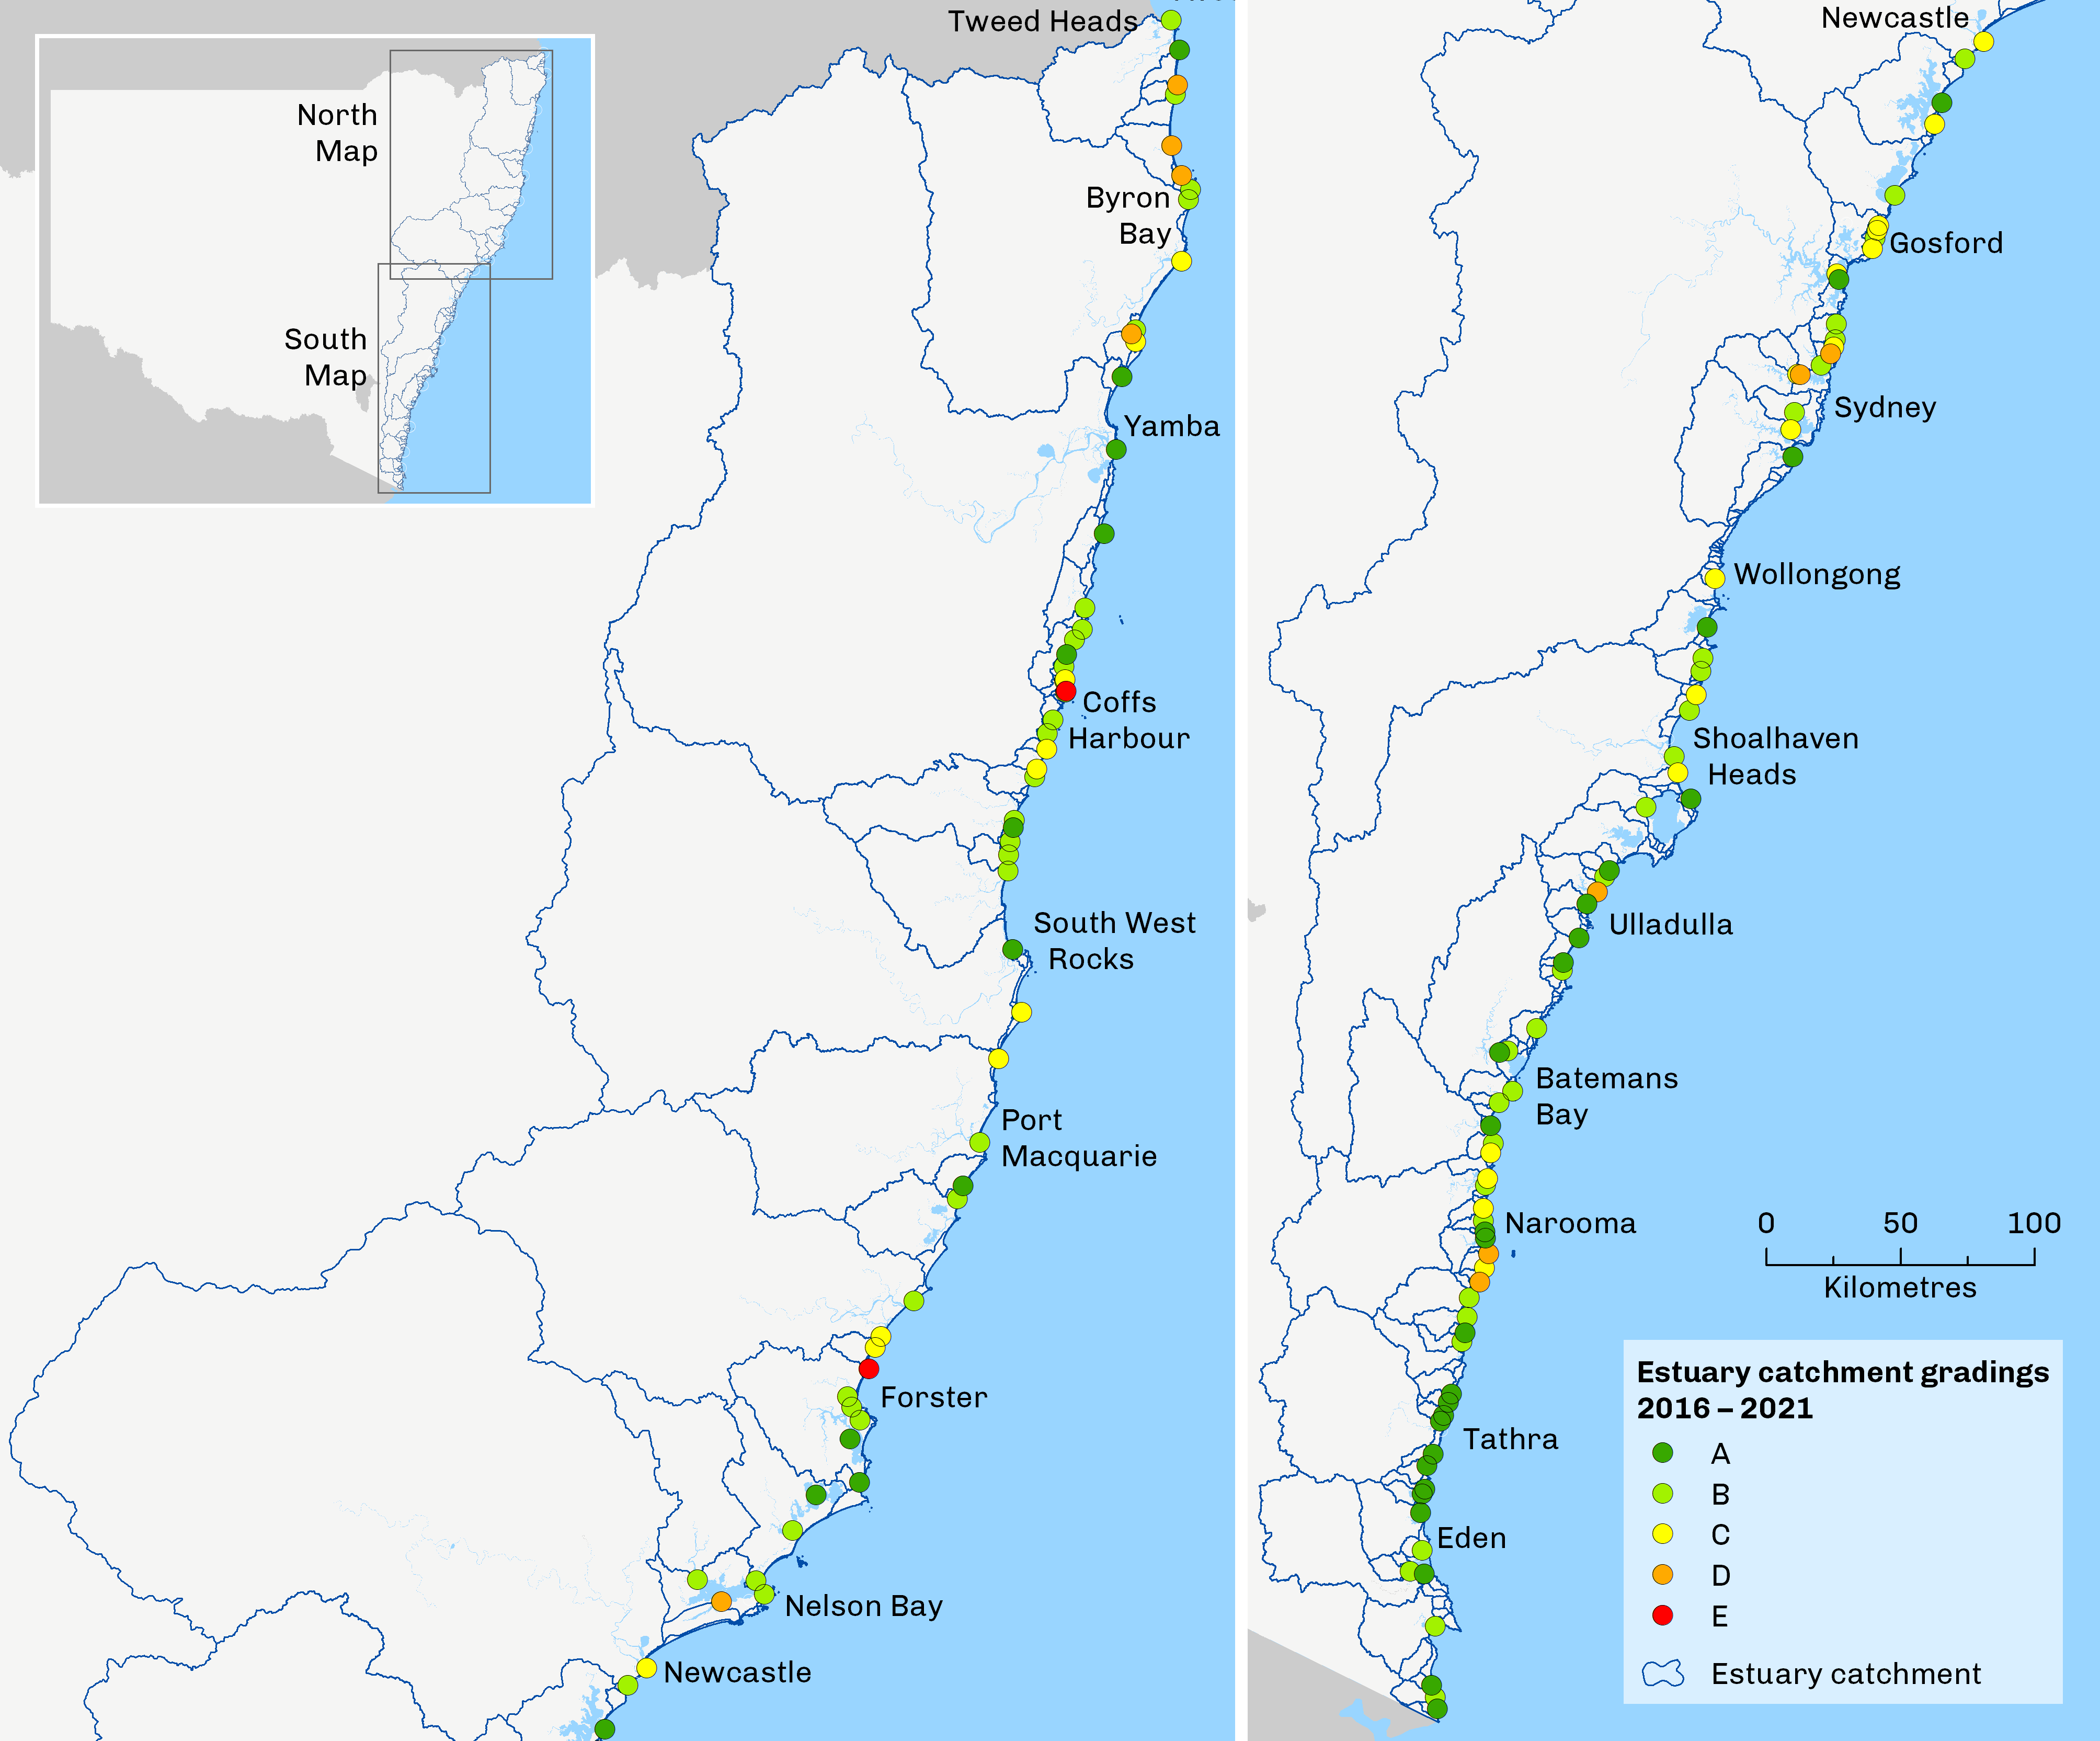
Some estuaries have consistently poor or very poor grades, for example, Hunter River, Terrigal Lagoon, Avoca Lake, Hawkesbury River, Manly Lagoon, Parramatta River, Cooks River, Towradgi Creek and Fairy Creek. These are all located in extensively developed catchments with large amounts of stormwater and some are subject to sewage discharges.
On the north and south coasts there are some consistently poor grades, for example:
- Brunswick River, Belongil Creek, Salty Lagoon, Evans River and Flat Top Point Creek, from sewage impacts
- Coffs Creek from urban and agricultural impacts
- Tilligery Creek, Karuah River and Tilba Tilba Lake from agricultural impacts.
Other systems have shown an improving trend such as Wallamba River (agricultural), Durras Lake and Nadgee Lake (both natural cycles) and Myall Broadwater (intermittent rainfall-driven variation).
Seafood harvest and production from estuaries is closely monitored under food safety programs administered by the NSW Food Authority.
Aquatic vegetation
Along the NSW coast, aquatic vegetation falls into two broad categories – coastal vegetation and aquatic plants:
- Coastal vegetation, such as dune grasses, coastal heath and woodland and back-beach swamp ecosystems, are important for the overall health of coastal environments.
- Aquatic plants can be submerged or partially submerged and are attached to rocky features, such as reef or headlands, or can be rooted in sediments. Along the coast there are significant areas of canopy-forming macroalgae such as kelps. In more sheltered estuaries, plant communities tend to be dominated by seagrasses, mangroves and saltmarshes. Aquatic plants help maintain water quality, sediment stability and supporting aquatic biota.
Trends in the extent of aquatic plants (estuarine macrophytes) across NSW have been examined by NSW DPI by analysing aerial photos and using field validation since about 1980, although many of the major stressors due to land-use changes and poor pollution practices occurred decades earlier. Nevertheless, there are numerous ongoing pressures due to urbanisation of the coastal zone, in particular shading from artificial structures, such as jetties and pontoons, expansion of other marine infrastructure, physical damage from boating activities, such as block and chain moorings and anchors, and catchment inputs.
Current DPI Fisheries mapping is done from high-resolution aerial imagery using image analysis software and field validation, including the use of drones. In contrast, the 1980s maps were based on relatively coarse-scale aerial imagery from which boundaries of habitats were hand drawn and validated with some field surveys (). As such, estimates of change since the 1980s tend to be indicative of the direction of change rather than the magnitude. The data from the past 20 years, from the 2000s onwards, presents a more accurate picture of trends and changes and has been used to report on the status of salt marshes, mangroves and seagrasses. Estuarine macrophyte maps for different times can be viewed and compared on the DPI Fisheries Estuarine Habitat Dashboard.
The summer of 2019–2020 had some of the most extensive and intense bushfires ever recorded in NSW (see topic), to the extent that estuarine wetlands were directly burnt in some cases and heat-affected in others. Fire-affected saltmarsh and mangroves in wetland habitats previously mapped by DPI Fisheries were identified using a combination of satellite image interpretation by EES, followed by Object Based Image Analysis (OBIA) of aerial photography (60 cm/pixel resolution) relative to previously-mapped wetland habitats by DPI Fisheries. Field validation was not possible for most locations, so the estimates of fire-affected wetlands (Table 20.1) are approximate only. Recovery of these habitats is not being monitored systematically, but burnt saltmarsh (especially grassy species of Sporoblus and Juncus) was seen to be re-sprouting a few months after the fires, as quantified previously (). It is unclear to what extent more succulent species, such as Sarcocornia quinqueflora may have been burnt or recovered.
Table 20.1: Approximate percentages of previously mapped mangrove and saltmarsh habitats affected by the 2019–2020 bushfires
| Estuary | Mangroves | Saltmarsh |
|---|---|---|
| Berrara Creek | 0% | 48% |
| Burrill Lake | 0% | 1% |
| Camden Haven River | 10% | 10% |
| Candlagan Creek | 2% | 14% |
| Clyde River | 7% | 17% |
| Durras Lake | 0% | 12% |
| Fisheries Creek | 0% | 12% |
| Khappinghat Creek | 0% | 38% |
| Lake Innes / Cathie | 0% | 18% |
| Lake Tabourie | 0% | 40% |
| Manning River | 0.04% | 26% |
| Moruya River | 1% | 2% |
| Narrawallee Inlet | 4% | 10% |
| Nullica River | 8% | 6% |
| Tomaga River | 0.4% | 5% |
| Towamba River | 1% | 0.4% |
| Wallis Lake | 0.3% | 3% |
| Wonboyn Lake | 32% | 71% |
Saltmarsh
Saltmarshes occur in 119 NSW estuaries, with the dominant species being Sarcocornia quinqueflora (samphire), Suaeda australis (seablite), and the grass-like (salt-couch) species Sporobolus virginicus and Paspalum vaginatum.
The distribution of saltmarshes has been mapped at least twice in most estuaries in NSW, with many now having been mapped three times since 1980 and 10 estuaries having been mapped four times. Of the 52 estuaries that have been mapped on more than two occasions, there have been consistent declines in saltmarsh areas in nine. However, some changes may have been missed because the saltmarsh area was likely to have been underestimated in the earliest maps due to poor image quality and less sophisticated mapping technologies.
DPI Fisheries has mapped saltmarsh habitats in 13 estuaries since 2017, all had been mapped at least once before (see Figure 20.1). Of these estuaries, 62% have shown a decline in areas of saltmarsh, with 38% showing a moderate to severe decline (>20% loss).
In the northern region of NSW from Tweed River to Port Stephens, saltmarsh habitat is present in 44 estuaries which accounts for over 60% of the state’s saltmarshes. Saltmarsh extent has remained stable in the Manning River, but has declined by 20% in the Richmond River and Port Stephens over the last 15 years. In most areas, this has been due to mangrove incursion into saltmarsh, rather than a loss of intertidal wetland area (see section on Mangroves below).
Saltmarsh habitat in the central region from the Hunter River to Port Hacking is present in 14 estuaries, with the largest areas in the Hunter River, the Hawkesbury River, Botany Bay and Brisbane Water. The extent of mapped saltmarsh in Brisbane Water in 2020 was 45% less than in 2005, with large declines in saltmarsh extent also recorded at Pittwater and Botany Bay over the last approximately 15 years (Figure 20.1). At least some of these changes seem to be related to concomitant increases in mangroves, as has been observed in other estuaries (; ).
Saltmarsh is present in 60 estuaries in the southern region of NSW, with the largest area in the Shoalhaven River, followed by Jervis Bay and the Clyde River. Saltmarsh areas have remained relatively stable in the six estuaries mapped over the last 15 years (see Figure 20.1).
Figure 20.1: Area of saltmarsh in NSW estuaries that have been re-mapped within the last five years
Notes:
Includes estuaries mapped twice or more since 2000. Data for any previous maps (excluding 1980s which used different methods) have been included to enable an assessment of temporal trends. Data from tributaries of Port Jackson, Botany Bay and Jervis Bay have been amalgamated for this graph.
Mangroves
There are six mangrove species in NSW, with the two most common being the grey mangrove (Avicennia marina) and the river mangrove (Aegiceras corniculatum).
Mangroves occur in 86 NSW estuaries, being largely absent from intermittently open lagoons, lakes or creeks. Mangroves have been spreading in many NSW estuaries, often into areas of saltmarshes, which may be related to various human activities and sea-level rise (; ; ; ).
DPI Fisheries has mapped the distribution of mangroves and saltmarsh in 52 estuaries on two or more occasions since 1980. For those areas mapped more than twice, there have been consistent declines in total mangrove area in three and increases in 17.
The majority of the state’s mangroves are found in estuaries of the northern region (from the Tweed River to Port Stephens) with remapping in the past 3–5 years showing the extent of mangroves in the Richmond and Manning rivers, and in Port Stephens has increased over the last 15 years (see Figure 20.2).
Mangrove habitat is present in 14 estuaries from the Hunter River to Port Hacking. The largest areas of mangroves are in the Hunter River, followed by the Hawkesbury River and Botany Bay. Four estuaries in this region that have been re-mapped in the last five years, and all have shown increases in mangrove extent (see Figure 20.2).
In the southern region (Minnamurra to Nadgee), 62% of mapped estuaries do not contain mangroves. Estuaries with the greatest area of mangroves are the Shoalhaven River, the Clyde River and Jervis Bay. Six estuaries in the southern region have been re-mapped in the last five years and mangrove area has increased in three of them (Figure 20.2). There was a subtle decline in mangrove area in Jervis Bay, whilst Lake Conjola lost 700 square metres of mangroves, specifically from the northern embayment called Berringer Lake. The cause of this latter loss is unknown but may be related to increased water levels in the lake while the entrance was closed. Mangroves were not known to occur in Burrill Lake in 1980 or 2002 and now 25 square metres of this habitat is present. Similarly, mangroves have been spreading in Lake Illawarra, increasing from a few scattered trees in the 1980s to now covering more than a hectare. Notably, the extent of mangroves in Wagonga Inlet more than doubled from 2002 to 2019 (Figure 20.2). The causes for these increases in area of mangroves are still unknown.
The most unusual losses of mangroves in recent years were due to the 2019–2020 bushfires, particularly where mangroves were adjacent to large trees such as Casuarina species. It is rare for mangroves to be burnt in bushfires (), but anecdotal observations suggest that many trees were killed by the fires although epicormic growth was observed on some damaged mangrove trees within five months of the fires. In some cases, mangroves (including their pneumatophores) were burnt, while in others damage may have been a consequence of radiant heat. Percentages of mapped mangrove habitat affected by the 2019–20 bushfires are listed in Table 20.1.
Figure 20.2: Area of mangrove in NSW estuaries that have been re-mapped within the last five years
Notes:
Includes estuaries mapped twice or more since 2000. Data for any previous maps (excluding 1980s which used different methods) have been included to enable an assessment of temporal trends. Note that 25 m2 of mangroves in Burill Lake in 2019 is not displayed on this graph due to the scale. Data from tributaries of Port Jackson, Botany Bay and Jervis Bay have been amalgamated for this graph.
Seagrasses
Seagrasses are found mainly in the shallow waters of protected estuaries and bays. Dominant species are strapweed (Posidonia australis) and eelgrass (Zostera muelleri ssp. Capricorni). Populations of Posidonia australis are listed as endangered under the Fisheries Management Act 1994 in six NSW estuaries due to recent declines in area (). Posidonia australis in the Manning–Hawkesbury bioregion is also listed as an endangered ecological community under the Environment Protection and Biodiversity Conservation Act 1999 (EPBC Act; ).
Seagrass meadows can be naturally dynamic, with some species of Zostera and Halophila showing high levels of natural variability in growth and extent over seasons or years ( in press). Although meadows of Posidonia can fluctuate in density according to season, meadow extent is relatively stable and enduring in the absence of human impacts ().
Posidonia occurs in 17 estuaries in NSW, from Wallis Lake down to Twofold Bay, and is also found in some sheltered, open coastal locations such as Broughton Island, Bushrangers Bay, Wreck Bay, Tollgate Islands, Barlings Island, Broulee Island and Bittangabee Bay ().
Over the past 40 years, 11 estuaries have been mapped more than twice, none have shown continual declines in Posidonia area. Recent data from the seven estuaries remapped in the last five years show variability over different time periods (Figure 20.3). Area extent of Posidonia declined by 18% in Port Jackson from 2003–18 and by 27% in Botany Bay from 2008–19. Over similar time periods, there were increases in Posidonia extent in Port Stephens, Brisbane Water, Jervis Bay and Wagonga Inlet. Although Posidonia area remained relatively stable in Pittwater, there were declines in Posidonia in the upper reaches of Pittwater from 2005–19 but these declines were offset by increases in Posidonia at the mouth of Pittwater. Site-specific declines in the extent of Posidonia in various estuaries around Sydney have also been documented (). Changes in the extent of mapped habitat within estuaries can be visualised on the NSW DPI Estuarine Habitat Dashboard.
Other seagrasses (combined areas of Zostera, Halophila and Ruppia) have been mapped in 13 estuaries over the last 5 years (Figure 20.4). It is difficult to interpret changes in these more transient species from such infrequent mapping. However, there have been substantial and consistent reductions in the extent of these seagrasses over the last decade in the most urbanised estuaries (Port Jackson and Botany Bay) and in Jervis Bay. Substantial declines in seagrass extent have also been observed in Port Stephens from 2004 to 2017 and in Minnamurra River between 2010 and 2020.
NSW DPI is continuing to investigate possible causes for declines in these seagrasses and recent experiments suggest that repeated low salinity events after heavy rainfall might have played a role in Port Stephens. The declines in species of Zostera and Halophila in Botany Bay appear to relate to sand movement in some areas around Towra Point, although declines have also occurred in the Georges River in recent years which need further investigation. Seagrass area also declined substantially in Minnamurra River between 2010 and 2020. Complete losses of seagrass were reported in Durras Lake in 2010, thought to be due to changed physical conditions after the lake entrance closed () and the population had begun to re-establish by 2015 and covered large areas by 2018 (). Similar large losses of seagrass were also observed in Lake Conjola and Burrill Lake around this time, and these populations have now largely recovered (Figure 20.4).
Figure 20.3: Area of Posidonia australis in NSW estuaries re-mapped in the last five years
Notes:
Includes estuaries mapped twice or more since 2000. Data for any previous maps (excluding 1980s when different methods were used) have been included to enable an assessment of temporal trends. Data from tributaries of Port Jackson, Botany Bay and Jervis Bay have been amalgamated for this graph.
Figure 20.4: Area of all seagrasses (excluding Posidonia) in NSW estuaries re-mapped in the last five years
Notes:
Includes estuaries mapped twice or more since 2000. Data for any previous maps (excluding 1980s which used different methods) have been included to enable an assessment of temporal trends. Data from tributaries of Port Jackson, Botany Bay and Jervis Bay have been amalgamated for this graph.
Macroalgae and barrens
Kelp forests are threatened by a range of stressors, including marine heat-waves, ocean warming, ocean acidification and pollution (; ; ).
Macroalgal abundances on shallow coastal rocky reefs are being monitored over time at selected sites by NSW DPI. Large losses of macroalgae have occurred in NSW in the past. The large, habitat-forming seaweed Phyllospora comosa was lost from the Sydney region approximately 45 years ago (). Video surveys have identified losses of kelp from offshore reefs on the mid-north coast, correlating with increases in abundances of tropical herbivorous fishes (). It has also been noted that abundances of the green seaweed Caulerpa filiformis are increasing on many shallow reefs across NSW, including new appearances in northern NSW some 500 kilometres beyond the species’ historical northern limit ().
Large-scale surveys of the distribution of intertidal and shallow subtidal macroalgae 2009 – 2013 revealed changes in composition associated with latitude and suggested possible effects of estuarine outputs on open coast reefs (). Long-term trends in abundance and condition of macroalgae have been monitored systematically across the entire state by DPI-Fisheries since 2019. Ongoing research is investigating reasons changes in the abundance of kelp related to increasing ocean temperatures and identifying possible refugia for kelp as the oceans warm ().
When macroalgae are removed from rocky reefs, areas of white coralline algae encrusted rock (also called ‘white rock’ or ‘barrens’) can remain. Barrens are typically created by grazing sea urchins (primarily Centrostephanus rodgersii, but also Heliocidaris erythrogramma) that either remove kelp or prevent it from reoccurring after its loss due to storm activity, reduced salinity or pollution (). Long-term patterns of barrens on shallow (under 10 metres) coastal reefs have been investigated using aerial imagery to produce results over large spatial scales. The extent of barrens are generally quite stable (about 10%) over the past 30 to 60 years at most sites between Killcare and Eden (). The extent of barrens increased around Sydney in the late 1990s and at Short Point (Merimbula) and Aragunnu between 1993 and 2014 and at Bermagui from around 2000 to 2015. The extent of barrens has, however, remained stable at Bermagui between 2015 and 2020 and declined by 8% at Aragunnu from 2004 to 2011 ().
Other ecosystems
In addition to habitats driven by aquatic vegetation, coastal and marine environments support other key ecosystems and biodiversity:
- Shellfish reefs can improve water quality as well as enhance local fisheries production and biodiversity. Estuarine fish associated with these ecosystems have been identified from the Port Stephens-Great Lakes Marine Park, which has been the site of the first large scale oyster reef restoration project in NSW ().
- Manmade structures such as artificial reefs, jetties, wrecks, and seawalls also increase habitat complexity to support fish and invertebrates along the NSW coast (). The Living Seawalls project aims to increase and monitor biodiversity changes along altered seawalls around Sydney ().
- Rocky reefs throughout NSW provide a hard substrate onto which sponges and other sessile habitat-formers can anchor, which in turn attracts reef-associated fish (; ). These fish assemblages are being monitored through the NSW Fisheries Statewide Fish Assemblage program which has shown clear bioregional patterns () and habitat associations of commercially important species (e.g. Snapper in ).
Through the Marine Integrated Monitoring Program, many of these ecosystems are now being more comprehensively characterised and monitored, and associated information will be available for the next SoE report.
Threatened species
Forty-seven marine species or populations (45 species and populations of two species) are currently listed as threatened (an increase of two since the NSW State of the Environment Report 2018) by the Fisheries Scientific Committee under the Fisheries Management Act 1994 (FM Act) and the NSW Threatened Species Scientific Committee under the Biodiversity Conservation Act 2016 (BC Act). These include:
- 22 marine seabird species (there are also 16 other marine birds including shorebirds, waders, eagles and hawks)
- seven marine mammal species
- eight fish species
- three reptile species
- four marine invertebrate species
- two macroalgal species
- one marine vegetation species.
Little is known of the status of many marine organisms, particularly invertebrates. The number of species listed will probably grow as pressures on the marine environment increase.
Poorly located or inappropriate coastal development is threatening the viability of fauna populations including threatened species. For example, studies have found adverse impacts from artificial lighting, including street lighting, on turtle hatchlings and breeding patterns () and a reduction in migratory seabird and shorebird habitat due to foreshore hardening and disturbance from recreational activity (; ).
See the topic for more information.
Pressures
Catchment disturbance
Most coastal catchments in the marine estate have some level of land-use activity or development. Only 12 of the 184 main catchments in NSW remain undeveloped, and these are mostly in the south towards the NSW and Victorian border ().
The most developed catchments, where over 80% of land is developed, are predominantly urbanised. Typically, urban areas are adjacent to main waterways, while agricultural areas, forestry and mining operations are in the upper parts of the catchment.
The top four threats to coastal and marine environments are associated with land-use intensification () and are:
- urban stormwater discharge
- modifications at the entrance of estuaries to enable access
- agricultural diffuse-source runoff in estuaries
- clearing riparian and adjacent habitat, including draining wetlands.
The extent of land-use activity in all coastal catchments has been summarised by a catchment disturbance index, which ranges from very low (5) to very high (1) disturbance. The index was derived for the NSW Monitoring, Evaluation and Reporting Strategy 2010–2015 (; ), and contains pre- and post-European pollution levels modelled using the NSW Government’s Coastal Eutrophication Risk Assessment Tool.
The sensitivity of estuaries to impacts resulting from land-use intensification varies according to the type of estuary, the likelihood of intensification and pollutant removal efficiency (). There are 93 estuaries identified as sensitive to impacts from land use () including:
- 25 in the northern region, 44–45% of estuaries are situated in areas with the highest population density and nutrient export from runoff and overflows. The region has the greatest hydrological modification of estuary function.
- 21 in the central region. The central region has the greatest levels of urbanisation, so 85% of estuary catchments with the highest population densities, and high levels of nutrients and sediment are exported to 70% of estuaries.
- 47 in the southern region. The region has just 17–18% of estuary catchments in areas of high population density and nutrient categories.
Table 20.2: Proportion of NSW estuary catchments in the two highest disturbance ranks (statewide) for population density, nutrient increase and commercial fish catch
| Factor | Number of estuaries with a high disturbance* | Number of estuaries | Percent** |
|---|---|---|---|
| Northern | |||
| Population density | 24 | 55 | 44% |
| Nutrient increase | 25 | 55 | 45% |
| Commercial catch | 5 | 55 | 9% |
| Population increase (>20%) | 20 | 55 | 36% |
| Central | |||
| Population density | 34 | 40 | 85% |
| Nutrient increase | 28 | 40 | 70% |
| Commercial catch | 1 | 40 | 3% |
| Training walls | 7 | 40 | 18% |
| Population increase (>20%) | 4 | 40 | 10% |
| South | |||
| Population density | 16 | 89 | 18% |
| Nutrient increase | 15 | 89 | 17% |
| Commercial catch | 3 | 89 | 3% |
| Training walls | 9 | 89 | 10% |
| Population increase (>20%) | 36 | 89 | 40% |
Notes:
* Estuaries with a disturbance rank of 1 or 2.
** Percentage of estuaries with training walls (modifications) and proportion of estuaries with a more than 20% increase in population between 1996 and 2006 in the northern, central and southern regions.
Pollution
The most significant priority threats to environmental values from water pollution are urban stormwater discharge, agricultural diffuse source runoff and solid waste, marine debris and microplastics (BMT WBM 2017, MEMA 2018).
Discharge of nutrients, sediments, metals, toxins and other chemicals and pollutants into coastal waters also occurs from the many small catchments along the coast. This often involves untreated urban stormwater and agricultural runoff. Some catchments have licensed discharges from industries such as those dealing with minerals production and refining and sewage treatment plants. Figure 20.5 shows licensed discharge loads of total nitrogen, phosphorus and suspended solids to open marine waters and estuaries, for those industries licensed under the load-based licensing scheme. This shows while the trend is relatively stable, there were two periods in recent years (2016–17 and 2018–19) where discharges increased in open coastal waters. The loads discharged to estuarine environments have been generally decreasing since 2011–12 with fluctuations of discharges of suspended solids tending to reflect wet and dry periods, such as El Niño and La Nina cycles.
Figure 20.5: Licensed discharges to NSW open marine waters and estuaries 2000–01 to 2019–20
Notes:
Data covers all licensees discharging into marine and estuarine waters under the load-based licensing scheme (not all licensees are captured by this scheme).
Historic data is updated periodically following audits and reviews.
Some results for total suspended solids (estuarine) were over-estimated in the NSW State of the Environment 2018 report and have been corrected here.
Urban stormwater and agricultural runoff are recognised as significant contributors of nutrients to marine waters. Refer to the status and trends section of this topic for detail on nutrients and water quality. Additional sources of coastal and marine pollutants include:
- garbage washed or blown from land
- discarded commercial and recreational fishing gear
- material from shipping operations and incidents, such as ballast water discharges and sewage released from vessels, and oil or chemical spills.
No major shipping-related pollution incidents have been recorded in NSW marine waters over the last three years. However, in Commonwealth Waters in June 2018 cargo loss from the Liberian-flagged ship, YM Efficiency, approximately 30 kilometres off the coast of Port Stephens resulted in debris in NSW waters and on the Mid North Coast and Nelson Bay peninsula.
Entanglement and ingestion of debris can be fatal to marine species, particularly threatened species such as seabirds, turtles and whales. The NSW Government’s Biodiversity Conservation Act 2016 lists ‘entanglement in or ingestion of anthropogenic debris in marine and estuarine environments’ as a key threatening process. Recovery in the populations of threatened species, such as humpback whales, is likely to result in more accidental entanglements.
As much debris is plastic, which both floats and is slow to degrade, the impacts are multiple and long-lasting. See the topic in this report for more details.
Climate change
‘Human induced climate change’ is listed as a key threatening process under the Fisheries Management Act 1994 (FSC 2010) and ‘anthropogenic climate change’ under the Biodiversity Conservation Act. Key components of climate change that are considered to have potential impacts on the NSW marine environment () are:
- altered storm and cyclone activity, flooding, storm surge and inundation
- altered ocean currents and nutrients
- climate and sea temperature rise
- sea-level rise
- ocean acidification.
Sea-level rise, major storms and floods are having adverse impacts on coastal geomorphological processes including the cyclic accretion of sand onto beaches. The loss of sand from beaches and other changes to the NSW coast due to sea-level rise, storm surges and inundation will continue to impact on coastal amenity.
Predictive studies show that the change in the movement and flow intensity of the East Australian Current could greatly affect future species distributions in NSW estuaries (), though this is an area that requires further research.
Climate change can result in increased water temperatures, often known as ‘marine heat waves’ with extreme consequences for the survival of marine and estuarine animals and plants, changes in the ranges of many species. Changes in tidal levels from modifications to estuary entrances and sea-level rise have major consequences for critical marine habitats, such as beaches, mudflats, seagrasses, mangroves and saltmarsh, with flow-on consequences for all the organisms that rely on them (). Climate driven processes such as floods, drought and temperature stress with hypoxic blackwater (depletion of dissolved oxygen) events following large floods and the breakdown of algal blooms can be responsible for fish kills (see topic).
The long-term impacts of climate change will magnify effects on the NSW marine environment. Significant effects are expected to occur across south-east Australia (; ; ), including changes to:
- the distribution and abundance of marine species
- variations and timing of life cycle events
- physiology, morphology and behaviour (such as rates of metabolism, reproduction and development)
- biological communities via species interactions.
Further specific studies have identified that increases in temperature are likely to result in:
- the spread, establishment and virulence of pathogens and exotic species (; ; )
- changes in the range and distribution of harvested species ()
- changed composition and interactions in aquatic communities and the structure and dynamics of communities ()
- disease in seaweeds and invertebrates (; )
- a poleward contraction of marine organisms and habitats (; )
- a reduction in kelp habitat and associated change in community composition and ecosystem function, particularly in northern NSW.
Ocean acidification may emerge as an important pressure in future decades with evidence of impacts on calcifying immobile animals (; ; ; ). A particularly vulnerable group is marine molluscs (oysters, abalone and whelks) in their reproductive stages (; ). Acidification already interacts with temperature to reduce successful fertilisation in Sydney rock oysters, resulting in their smaller size, longer time to develop and increased abnormality of larval stages () and, with other stressors, to limit survival ().
Temperature increases and pH declines in NSW estuaries are occurring at higher rates than predicted by global ocean and atmospheric models. For lagoon and river estuaries these changes are an order of magnitude faster than predictions ().
See the topic for more details.
Marine pest species
Marine pest species are plants, algae, invertebrates or animals, often introduced from overseas, that can take over habitats, directly compete with native species for food and introduce viruses and disease. Some marine pests are native to other regions of Australia but have been transported into NSW through vectors such as vessels or the aquarium trade.
The main marine pest species in NSW are:
- Caulerpareen alga (Caulerpa taxifolia)
- European green crab (Carcinus maenas).
Other marine pests that have previously been detected in NSW include:
- European fan worm (Sabella spallanzanii)
- Japanese goby (Tridentiger trigonocephalus)
- New Zealand screw shell (Maoricolpus roseus)
- Yellowfin goby (Acanthogobius flavimanus)
- Non-native seasquirt (Botrylloides giganteus)
- Devils tongue weed (Grateloupia turuturu)
- Pachymeniopsis (Red macroalgae) (Pachymeniopsis lanceolata).
It is an offence under the NSW Biosecurity Act 2015 to bring into or release an aquatic pest species into NSW waters.
NSW DPI Aquatic Biosecurity is developing a five-year marine pest species surveillance plan to be implemented in June 2022. Previously, NSW had no statewide monitoring program for marine pest species, although much research and monitoring followed after Caulerpa (Caulerpa taxifolia) was detected in 2000 and ad hoc monitoring has been done for different species in specific locations.
Control of marine pest species has been somewhat successful but is expensive and time consuming. Caulerpa taxifolia was particularly abundant in Burrill Lake and Lake Conjola but has not been seen in either lake since 2013. Wallagoot Lake was officially declared free of Caulerpa in 2013 when surveys failed to detect the presence of the marine pest following significant control efforts. Over recent years, Caulerpa has been reported in 14 estuaries or lakes from Lake Macquarie to Wallagoot Lake in the south. Caulerpa continues to persist in Lake Macquarie with a new highly populated creek area confirmed during 2018.
There are historical reports of the European green crab from estuaries as far north as Port Jackson, but there have been no recent sightings in any estuaries north of Narawallee Inlet. Surveys since 2011 have documented the presence of the pest in 27 estuaries south of Narawallee Inlet to the Victorian border (DPI data).
The European fan worm was known only in Twofold Bay until April 2013 when it was also discovered in Botany Bay (). The origins of this Botany Bay population are unclear and could be from either southern Australia or New Zealand ().
Disease issues
Monitoring and management of aquatic animal diseases is important. Introduced pathogens and parasites, or amplification of endemic diseases can threaten biodiversity by causing diseases in native species as well as impact aquatic industries. Two diseases currently of concern in NSW marine and estuarine environments are – Epizootic Ulcerative Syndrome and Queensland Unknown.
Epizootic Ulcerative Syndrome
Commercial and recreational fishers reported a higher incidence of ulcerated fish from various estuaries (Macleay, Brunswick, Richmond, Clarence and Hastings Rivers) in early 2021. Samples from the Brunswick River, Richmond River, Evans Head and Bega River were found to be consistent with Epizootic Ulcerative Syndrome (EUS) also known as “red spot”. Multiple other locations also had reports of suspected EUS, however, suitable samples were not available for laboratory confirmation.
EUS Aphanomces invadans is caused by a fungus known to be widespread in aquatic environments. Outbreaks of EUS are often associated with environmental stressors such as low salinity following periods of significant rainfall or other environmental changes. EUS can affect a very wide range of fish species, with mullet, bream and whiting frequently reported as affected during periods of EUS activity.
The NSW DPI continues to manage EUS as notifiable matter under Schedule 1 of the Biosecurity Regulation 2017. It is a requirement to report suspicions of this notifiable disease. NSW DPI will co-ordinate submission of representative samples, where suitable material is available, for laboratory testing from estuaries in which ulcerated fish have been observed.
Queensland Unknown
In August 2021 the NSW DPI detected Queensland Unknown (QX) in samples of farmed Sydney Rock Oysters in Port Stephens. QX is considered endemic in NSW, however there have been no previous reports of clinical QX in Port Stephens and the estuary was previously classified as a low QX risk area, as described in the QX Disease Biosecurity Zone under the NSW Biosecurity Regulation 2017.
QX is a disease caused by the protozoan parasite Marteilia sydneyi, which can cause devastating mass mortality events in Sydney Rock Oysters (Saccostrea glomerata). Other species of oyster in cultivation in NSW are not known to be affected by QX disease. In clinical disease the organism enters the oyster and undergoes spore production and destroys the gut of the oyster leading to starvation and ultimately death of the affected oyster over a period of weeks to months.
The disease is not directly transferred between oysters and triggers for disease outbreaks are not fully understood, although disease outbreaks are often associated with environmental variation such as low salinity and high-water temperature. The life cycle of QX is complicated and has not yet been fully recognised or replicated. There is evidence to suggest a complex life cycle with at least one intermediate host, suspected to be a polychaete worm.
Historically, QX was known to be a recurrent disease in south east Queensland and estuaries in northern NSW. However, in 1994, QX disease was detected in the Georges River and within a few years resulted in the near collapse of the Sydney Rock Oyster industry in that estuary. QX disease was subsequently detected in the Hawkesbury River in 2004 and likewise caused the virtual collapse of Sydney Rock Oyster cultivation in that waterway.
Restrictions on the movement of oysters and oyster cultivation equipment from Port Stephens will continue under the Biosecurity (QX Disease) Control Order 2021 until further surveillance in Autumn 2022 is completed and ongoing management of Port Stephens under the QX Biosecurity Zone is established.
Resource use
Marine resource use, including shipping, recreation and tourism, dredging, modified and freshwater flows, are identified as sources of threats to coastal, estuarine and marine systems in NSW ().
Commercial and recreational fishing have potential cumulative impacts on fish assemblages and trophic structures (). Two commercial fisheries operate in NSW estuarine waters:
- estuary general fishery
- estuary prawn trawl fishery.
Commercial fishing is permitted in only 76 of the 184 estuaries along the NSW coast, with recreational fishing permitted in most estuaries.
The following fisheries operate in NSW coastal and marine waters:
- ocean trap and line
- ocean trawl
- ocean hauling
- lobster
- sea urchin and turban shell
- abalone
- southern fish trawl.
Recreational fishing occurs throughout estuarine, coastal and marine waters of NSW. Most recreational fishers use line fishing to catch different species. The composition of the recreational catch varies along the coast, mostly reflecting differences in the distribution of the key targeted species, with many of the same species also harvested in commercial fisheries.
Commercial and recreational fishing, and aquaculture may place pressures on fish numbers as well as the broader environment by:
- reducing the abundance of species and interfering with the natural food chain
- causing incidental by-catch, including species of conservation concern
- disturbing wildlife and the marine environment
- injuring species, either directly or indirectly
Impacts on fish populations vary considerably and are influenced by:
- the number, type and stock status of harvested species
- levels of fishing
- type of specific management arrangements.
There are 260 aquaculture businesses operating 3,150 hectares of leases in 33 estuaries as well as in Jervis and Twofold bays. The oyster industry is the state’s largest seafood sector. The land based farmed prawn industry and marine finfish and shellfish hatcheries also rely upon access to high quality seawater. A recent trend has seen agri-tourism associated with aquaculture ventures along the NSW coastline. Sustainable Aquaculture Strategies for Land Based, Oyster Industry and Marine Waters are in place to detail best industry practice for design, operation and water quality protection.
Several threatened and protected species managed under the Fisheries Management Act 1994, particularly Greynurse Shark, White Shark and Black Rockcod, are threatened by:
- illegal fishing
- injury due to fish hooks and accidental capture by fishers
- entrapment in shark mesh nets.
Hook and line fishing in areas important for the survival of threatened fish species is listed as a key threatening process under the NSW Fisheries Management Act 1994. The NSW shark meshing program in NSW is also listed as a key threatening process under the Fisheries Management Act 1994 and the Biodiversity Conservation Act 2016.
Responses
Legislation and policy
Marine estate management framework
The Marine Estate Management Act 2014 provides for the strategic and integrated management of the NSW marine estate. The Act required an environmental, social and economic threat and risk assessment of the entire marine estate, including coastal waters, lakes and lagoons, estuaries and coastal wetlands.
NSW Marine Estate Threat and Risk Assessment () identified the pressures on the environmental assets and the social, cultural and economic benefits derived from the NSW marine estate up to the tidal limits and offshore to three nautical miles. It considered how activities create stresses on natural assets and the threat this poses to benefits. The findings of the assessment informed the development of the Marine Estate Management Strategy 2018–2028 () as well as new marine park management plans and related coastal management programs. The assessment is scheduled for a five-year review in 2022.
Coastal management framework
The NSW Coastal Management Act 2016 established a framework for coastal management in NSW which comprises:
- State Environmental Planning Policy (Coastal Management) 2018 (CM SEPP)
- the NSW Coastal Management Manual
- coastal management programs
- the NSW Coastal Council
- Coastal and Estuary Grants Program.
The Coastal Management Act defines the coastal zone which is comprised of four coastal management areas. The CM SEPP includes maps of the coastal zone and coastal management areas and establishes development controls to be applied in each to achieve the Act’s objectives. Coastal management in NSW supports the objects of the Marine Estate Management Act.
Environment protection legislation
The Environmental Planning and Assessment Act 1979 sets the framework for land-use planning decisions. It is complemented by state environmental planning policies (SEPPs) that deal with planning issues for the coastal zone, including matters arising under the CM SEPP, SEPP No. 50 – Canal Estate Development and SEPP (Primary Production and Rural Development) 2019.
The Protection of the Environment Operations Act 1997 regulates point source discharges into coastal, estuarine and marine environments. The Act requires certain commercial and industrial facilities to hold an environment protection licence administered by the NSW Environment Protection Authority (EPA) under the Protection of the Environment Operations (General) Regulation 2021.
The EPA regulates discharges to water using conditions it places on the licences. Under the Regulation, some EPA licensees are required to pay part of their licence fees based on the loads of certain air and water pollutants their activities release into the environment. This load-based licensing scheme provides an ongoing economic incentive for these licensees to reduce their pollutant loads.
Fisheries management legislation
The Fisheries Management Act 1994 and supporting regulations aim to conserve, develop and share fishery resources for the benefit of present and future generations by:
- conserving fish stocks and key fish habitats
- protecting threatened species, populations and ecological communities of fish and marine vegetation
- promoting ecologically sustainable development.
Programs
Coastal management programs
Coastal Management Programs (CMPs) set the long-term strategy for coordinated management of the coast, with a focus on achieving the objects of the CM Act. They are prepared by local councils in consultation with their communities and relevant public authorities. The coastal management manual provides mandatory requirements and guidance for CMPs by local councils. CMPs are key mechanisms in the implementation of actions identified in the Marine Estate Management Strategy.
The Marine Estate Management Strategy
The Marine Estate Management Strategy 2018–2028 () was developed by the Marine Estate Management Authority and includes nine initiatives and 53 actions to address the identified threats to the environmental assets and community benefits derived from the NSW marine estate. The strategy provides a framework for managing the marine estate as one continuous system over the strategy’s 10-year course to 2028. The initial stage has focused on building the foundations and establishing projects to reduce threats posed by water pollution and marine litter as a priority over a ten year timeframe, with a suite of other complementary projects to:
- deliver healthy coastal habitats and sustainable land use
- protect Aboriginal cultural values
- reduce threats to marine wildlife
- deliver safe and sustainable fisheries and recreational boating
- enhance social, cultural and economic benefits.
The implementation of the Strategy includes many partner agencies, industry, key stakeholders and community collectively addressing social, cultural, economic and environmental threats on the marine estate in a coordinated way. Management of Sea Country by Aboriginal people has been embedded in the Strategy to ensure traditional knowledge and cultural practices are considered, shared and influence decision-making.
Other NSW litter programs, include a container deposit scheme – see topic.
The Marine Integrated Monitoring Program
The Marine Integrated Monitoring Program 2018–28 (MIMP) monitors the progress of the Marine Estate Management Strategy in delivering outcomes. The MIMP guides monitoring, evaluation, and reporting activities over the life of the Strategy including to:
- monitor the condition of environmental assets and how the community benefits from the marine estate to inform a mid-term health-check
- evaluate the effectiveness of the Strategy in reducing priority threats
- fill in key knowledge gaps identified in the NSW Marine Estate Threat and Risk Assessment.
To accomplish these purposes monitors, evaluates and reports on the program.
The Risk-based Framework
The Risk-based Framework for Considering Waterway Health Outcomes in Strategic Land-use Planning Decisions () is a protocol to help decision-makers manage the impact of land-use activities on the health of NSW waterways. It enables decision-makers to determine management responses, which meet waterway health outcomes that reflect the community’s environmental values and uses of waterways.
Marine Water Quality Objectives
Marine Water Quality Objectives for NSW Ocean Waters () describes the water quality needed to protect the community's values for, and uses of, the marine environment and are used in coastal planning and management planning strategies covering land use and catchment management.
AdaptNSW
The NSW Government’s AdaptNSW website has information and tools to help government, businesses and communities build resilience in the face of future extreme events and hazards. Research is ongoing to understand risk to and management of the impacts of climate change on coastal and estuary zones.
Regional plans
Regional plans have been developed across the state to plan for future population needs for housing, jobs, infrastructure and a healthy environment. These plans set a strategic direction for rapidly growing coastal regions.
Harvest Strategies
Harvest strategies provide best-practice frameworks for assessment and management of fisheries resources. The NSW Government is in the process of developing a policy framework and harvest strategies that will provide improved assessment, monitoring and management objectives with an initial focus on commercial harvest.
Sustainable Aquaculture Strategies
Sustainable aquaculture strategies have been developed to guide seafood production that supports the future demands of food security for the state.
The NSW Oyster Industry Sustainable Aquaculture Strategy 2021 - Fourth Edition () outlines industry best practice, a streamlined approvals process and how to secure oyster leases for future generations and highlights protection of water quality. It is complemented by the Healthy Estuaries for Healthy Oysters Guidelines (). The guidelines aim to not only protect environmental conditions required for healthy oyster production, but also to improve estuarine water quality to benefit recreational users, tourism and recreational and commercial fisheries.
A NSW Marine Waters Sustainable Waters Aquaculture Strategy has been drafted to set the strategy for the NSW Government to co-ordinate development of the marine aquaculture industry. It provides regulatory and industry best practice framework for development of the NSW marine waters aquaculture industry in an ecologically sustainable and socially responsible manner.
NSW Shellfish Program
Under the NSW Shellfish Program individual harvest areas throughout the state are classified according to sanitary status. Annually the industry collects around 6,000 to 10,000 water and shellfish samples that are analysed for microbiological status, phytoplankton composition, biotoxins, heavy metals, pesticides, polychlorinated biphenyl (PCBs), Polycyclic aromatic hydrocarbons (PAHs) or other compounds of potential concern to public health. The program covers 76 shellfish harvest areas located in 28 estuaries and embayment's from Tweed River in the north to Wonboyn Lake in the south. The classification of each harvest area is reviewed annually based on the monitoring undertaken by the oyster industry.
The harvest areas are included in the NSW Fisheries Spatial Data Portal (under Extra Aquaculture Layers). Each harvest area is classified as either:
- Approved (the cleanest areas - direct harvest and sale of shellfish is allowed)
- Restricted (some low level microbiological concerns - shellfish must be depurated prior to sale)
- Prohibited (harvest not allowed due to unmanageable food safety risk)
The Shellfish harvest classification implementation was completed across all harvest areas by 2006, and following steady improvement, currently more than 50% of harvest areas are classified as approved (Figure 20.6).
Figure 20.6: Shellfish program individual harvest areas 2000-2021
Fisheries Compliance
NSW DPI Fisheries Compliance works to reduce the risks to fish stocks and aquatic habitats in NSW. Fisheries officers operate from 28 strategically placed locations along the coast and inland to ensure compliance in all recreational fishing, commercial fishing, aquaculture, and marine protected areas programs in NSW (including aquatic reserves and marine parks).
Using a risk-based approach the group strives to optimise compliance with fisheries and marine estate management rules by maximising voluntary compliance and creating effective deterrence against illegal activity.
Each year fisheries officers detect around 6,000 offences and seize more than 40,000 illegally obtained fish and 3,000 items of illegal fishing gear.
Further detail on marine protected areas is in the Protected areas topic.
Non-government initiatives
Teaching and research facilities contribute data and information to Government initiatives. The Sydney Institute of Marine Science (SIMS) is a partnership between Sydney’s four main universities (Macquarie University, Sydney University, the University of New South Wales, and The University of Technology, Sydney) and several research institutes, including the Australian Museum. SIMS has over 100 scientists and graduate students associated with the Institute and represents a broad array of projects. It provides information directly to policy makers and managers in NSW.
Flagship projects run through SIMS include the World Harbour Project, Living Seawalls, the NSW node of the Integrated Marine Observing System (IMOS), and the Sydney Harbour Research Program.
Australian Government activities
The National Water Quality Management Strategy (NWQMS) is a joint national approach to improving water quality in Australian and New Zealand waterways. The NWQMS involves development and implementation of management plans for estuaries, coastal waters and other water bodies by the community and government. These plans focus on the reduction of pollution released into coastal pollution hotspots and other aquatic ecosystems around the country. The Great Lakes (Wallis, Smiths and Myall Lakes), Botany Bay, and the Hunter River estuary and its catchment have been identified as NSW water quality hotspots.
Local government, community organisations and other agencies carry out these plans using the NWQMS to protect agreed environmental values.
Future opportunities
The NSW Government will need to continue to develop and implement suitable management and adaptation strategies to plan for climate change and prevent a decline in the quality of coastal, estuarine and marine environments. The poor condition of water quality in some highly urbanised estuaries suggests that stormwater runoff and new urban development can be managed better to maintain the health of estuaries and coastal lakes and the desirability of coastal lifestyles.
A molecular database will be generated for NSW estuaries to help assess biodiversity in each estuary and allow assessment of species occurrences and range shifts for finfish, crustaceans and molluscs statewide.
While trends in aquatic vegetation have been monitored systematically, understanding coastal vegetation, such as dune grasses, coastal heath and woodland and back-beach swamp ecosystems, is also important for the overall health of coastal environments.
Vulnerability to inundation and coastal erosion should be a significant consideration in the location and planning of future developments for an expanding population.
Other areas of further improvement could include:
- improved collaboration between the community, local, state and national governments and research institutions to further enhance the shared management of the marine estate and its resources
- enhance indicators for water health by including additional water monitoring datasets, such as harvest area classifications and analysis of historic data trends within the NSW Shellfish Program dataset (faecal coliforms, E.coli, phytoplankton, salinity, temperature and water level monitors)
- improved communication and education opportunities in all aspects of coastal and marine management to raise awareness, enhance community stewardship and influence positive behaviours
- strengthening comprehensive ecosystem health monitoring programs and sharing data to provide sound scientific input to decision-making
- boosting social, cultural and economic research and monitoring capabilities within Government to ensure decisions are based on all facets of knowledge systems and expertise, to achieve holistic management of estuaries, coasts and oceans
- further developing and expanding risk assessment methods to help protect and rehabilitate the environment in the most resource-efficient manner
- re-evaluate emerging threats and accelerating risks from known threats, such as those threats posed by climate change in the near-term
- consistently applying the risk-based framework () across NSW as a best-practice protocol for managing the impacts of land-use change activities on waterway health
- clarifying agency roles and responsibilities for diffuse source water pollution in NSW
- supporting research into New South Wales’ unique marine biodiversity.
There is scope to introduce qualitative information on coastal, estuarine and marine species and ecosystems of significance to Aboriginal people, to understand how they are faring and ways to care for coastal, marine and estuarine species and their habitats. Qualitative data collection includes oral stories and knowledge about Aboriginal culture and practices. The EPA Aboriginal Knowledge Group has identified a need for management authorities to learn more and apply how Aboriginal cultures and practices improve the care, protection and management of species, their habitats and the overall environment. The Group supports this remerging research and understanding as being essential for understanding and managing all aspects of environmental health.
References
Glasby TM, Gibson PT, West G, Davies P & Voerman S 2015, ‘Range and habitat associations of the native macroalga Caulerpa filiformis in New South Wales, Australia’, Mar. Freshw. Res. 66, 1018–1026
Glasby TM, Gibson PT, Cruz-Motta JJ, 2017, Differences in rocky reef habitats related to human disturbances across a latitudinal gradient, Mar. Environ. Res. 129, 291-303.
Glasby TM & Gibson PT 2020, ‘Decadal dynamics of subtidal barrens habitat’, Marine Environmental Research 154, 104869
Hallett CS, Valesini F, Scanes P, Crawford C, Gillanders BM, Pope A, Udy J, Fortune J, Townsend S, Barton J, Ye Q, Ross DJ, Martin K, Glasby T & Maxwell P 2016, ‘A review of Australian approaches for monitoring, assessing and reporting estuarine condition: II. State and territory programs’, Environmental Science & Policy, 66, pp. 270–81
Harvell CD, Mitchell CE, Ward JR, Altizer S, Dobson AP, Ostfeld RS & Samuel MD 2002, ‘Climate warming and disease risks for terrestrial and marine biota’, Science, 296, pp. 2,158–62
Kilminster K, McMahon K, Waycott M, Kendrick G.A, Scanes P, McKenzie L, O'Brien K.R, Lyons M, Ferguson A, Maxwell P, Glasby T, Udy J, 2015, Unravelling complexity in seagrass systems for management: Australia as a microcosm, Science of the Total Environment 534 (2015) 97–109
Knott NA, Williams J, Harasti D, Malcolm HA, Coleman MA, Kelaher, BP, Rees MJ, Schultz A, Jordan A, 2021, A coherent, representative and bioregional marine reserve network shows consistent change in rocky reef fish assemblages. Ecosphere 12: e03447.
Mitchell ML & Adam P 1989, ‘The decline of saltmarsh in Botany Bay’, Wetlands (Australia), 8, pp. 55–60
Murray A & Keable SJ 2013, ‘First report of Sabella spallanzanii (Gmelin, 1791) (Annelida: Polychaeta) from Botany Bay, New South Wales, a northern range extension for the invasive species within Australia’, Zootaxa, 3670, pp. 394–5
Parker LM, Ross PM & O’Connor WA 2010, Comparing the effect of elevated pCO2 and temperature on the fertilization and early development of two species of oysters, Marine Biology, vol. 157, pp. 2,435–52
Parker LM, Ross PM, O’Connor WA, Pörtner HO, Scanes E & Wright JM 2013, Predicting the response of molluscs to the impact of ocean acidification, Biology, vol. 2, p. 651
Pecl GT, Doubleday Z, Ward T, Clarke S, Day J, Dixon C, Frusher S, Gibbs P, Hobday A, Hutchinson N, Jennings S, Jones K, Li X, Spooner D & Stoklosa R 2011, Risk Assessment of Impacts of Climate Change for Key Marine Species in South Eastern Australia. Part 2: Species profiles, Fisheries and Aquaculture Risk Assessment, Fisheries Research and Development Corporation, Project 2009/070
Rees MJ, Knott NA, Hing ML, Hammond M, Williams J, Neilson J, Swadling DS, Jordan A, 2021,Habitat and humans predict the distribution of juvenile and adult snapper (Sparidae: Chrysophrys auratus) along Australia's most populated coastline, Estuarine, Coastal and Shelf Science 257, 107397
Rees MJ, Jordan A, Price OF, Coleman M, Davis AR, 2014, Abiotic surrogates for temperate rocky reef biodiversity: implication for marine protected areas, Diversity and Distributions 20, 284-296
Rogers K, Wilton KM & Saintilan N 2006, Vegetation change and surface elevation dynamics in estuarine wetlands of southeast Australia, Estuarine, Coastal and Shelf Science 66, 559-569
Ross PM, Parker L, O’Connor WA & Bailey EA 2011, The impact of ocean acidification on reproduction, early development and settlement of marine organisms, Water, vol. 3, 1005
Ross PM, Harvey K, Vecchio EM & Beckers D 2019, ‘Impact of fire and the recovery of molluscs in south-east Australian salt marsh’, Ecol. Manag. Restor. 20, 126-135
Ross PM & Adam P 2013, ‘Climate change and intertidal wetlands’, Biology 2, 445-480
Saintilan N, Wilson NC, Rogers K, Rajkaran A & Krauss KW 2014, ‘Mangrove expansion and salt marsh decline at mangrove poleward limits’, Global Change Biology 20, 147-157
Saintilan N & Williams RJ 1999, ‘Mangrove transgression into saltmarsh environments in south-east Australia’, Global Ecology and Biogeography, 8, pp. 117–24
Scanes PR, Ferguson A & Potts J 2020, ‘Catastrophic events and estuarine connectivity influence presence of aquatic macrophytes and trophic status of intermittently-open coastal lagoons in eastern Australia’, Estuarine, Coastal and Shelf Science 238:106732
Scanes E, Scanes PR & Ross PM 2020, ‘Climate change rapidly warms and acidifies Australian estuaries’, Nat Commun 11, 1803
Scanes E, Parker LM, O’Connor WA & Ross PM 2014, Mixed effects of elevated pCO2 on fertilisation, larval and juvenile development and adult responses in the mobile subtidal scallop Mimichlamys asperrima (Lamarck, 1819), Plos One, e93649
Scanes E, Parker LM, O’Connor WA, Stapp LS & Ross PM 2017, Intertidal oysters reach their physiological limit in a future high-CO2 world, Journal of Experimental Biology, vol. 220(5), pp. 765–74
Umwelt 2017, Towra Point Nature Reserve Ramsar Site, Formal Assessment of Change in Ecological Character, Prepared by Umwelt (Australia) Pty Ltd and Avifauna Research and Services on behalf of the Australian Government Department of the Environment and Energy, Canberra, June 2017
Vergés A, Doropoulos C, Malcolm HA, Skye M, Garcia-Pizá M, Marzinelli EM, Campbell AH, Ballesteros E, Hoey AS, Vila-Concejo A, Bozec YM, and Steinberg PD. 2016. Long-term empirical evidence of ocean warming leading to tropicalization of fish communities, increased herbivory, and loss of kelp. Proceedings of the National Academy of Sciences 113 (48):13791-13796
Vozzo ML, Mayer-Pinto M, Bishop MJ, Cumbo VR, Bugnot AB, Dafforn KA, Johnston EL, Steinberg PD, Strain EMA, 2021, Making seawalls multifunctional: the positive effects of seeded bivalves and habitat structure on species diversity and filtration rates, Marine Environmental Research, 165, 105243
West G & Glasby TM, in press, Interpreting long-term patterns of seagrasses abundance: how seagrass variability is dependent on genus and estuary type. Estuaries and Coasts
West RJ, Larkum AWD & King RJ 1989, Regional studies – seagrasses of south eastern Australia in Larkum AWD, McComb AJ & Shepherd SA (eds), Biology of Seagrasses: A Treatise on the Biology of Seagrasses with Specific Reference to the Australian Region, Elsevier, Amsterdam, The Netherlands, pp. 230-260
Williams J, Jordan, A, Harasti D, Davies P, Ingleton T, 2019, Taking a deeper look: Quantifying the differences in fish assemblages between shallow and mesophotic temperate rocky reefs, PLOS One, 14(3), e0206778
Wright JT, Dworjanyn SA, Rogers CN, Steinberg PD, Williamson JE and Poore AG, 2005, Density-dependent sea urchin grazing: differential removal of species, changes in community composition and alternative community states. Marine Ecology Progress Series, 298, pp.143-156